
Abstract
Background
Cladribine is a useful therapeutic option in RRMS with moderate to high disease activity. Its oral formulation and tolerability make it a useful alternative to infusion therapies. Cladribine is known to deplete CD19+ B lymphocytes, but its effect on immunoglobulin subsets is unclear.
Objective
To identify whether cladribine therapy in pwMS reduces immunoglobulin subset levels as a surrogate marker of infection risk.
Methods
A ‘real-world’ retrospective analysis of 341 pwMS presenting to a single tertiary centre between March 2017 and July 2021. Differences in immunoglobulin levels between cladribine, other disease-modifying therapies and no active treatment were assessed using a univariate ANOVA.
Results
Three hundred and forty-one patients had immunoglobulin levels assessed, with 29 patients treated with cladribine. The mean IgG, IgM and IgA levels on cladribine therapy were 10.44 ± 0.40, 0.99 ± 0.09 and 2.04 ± 0.18 g/L respectively. These were not significantly different from patients not on active treatment. There was a statistically significant reduction in IgG and IgM levels for patients treated with ocrelizumab (9.37 ± 0.19 and 0.68 ± 0.04 g/L) and natalizumab (8.72 ± 0.53 and 0.69 ± 0.12 g/L) compared to patients not on treatment.
Conclusion
Cladribine therapy for RRMS was not associated with immunoglobulin subset deficiencies. This is contrasted to ocrelizumab and natalizumab which demonstrate significant reductions in both IgG and IgM levels.
Keywords
Introduction
Cladribine is a synthetic deoxyadenosine analogue. 1 It is triphosphorylated into its active and cytotoxic form within cells where it disrupts DNA synthesis and promotes apoptosis.1–3 Most cells contain dephosphorylation enzymes that deactivate the cytotoxic metabolite and limit cellular damage.1–3 These enzymes are relatively deficient within lymphocytes, particularly B lymphocytes, resulting in the preferential depletion of B lymphocytes, including CD19+ memory B cells, and to a lesser extent CD4+ and CD8+ T lymphocytes.1–3 The resultant depletion of CD19+ memory B cells leads to a form of immune reconstitution with potential long-term immunomodulating effects despite a limited course of therapy.2,4
Cladribine was initially introduced to treat hairy cell leukaemia where short course intravenous treatments resulted in prolonged molecular tumour responses. 5 More recently cladribine, as an oral formulation, has been shown effective in cohorts of highly active relapsing remitting multiple sclerosis (RRMS) patients from the CLARITY (2010), ORACLE (2014) and CLARITY Extension (2018) trials.6–8 Its oral formulation, limited treatment course, tolerability and effectiveness make cladribine an attractive treatment alternative to infusion therapies in moderately to highly active disease.9,10
As described above, cladribine preferentially depletes CD19+ memory B cells, and to a lesser degree T cells. This finding been corroborated by retrospective analyses of the CLARITY and ORACLE trials which demonstrated an 82.2% relative reduction in CD19+ memory B cells.4,11 Studies of other, albeit more pure CD19+ memory B cell depleting agents such as the CD20 targeted therapies ocrelizumab and rituximab, demonstrate reduced immunoglobulin levels, particularly immunoglobulin M (IgM) levels, corresponding to CD19+ cell depletion.12–16 Therefore, through its effect on memory B cells, one may predict that cladribine would also suppress immunoglobulin levels. Further extrapolative evidence can be drawn from cladribine's previous high-dose intravenous use in Hairy Cell leukaemia and Waldenstrom macroglobulinaemia, whereby cladribine as part of its therapeutic effect has been shown to suppress IgM and immunoglobulin G (IgG) paraproteins.17,18 To date, there is limited evidence of the effect of cladribine on immunoglobulin levels when used as the lower oral doses in RRMS, with a single small retrospective study suggesting no change in the first year after dosing. 19
This is important as low immunoglobulin levels, particularly low IgM and IgG, have been correlated with infection risk in patients on B cell targeting therapies and in patients with acquired or genetic immunodeficiency syndromes.12–15,20 The use of cladribine in RRMS has been associated with an increased risk of some infections, particularly herpes zoster.6,8,9,21,22 The frequency of infections is increased during periods of severe lymphopaenia, a recognised adverse event of cladribine. 21 The effect of immunoglobulin levels on infection risk in cladribine-treated patients is not yet known.
The primary aim of this study was to identify whether oral cladribine therapy in RRMS reduces immunoglobulin subset levels in comparison to B cell depleting therapies, and therefore whether immunoglobulin levels could be considered as a useful surrogate measure of infection risk in cladribine-treated patients. Secondary comparisons were sought between other disease-modifying therapies and MS patients not on active therapy to validate previously published data.
Materials and methods
Patient cohort
This is a real world, retrospective, cohort analysis of people with multiple sclerosis (pwMS) who had immunoglobulin levels measured and recorded within the MSBase database from March 2017 to July 2021. The MSBase database is used to collect and store data for all patients presenting to and receiving care within the public hospital system in the Hunter New England Local Health District (HNELHD) in New South Wales, Australia. Patients were included if they had one or more immunoglobulin G, M or A levels recorded during the study period. Patients who had started or changed treatment within 30 days of the immunoglobulin recording were excluded to minimise confounding. Patients who had previously received immune reconstituting therapies such as alemtuzumab were also excluded as these therapies are thought to have prolonged immunomodulatory effects. Treatments with ≤2 patient data points were excluded.
Ethical approval for conducting this study was granted by the HNELHD Human Research Ethics Committee (protocol 2019/ETH12349) and methods were carried out in accordance with institutional guidelines on human subject experiments. All participants provided written informed consent to participate in this study.
Data collection
Data collected included demographical data of age, gender, treatment type and start date of treatment. IgG, IgM and IgA levels, as well as their date of recording and measuring laboratory were recorded. Previous treatment data was also collected to identify patients who had received immune reconstituting therapies such as alemtuzumab or had recently changed therapies based on the above exclusion criteria.
Statistical analysis
Simple descriptive statistics were used to document basic patient characteristics. Immunoglobulin subset values were adjusted for the normal ranges at each measuring laboratory. Mean IgG/M/A levels and standard errors comparing treatment groups were derived from a univariate ANOVA analysis adjusting for age, gender and time on treatment. Correlations were assessed using Pearson's correlation test using the no active treatment group as the control. Type I error (∝;) and therefore statistically significant difference pre-defined as.05, and then was adjusted for multiple comparisons with the approximation of ∝;′ = ∝;/(n), where (n) is the number of comparators.
Results
Demographics/patient characteristics
Three hundred and forty-seven patients had at least one IgG, IgM or IgA value recorded during the study period. A total of six patients were excluded from the analysis as per the defined exclusion criteria (alemtuzumab[2], ofatumumab[2], siponimod[1], mycophenolate[1]), leaving 341 patients in the analysis. IgG was the most commonly recorded value, with 338 (99.12%) patients having IgG recorded compared to 279 (81.82%) and 276 (80.94%) patients for IgM and IgA, respectively.
Of the included patients the mean age was 47.00 ± 12.91 years with a range of 17–78 years (Table 1). Seventy-eight percent were female and 71% were defined as RRMS. The most common treatment at the time of immunoglobulin recording was ocrelizumab at 134 (39.3%) patients followed by cladribine at 29 (8.5%) patients. Twenty eight (96.6%) of the cladribine-treated patients were treatment naïve prior to cladribine therapy. Ninety-seven (28.4%) patients were on no treatment at the time of immunoglobulin level measurement, and the majority of these were pwMS with immunoglobulins taken prior to treatment initiation (82.5%). There was no statistically significant difference in mean age between the treatment groups.
Baseline patient demographics.

Note: *SD, standard deviation. # B cell-specific treatments include ocrelizumab and rituximab. ^Non-B cell treatments include cladribine, natalizumab, fingolimod, dimethyl fumarate, glatiramer acetate, teriflunomide and interferon β. No significant difference in ages between treatment categories.
Immunoglobulin G (IgG)
Estimated marginal means with standard error of the mean (SEM) are demonstrated for all treatment categories (Figure 1) and B cell versus non-B cell treatments (Figure 2). There was no statistically significant difference between IgG levels in the no active treatment (10.98 ± 0.26 g/L) and cladribine (10.44 ± 0.40 g/L) groups (p = .256). There was a statistically significant reduction in IgG levels in the ocrelizumab (9.37 ± 0.19 g/L, p < .001) and natalizumab (8.72 ± 0.53 g/L, p < 0.001) groups in comparison to the no active treatment group. There was a trend towards a reduction in the fingolimod (9.55 ± 0.53 g/L, p = .029) group but this did not meet the adjusted p value of <.005 for the predicted increase in type I error with multiple comparisons. Other treatment categories were not statistically different from the no active treatment group.
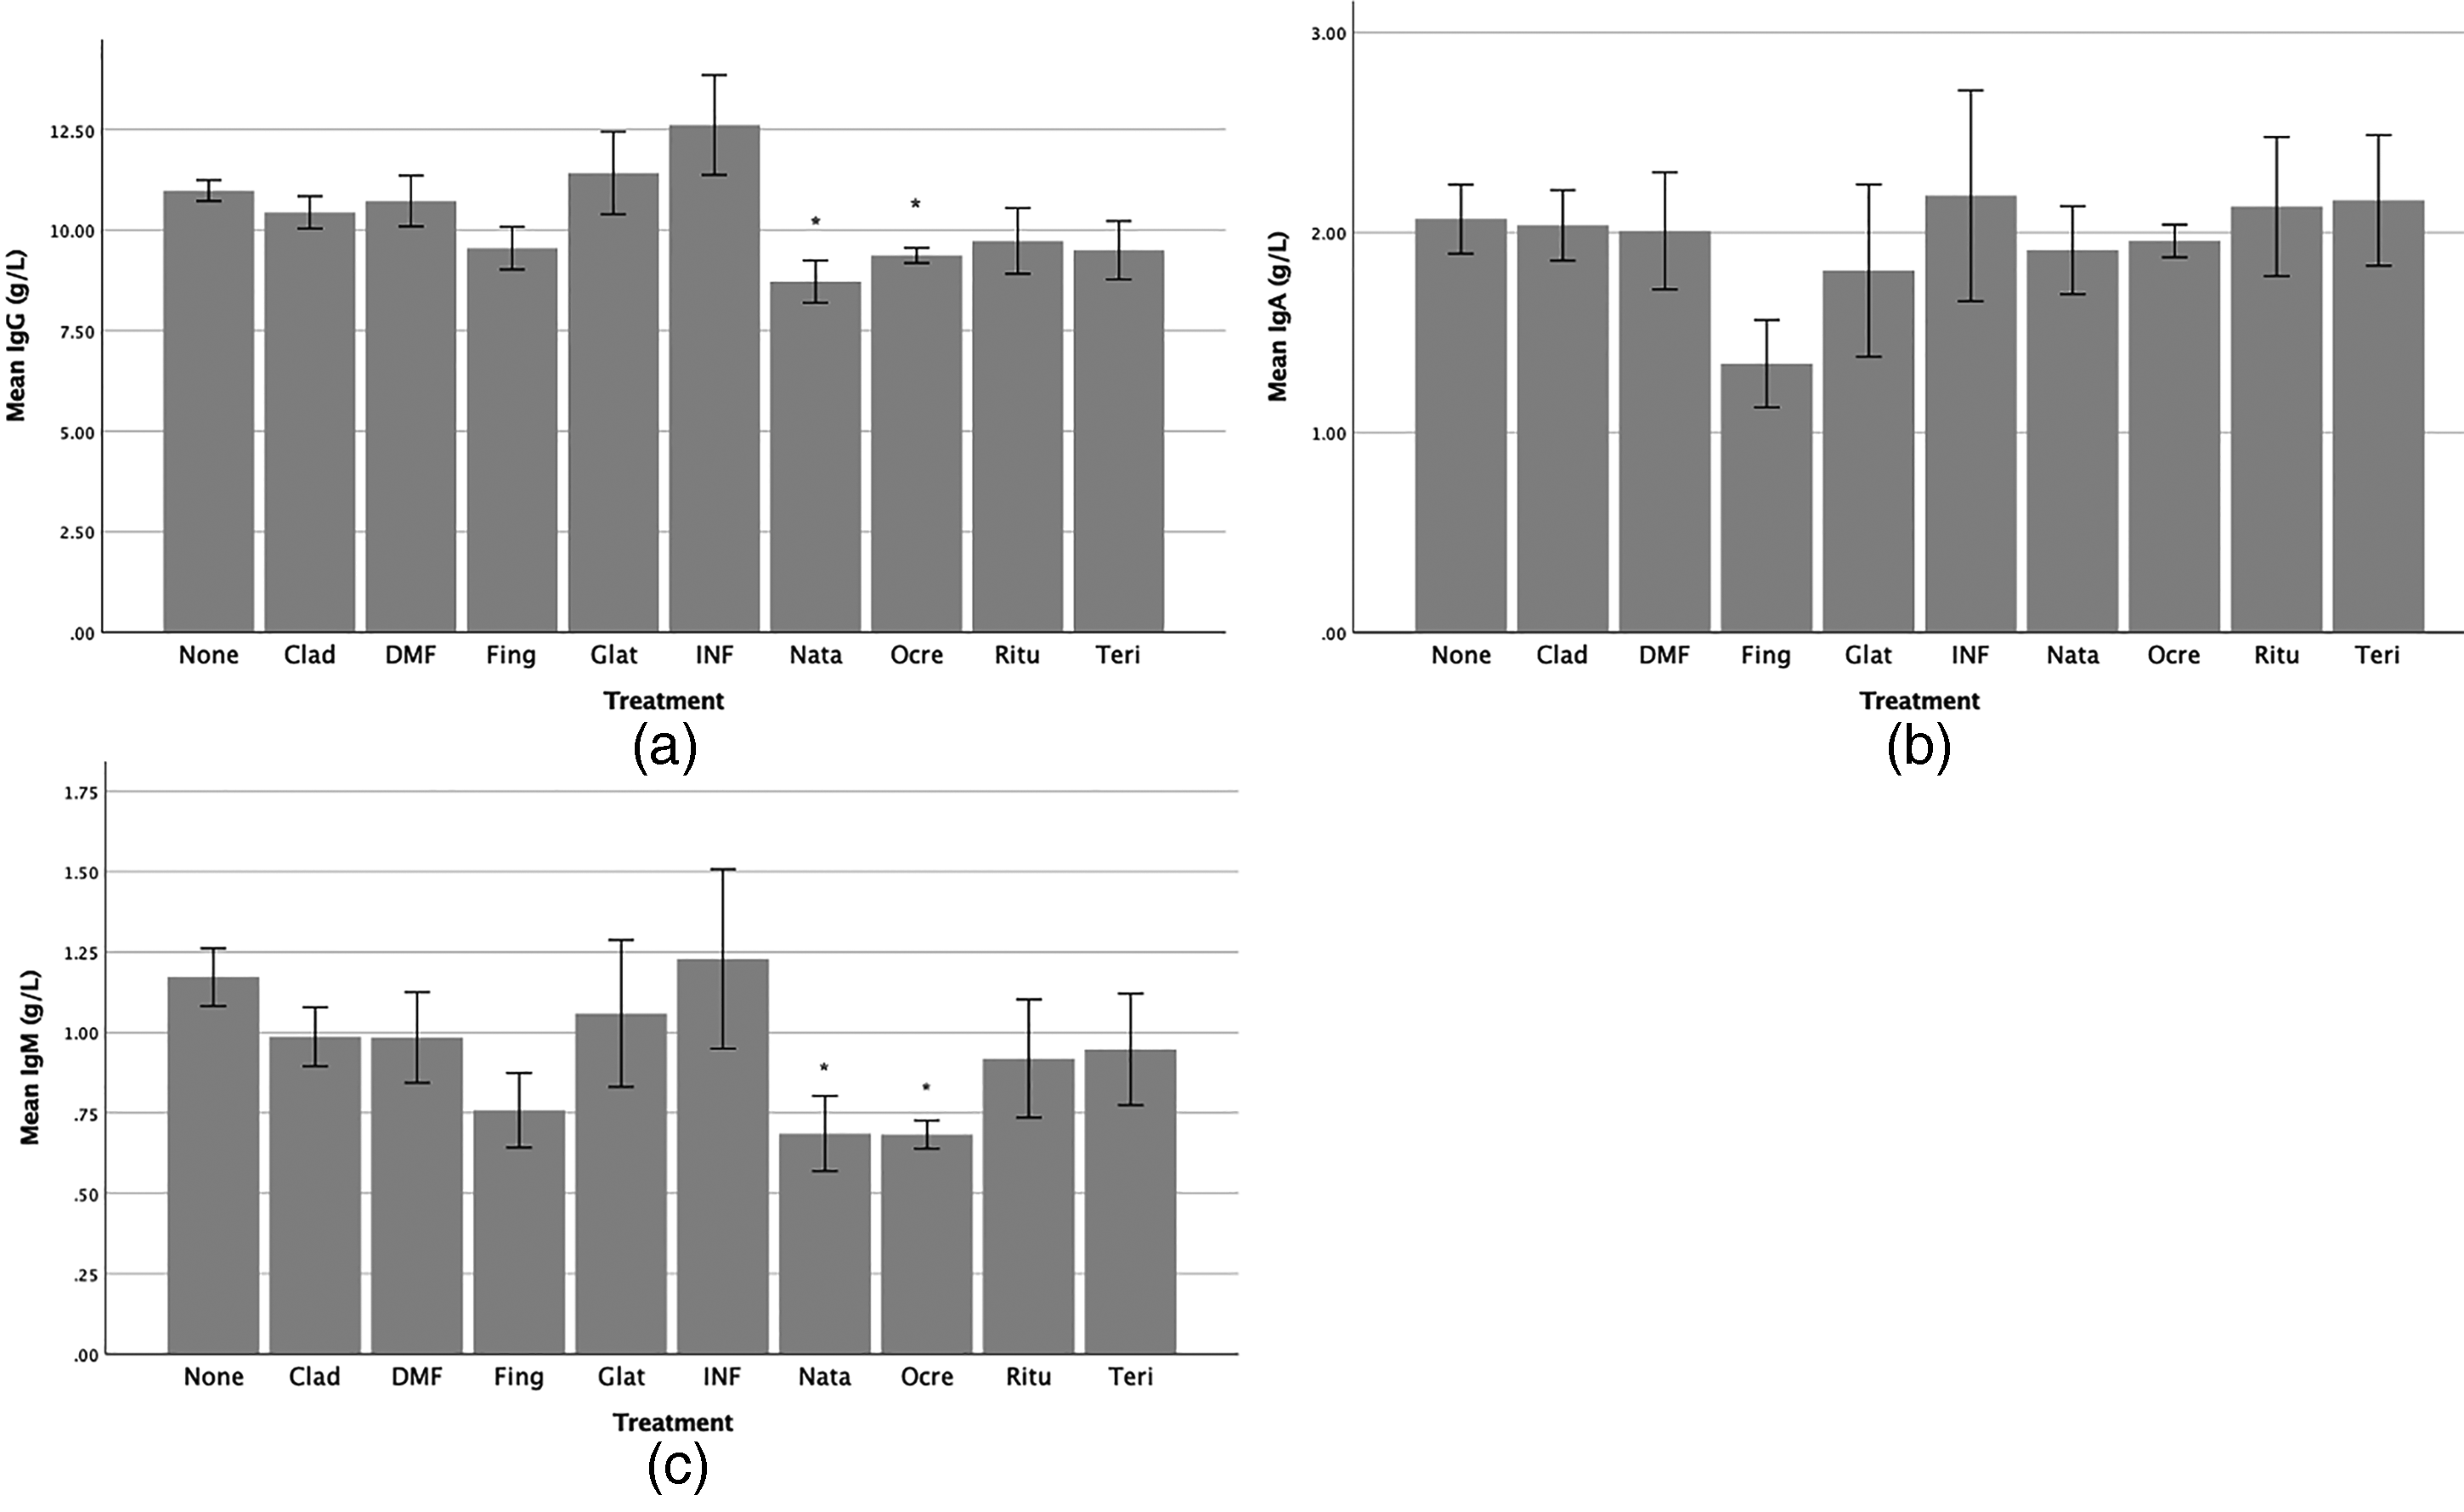
Estimated marginal means of IgG (a), IgA (b) and IgM (c) by treatment group. Adjusted for age and time on treatment. Error bars represent ±1 SEM. Significant difference to the control group (no active treatment) is marked with *p < .005.

Estimated marginal mean IgG (a), IgA (b) and IgM (c) by treatment mechanism of action including B cell targeting therapies, no active treatment and agents with mixed actions (other). B cell therapies include ocrelizumab and rituximab. Adjusted for age and time on treatment. Error bars represent ±1 SEM. Significant difference to the control group (no active treatment) is marked with *p < .01.
The estimated marginal mean for B cell treatments was 9.52 ± 0.22 g/L, which was statistically significantly lower than the no active treatment (10.96 ± 0.30 g/L, p < .001) group, even when the p value was adjusted to <.01 for the predicted increase in type I error with multiple comparisons. There was no significant difference between the cladribine (10.35 ± 0.50 g/L) and the B cell treatment group (p = .132).
Immunoglobulin M (IgM)
There was no statistically significant difference in IgM levels between the no active treatment (1.17 ± 0.09 g/L) and cladribine (0.99 ± 0.09 g/L) groups (p = .128) (Figure 1). Reduced levels of IgM, when compared to the no active treatment group, were seen for patients treated with ocrelizumab (0.68 ± 0.04 g/L, p < .001) and natalizumab (0.69 ± 0.12 g/L, p = .003). There was a trend towards a reduction in the fingolimod (0.76 ± 0.12 g/L, p = .012) group compared to the no active treatment group but this did not reach significance after adjustment of the p value to <.005 for multiple comparisons. Other treatment categories were not statistically different from the no active treatment group.
The estimated marginal mean for B cell treatments was 0.67 ± 0.05 g/L, which was statistically significantly lower than the no active treatment (1.11 ± 0.11 g/L, p < .001) group, but not the cladribine group (0.94 ± 0.11 g/L, p = .028), when the p value was adjusted to <.01 for the predicted increase in type I error with multiple comparisons (Figure 2).
Immunoglobulin A (IgA)
There was no significant difference in IgA levels between the no active treatment (2.07 ± 0.17 g/L) and cladribine group (2.04 ± 0.18 g/L, p = .892), nor any other treatment group (Figure 1). There was a trend towards a reduction in the fingolimod (1.34 ± 0.22 g/L, p = .02) group but this did not satisfy the adjusted p value of <.005 for multiple comparisons.
There was no statistically significant difference in IgA levels between pooled B cell treatments (2.01 ± 0.09 g/L), cladribine (2.16 ± 0.23 g/L) and the no treatment group (1.97 ± 0.21 g/L) (Figure 2).
Relationship of time post-cladribine treatment and immunoglobulin levels
We assessed whether Ig levels were correlated with time on cladribine therapy. IgG and IgM levels declined over time but the correlations were not statistically significant (r = −0.12, p = .55 and r = −0.1, p = .62, respectively). Conversely, IgA levels increased over time but this was also not statistically significant (r = 0.24, p = .22).
A comparison between patients who had started cladribine with in the last 6 months (n = 6) to those on treatment 6–12 months (n = 17) to those on treatment for >12 months (n = 21) was performed to assess for any lag in immunoglobulin level changes. Of the patients in the >12-month group 67% had received the second yearly cladribine treatment course. There were no significant differences between immunoglobulin levels measured in the first 6 months, 6–12 months or >12 months of cladribine treatment (Figure 3).

Estimated mean IgG (a), IgA (b) and IgA (c) by time since initiation of cladribine dosing (<6 months vs. 6–12 months vs. >12 months). Error bars represent the 95% confidence intervals.
Discussion
This study demonstrates a significant reduction in both IgG and IgM levels for pwMS treated with ocrelizumab or natalizumab. In contrast, treatment with cladribine was not associated with any significant difference in immunoglobulin levels compared to a control group of pwMS not on active treatment. There was a trend towards reduced IgG and IgM levels of pwMS treated with fingolimod, but this did not reach significance when the p value was adjusted to compensate for the expected increase in type I error seen with multiple comparisons. Rituximab unexpectedly did not suppress immunoglobulin levels in this analysis; however, the accuracy of this assessment is limited by the low level of patients on rituximab included (n = 7).
Reduced levels of both IgG and IgM, as reported in this study, have also been previously reported in patients treated with ocrelizumab, fingolimod and natalizumab.13,23,24 Ocrelizumab primarily targets CD20+ B cells but has also been shown to suppress CD19+ B cells, explaining its propensity to lower immunoglobulin levels. 25 Natalizumab has been shown to increase peripheral blood B and T lymphocyte counts, likely due to increased release of haematopoietic precursor cells. There is a disproportionate elevation of CD19+ cell counts compared to CD4+/CD8+ in the peripheral blood suggesting that natalizumab may impair B cell homing to secondary lymphoid organs and this may be the cause of reduced immunoglobulin levels through impairment of plasma cell function.16,26 The mechanisms by which fingolimod suppresses immunoglobulin levels remains unknown.
The lack of any significant difference in immunoglobulin subset levels in patients treated with cladribine suggests that, unlike ocrelizumab, low immunoglobulin levels are unlikely to explain infection risk in patients treated with cladribine. 21 This is somewhat unexpected on the basis that cladribine has been shown to significantly reduce levels of antibody-producing CD19+ B cells as well as T lymphocytes.4,11,19 One possible explanation for this is that the CD19+ B cell suppression seen with cladribine is transient, with levels returning towards threshold within 30 weeks. 11 This supports the concept that cladribine acts via immune reconstitution rather than long-term immunosuppression. The absence of reduced total immunoglobulin subset levels is correlated with and supported by studies demonstrating appropriate humoral responses to Covid-19 immunisation in cladribine-treated patients but impaired responses in ocrelizumab- and fingolimod-treated patients.27,28 Therefore the increased rate of herpes zoster infections in cladribine-treated patients is more likely to be related to T cell function, with cell-mediated immunity the major component of the herpes zoster specific immune response.21,29
Any suppression of immunoglobulin levels in cladribine-treated patients may be expected to correlate with the timing of lymphocyte nadirs post dosing. CD19+ cells have been shown to reach a nadir 8 weeks after treatment before improving to threshold levels by 30 weeks. 11 The secondary analysis we performed did not show any significant correlation between IgG, IgM or IgA levels and time on cladribine treatment. Nor were immunoglobulin levels suppressed early post cladribine treatment as is seen with lymphocyte subset suppression. The cladribine cohort size does limit the accuracy of conclusions that can be drawn from this study, and larger cohorts should be a focus for future studies.
The main limitation of our study is that infection events were not prospectively measured and therefore not directly correlated with immunoglobulin levels. This is a factor of the retrospective and ‘real-world’ design of the study, whereby infection events, particularly when mild in nature, are not always documented in the outpatient setting. To accurately record infection events a prospective clinical study would be necessary. A further limitation of the study is the composition of the control group used. The control group consisted of pwMS who were not currently on treatment. This included newly diagnosed patients (82.5%), patients with contraindications to treatment as well as patients with progressive multiple sclerosis for which treatment options are limited. Therefore the characteristics of the control group may not accurately reflect that of patients receiving active treatment. This is important as patients with secondary progressive multiple sclerosis have previously been shown to have lower baseline IgG levels than patients with RRMS. 23
The strength of this study lies in its ‘real-world’ design and therefore applicability to the care and monitoring of pwMS in the community. Based on the results presented, immunoglobulin monitoring in patients treated with cladribine, in comparison to other B cell depleting therapies, is not thought to be a useful surrogate measure of infection risk.
Conclusions
In conclusion, we have shown that ocrelizumab and natalizumab treatment in pwMS results in reduced mean IgG and IgM levels when compared to pwMS not on active treatment. This effect was not seen for cladribine therapy whereby immunoglobulin levels were not significantly different to pwMS controls not on treatment. The absence of reduced immunoglobulin levels correlates with the relatively low risk of infectious complications in cladribine-treated patients and suggests that infection risk in patients treated with cladribine is not likely to be related to immunoglobulin levels. This is contrasted to B cell depleting therapies whereby reduced immunoglobulin levels are thought to predict infection risk. The absence of significant immunoglobulin changes in patients treated with cladribine suggests a more important role for cellular immune function in preventing infection in cladribine-treated patients. Therefore monitoring total lymphocyte counts and subsets may be a better predictor of infection risk in cladribine-treated pwMS.
Footnotes
Declaration of conflicting interests
The author(s) declared the following potential conflicts of interest with respect to the research, authorship, and/or publication of this article: JLS serves on the editorial board of Multiple Sclerosis and Related Disorders as Editor in Chief. Her institution has received investigator-initiated grants and honoraria for membership on advisory boards and speaker agreements from Biogen, Merck, Roche and Novartis.
Funding
The author(s) received no financial support for the research, authorship and/or publication of this article.