
Abstract
Background
Fingolimod is a sphingosine 1-phosphate receptor modulator approved for relapsing MS. Long-term effects on the immunological profile are not fully understood.
Objective
Investigate fingolimod's temporal effects on immune cell subsets, and safety outcomes.
Methods
In FLUENT, a 12-month, prospective, non-randomized, open-label, phase IV study, adult participants received fingolimod 0.5 mg/day. Changes in immune cell subsets, anti-John Cunningham virus (JCV) antibody index, and serum neurofilament levels were assessed.
Results
165 fingolimod-naive and 217 participants treated for 2–12 years in routine clinical practice were enrolled. Levels of all monitored peripheral lymphocyte subsets were reduced from month 3 in fingolimod-naive participants. Greatest reductions occurred in naive and central memory CD4+ and CD8+ T cells, and in naive and memory B cells. Most lymphocyte subset levels remained stable in the continuous fingolimod group. Components of the innate immune system remained within reference ranges. No increase in JCV seropositivity was observed. No single cellular subset correlated with anti-JCV antibody index at any time point. Neurofilament levels remained within healthy adult reference limits throughout. No opportunistic infections were reported; no new or unexpected safety signals were observed.
Conclusion
FLUENT provides insights into the utility of immunological profiling to evaluate therapy response and potential infection risk.
Keywords
Introduction
Fingolimod is a sphingosine-1-phosphate (S1P) receptor modulator approved for the treatment of relapsing forms of MS. 1 Fingolimod inhibits lymphocyte egress from lymph nodes, thereby impairing infiltration of potentially autoreactive lymphocytes into the CNS.2,3 Previous S1P receptor modulator studies have not comprehensively evaluated changes in the innate (neutrophils, basophils, eosinophils, monocytes, natural killer [NK] cells) and adaptive (T cells, B cells) immune systems and in specific subsets of these immune cells during fingolimod treatment. Information is lacking about such treatment-related effects on the immune system in the long term.
Rare opportunistic infections, including progressive multifocal leukoencephalopathy (PML) and cryptococcal meningitis, were observed with fingolimod in the post-marketing setting.1,4–6 Therefore, it is important to assess the impact of fingolimod on anti-John Cunningham virus (JCV) antibody status at treatment initiation and long term. To improve MS management, there is a need for biomarkers of disease activity and treatment response. Serum neurofilament light chain (NfL) levels increase in patients with MS following a relapse and disability worsening, 7 decrease with treatment, 8 and predict clinical and MRI outcomes.9,10
The FLUENT study investigated short- and long-term effects of fingolimod treatment on immune cell subsets, JCV index, NfL, and safety outcomes in participants with relapsing MS (RMS) who were either fingolimod-naive or had received fingolimod continuously for 2–12 years in routine clinical practice. 11
Methods
Study design
The design of FLUENT has been reported previously. 11 Briefly, FLUENT was a prospective, multicenter, non-randomized, open-label, phase IV study in adult participants with RMS in the United States. Participants were stratified by fingolimod experience: Cohort 1 included fingolimod-naive individuals initiating therapy, and Cohort 2 comprised participants continuously treated with fingolimod 0.5 mg/day for ≥2 years. The study design thus provided data on both short- and long-term changes in immune cell subsets during fingolimod therapy. The study consisted of a screening period of up to four weeks and a fingolimod treatment period of 12 months.
Participants and study treatment
Eligible participants were ≥18 years of age with RMS. 12 Exclusion criteria aligned with the Gilenya US Prescribing Information (see Supplementary Methods). 1 Fingolimod-naive participants underwent first-dose observation, after which fingolimod was self-administered as in the continuously fingolimod-treated cohort.
Study objectives
The primary objective was to characterize phenotypic changes in the cellular components of the immune system, including their subsets, over six months of fingolimod treatment. Secondary objectives included evaluation of changes in immune cell subsets and of safety (including anti-JCV antibody status/index) over 12 months of treatment. Changes in NfL levels were assessed as an exploratory biomarker of MS disease severity.
Study assessments
Blood samples (60–80 mL) were obtained from participants at baseline and at months 3, 6, and 12. For participants who discontinued the study, a final visit was scheduled within 14 days of the last fingolimod dose. All samples collected were analyzed at a central laboratory by routine hematology and fluorescence-activated cell sorting (FACS). Biomarkers used to identify immune cell subsets are described in the Supplementary Methods. For the primary outcome, absolute change from baseline to month 6 was assessed for various immune cell subsets, as well as differential CD4+ , CD8+ , and CD19+ cell counts. For secondary and exploratory outcomes, anti-JCV antibody index/status (STRATIFY JCV DxSelect; Focus Diagnostics, Cypress, CA), NfL levels (SIMOA NF-light® immunoassay; Quanterix, Billerica, MA), and immune cell subsets were measured at baseline and at months 3, 6, and 12. The Patient Determined Disease Steps (PDDS) scale was used to assess self-reported disability at these time points. The PDDS has nine ordinal levels, in which 0 represents “normal” and 8 represents “bedridden.” PDDS is based on “Disease Steps” scale, 13 is described as PDDS in the form used by Lo et al. 14 and was shown to correlate well with the EDSS. 15
Safety evaluations
Adverse events (AEs) were recorded by the treating physician at each visit. Serious AEs (SAEs) during treatment or up to 30 days after the last dose of fingolimod were reported to Novartis within 24 h of occurrence; SAEs experienced after this period were reported if deemed fingolimod related.
Statistical analyses
Descriptive statistics for outcome measures are reported with standard deviations (SDs) calculated for mean values. An analysis of covariance model analyzed changes in immune cell subsets from baseline to month 6, with sex and cohort as factors, and duration of disease and corresponding baseline as covariates. Pearson correlation coefficients were used to evaluate the relationship between changes in cellular subsets and in anti-JCV index. To estimate mean change in primary and secondary variables from baseline at months 3, 6, and 12, a sample size of 200 participants per cohort provided precision of estimates within 0.14 of the corresponding SD of the variables of interest.
Standard protocol approvals, registrations, and participant consent
FLUENT was conducted according to International Council for Harmonisation E6 Guideline for Good Clinical Practice, which has its origin in the Declaration of Helsinki. The study protocol was reviewed by the Independent Ethics Committee or Institutional Review Board for each center. Each participant provided written, informed consent at screening. FLUENT is registered at ClinicalTrials.gov: NCT03257358.
Results
Participant characteristics
The first participant enrolled in FLUENT on 19 September 2017; the last participant's final visit was on 28 June 2019. Overall, 165 fingolimod-naive and 217 continuously fingolimod-treated participants enrolled (Figure 1). Compared with continuously treated participants, fingolimod-naive participants were younger, and relapsed more often in the two years before enrollment (Table e-1). In the continuously fingolimod-treated cohort, the median (interquartile range [IQR]) pre-study fingolimod exposure was 4.1 (3.1–6.1) years, with a range of 2.0–11.0 years (the date of fingolimod initiation pre-study was known for 60% of continuously treated participants). Per protocol, there was no prior exposure to fingolimod in the naive group; median (IQR) on-study treatment exposure was 1.0 (0.4–1.0) years (Table e-1).

Patient disposition CONSORT flow diagram.
Effect of fingolimod on immune cell subsets
Changes in white blood cell composition up to month 12
During the first six months of treatment (primary endpoint), all monitored T- and B-lymphocyte subsets in fingolimod-naive participants decreased to levels seen in the continuously fingolimod-treated group, whereas levels within the continuously treated group remained stable (Table e-2). Among CD4+ and CD8+ T cells, effector memory subsets were least affected by treatment, remaining close to, or within, the lower limits of normal, respectively. In both cohorts, mean monocyte cell levels increased while neutrophil and NK cell levels decreased but remained within the baseline SD and respective reference ranges.
In fingolimod-naive participants, absolute white blood cell (WBC) counts (Figure 2) dropped over the first three months of treatment (mean change [SD]: −1955.37 [1990.56] cells/µL) but remained within normal limits (Figure 2A and C). This was driven by the reduction in lymphocytes (mean change [SD]: −1375.95 [733.66] cells/µL), which fell below normal limits by month 3 and remained at this level thereafter (Figure 2A and D). There was a small drop in neutrophil levels by month 3, persisting through month 12 but remaining within normal limits (Figure 2A and E). Beyond slight fluctuations, no changes were observed in absolute levels of monocytes, basophils, or eosinophils (Figure 2A and F–H). By month 3, the absolute compositions of the WBC population in the two cohorts were indistinguishable (Figure 2A).

Absolute and differential change in WBC composition (safety set). Mean absolute cell counts are plotted together in (A); differential changes in mean cell counts as a percentage of overall WBC count are shown in (B). In the subsequent panels, absolute cell counts/µL (solid lines) and SD (naive, mauve shading; continuous, pale blue shading; overlap, mid-blue shading) over time are shown for overall WBC (C), lymphocytes (D), neutrophils (E), monocytes (F), eosinophils (G), and basophils (H). Values were determined at baseline and at months 3, 6, and 12. Data lines and shading are used to show trends. Gray shading denotes the normal reference range of absolute cell counts/µL for each cell type.20–22
In the fingolimod-naive group, the reduction in the number of lymphocytes translated into a reduced differential percentage level (as a proportion of the WBC population) between baseline and month 3, which remained stable thereafter (Figure 2B). Although absolute neutrophil counts also decreased, their differential percentage increased by month 3 and remained stable thereafter; this increase is probably due to a relatively greater concurrent reduction in lymphocyte count. The differential percentages of monocytes, basophils, and eosinophils remained relatively stable, increasing slightly at month 3 and remaining stable thereafter (Figure 2B). As the absolute number of these cells did not increase, any changes in differential percentages at month 3 were likely driven by the concurrent reduction in lymphocyte counts.
In the continuously treated group, the absolute WBC count remained stable over 12 months. In this period, there were no changes in the levels (beyond slight fluctuations) or differential WBC percentages of lymphocytes, neutrophils, monocytes, basophils, or eosinophils (Figure 2A–H).
As such, the effects of fingolimod appeared limited to the adaptive immune system; components of the innate immune system were not significantly affected by fingolimod in either cohort (see Figure 2 and Supplementary Results).
Changes in lymphocyte subsets over 12 months
Absolute numbers of all monitored lymphocyte subsets decreased in fingolimod-naive participants over the first three months of treatment, then stabilized (Figure 3). The greatest reductions (mean change [SD]) were seen in CD4+ T cells (−867.18 [440.22] cells/µL), CD8+ T cells (−286.68 [205.42] cells/µL), and B cells (−228.95 [155.85] cells/µL), with CD4+ T cells and B cells stabilizing below the limit of normal. Reductions in CD56+ NK cell levels were small in comparison, remaining within normal limits. Only the reduction in CD4+ T cell counts in fingolimod-naive participants translated into a reduced differential percentage in the overall lymphocyte population at month 3 (mean change [SD]: −36.63% [14.29%]) and remained stable thereafter (Figure 3). In the continuously fingolimod-treated cohort, no changes in the differential composition of lymphocyte subsets were observed over 12 months.
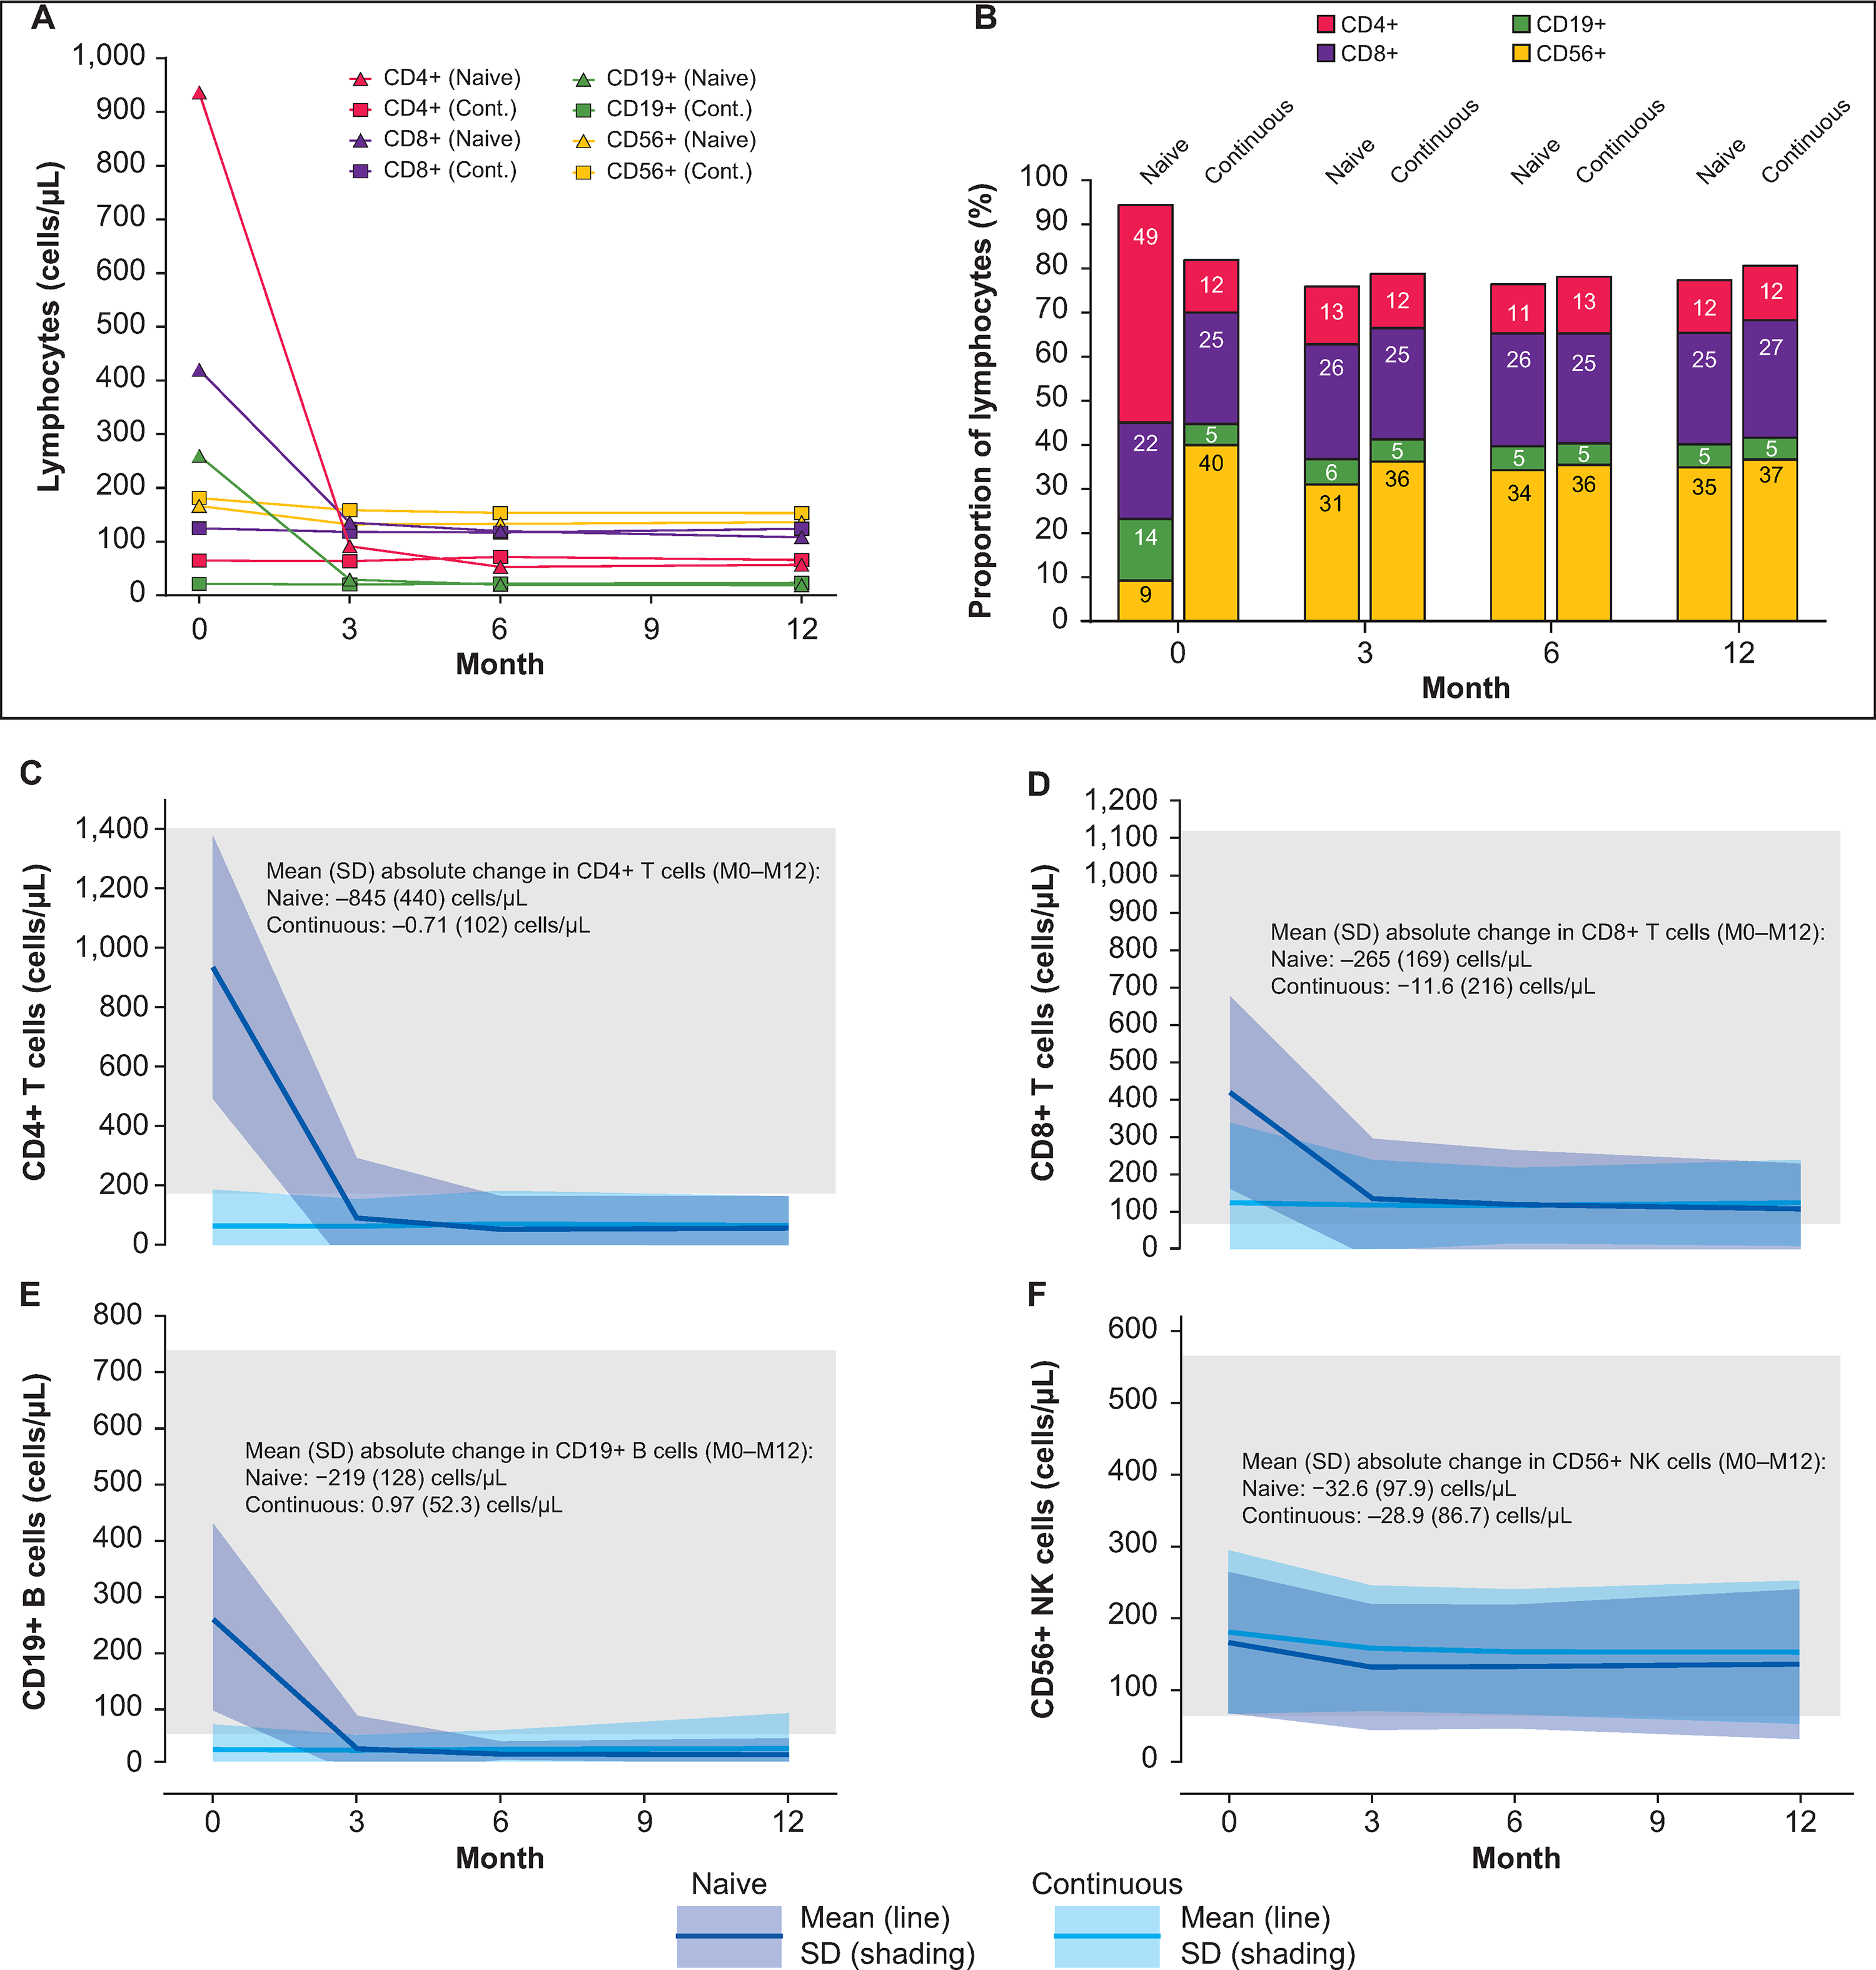
Absolute and differential change in lymphocyte composition (safety set). Mean absolute cell counts are plotted together in (A); differential changes in mean cell counts as a percentage of overall lymphocyte counts are shown in (B). In the subsequent panels, absolute cell counts/µL (solid lines) and SD (naive, mauve shading; continuous, pale blue shading; overlap, mid-blue shading) over time are shown for CD4+ T cells (C), CD8+ T cells (D), CD19+ B cells (E), and CD56+ NK cells (F). Values were determined at baseline and at months 3, 6, and 12. Data lines and shading are used to show trends. Gray boxes denote the reference range of absolute cell counts/µL for each cell type. 20
Changes in CD4+, CD8+, and CD19+ subsets over 12 months
A detailed analysis investigated changes in the relative abundance of functionally different CD4+ , CD8+ , and CD19+ lymphocyte subgroups (Figures 4–6). In fingolimod-naive participants, numbers of each CD4+ subset decreased from baseline to month 3, then stabilized below normal limits (Figure 4). Decreases in naive and central memory CD4+ T-cell counts were particularly pronounced (mean change [SD]: −402.58 [265.55] cells/µL and −354.29 [224.37] cells/µL, respectively). Ordered by decreasing magnitude, reductions in absolute numbers at month 3 were naive > central memory > effector memory cells. However, only the reduction in naive cells translated into a reduction in their proportion of overall CD4+ T cells (mean change from baseline to month 3 [SD]: −30.5% [14.37%]). Indeed, a consequence of the relatively large decrease in naive cell numbers was a slight increase in the differential percentages of effector memory and Th1 cells by month 3 (mean change [SD]: 24.8% [16.26%] and 7.0% [12.05%]), respectively); differential percentages of most other CD4+ T-cell subsets were unchanged.

Changes in CD4+ subsets across 12 months of treatment (safety set). Absolute and differential change in CD4+ T cell composition in fingolimod-naive and continuously fingolimod-treated patients over 12 months of treatment. Values were determined at baseline and at months 3, 6, and 12. Data lines and shading are used to show trends. Gray boxes denote the normal reference range of absolute cell counts/µL for each cell type.20,21 Mean absolute counts/µL for the overall CD4+ T-cell population and different subpopulations are plotted together in (A). Differential changes in mean cell counts for different subpopulations as a percentage of overall CD4+ T-cell count are shown in (B). In the subsequent panels, absolute cell counts/µL (solid lines) and SD (naive, mauve shading; continuous, dark gray shading; overlap, drab purple shading) over time are shown for naive cells (C), central memory cells (D), effector memory cells (E), Th1+ cells (F), Th2+ cells (G), and Th17+ cells (H).

Changes in cd8+ subsets across 12 months of treatment (safety set). Absolute and differential change in CD8+ T-cell composition in fingolimod-naive and continuously fingolimod-treated patients over 12 months of treatment. Values were determined at baseline and at months 3, 6, and 12. Data lines and shading are used to show trends. Gray boxes denote the normal reference range of absolute cell counts/µL for each cell type.20,21 Mean absolute counts/µL for the overall CD8+ T-cell population and different subpopulations are plotted together (A). Differential changes in mean cell counts for different subpopulations as a percentage of overall CD8+ T-cell count are shown in (B). In the subsequent panels, absolute cell counts/µL (solid lines) and SD (naive, pale blue shading; continuous, gray shading; overlap, drab blue shading) over time are shown for naive cells (C), central memory cells (D), and effector memory cells (E).

Changes in CD19+ subsets across 12 months of treatment (safety set). Absolute and differential change in CD19+ B-cell composition in fingolimod-naive and continuously fingolimod-treated patients over 12 months of treatment. Values were determined at baseline and at months 3, 6, and 12. Data lines and shading are used to show trends. Gray boxes denote the normal reference range of absolute cell counts/µL for each cell type.20,21 Mean absolute counts/µL for the overall CD19+ B-cell population and different subpopulations are plotted together in (A). Differential changes in mean cell counts for different subpopulations as a percentage of overall CD19+ B-cell count are shown in (B). Variation in differential B-cell data across the 12 months of treatment accounts for the sum of the percentage mean values exceeding 100% at all time points. In the subsequent panels, absolute cell counts/µL (solid lines) and SD (naive, pale green shading; continuous, gray shading; overlap, drab green shading) over time are shown for naive cells (C), memory cells (D), and regulatory cells (E).
Absolute values of all CD8+ T-cell subsets decreased over the first three months of treatment in fingolimod-naive participants. Mean changes (SD) from baseline by subset were: naive, −146.24 (117.64) cells/µL; central memory, −84.68 (74.40) cells/µL; and effector memory, −52.71 (75.37) cells/µL (Figure 5). Levels were stable thereafter. Only naive and central memory cells had lower differential percentages at month 3 than at baseline (mean change [SD]: −29.8% [21.58%] and −12.7% [22.90%], respectively).
In the continuously fingolimod-treated cohort, absolute levels and the differential percentages of all CD4+ and CD8+ T-cell subsets remained stable over the 12-month treatment period. By month 3, the absolute and differential composition of the CD4+ and CD8+ populations in the two cohorts were indistinguishable (Figures 4 and 5).
In the fingolimod-naive cohort, absolute levels of both naive and memory B-cell subsets decreased over the first three months of treatment (mean change [SD]: −176.18 [129.69] cells/µL and −54.57 [71.59] cells/µL, respectively), stabilizing below normal limits. A small reduction in regulatory B-cell counts at month 3 (mean change [SD]: −7.71 [10.59] cells/µL) was observed, but they remained within normal limits (Figure 6). The differential percentage of naive B cells remained relatively unchanged at approximately 80% of all B cells over 12 months of treatment. The differential percentage of memory B cells gradually approached values seen in the continuously fingolimod-treated cohort (11–12%). The differential percentage of regulatory B cells in the fingolimod-naive cohort increased during treatment, mainly in the first three months (mean change [SD]: 16.3% [11.67%]), probably due to the reduced overall numbers of naive and memory B cells. No changes in absolute numbers or differential percentages of B-cell subsets were seen in the continuously treated cohort, apart from small fluctuations within 1 SD.
Other cellular analyses
Fingolimod had no discernable effect on levels of red blood cells or platelets in either cohort (see Supplementary Results). When stratified by sex and disease duration, results showed no relationship between these factors and changes in immune cell populations.
Effect of fingolimod on Nfl and anti-JCV antibody index
In both cohorts, observed NfL levels were within normal limits for healthy adults throughout the study (Figure 7). In fingolimod-naive participants, a slight decrease in NfL was observed at month 3 (mean change [SD]: −2.78 [8.07] pg/mL), reaching levels seen in the continuously fingolimod-treated group and remaining stable thereafter. In the continuously treated group, NfL levels were stable from baseline (mean [SD]: 9.59 [7.56] pg/mL) to month 12 (mean [SD]: 9.80 [8.87] pg/mL).
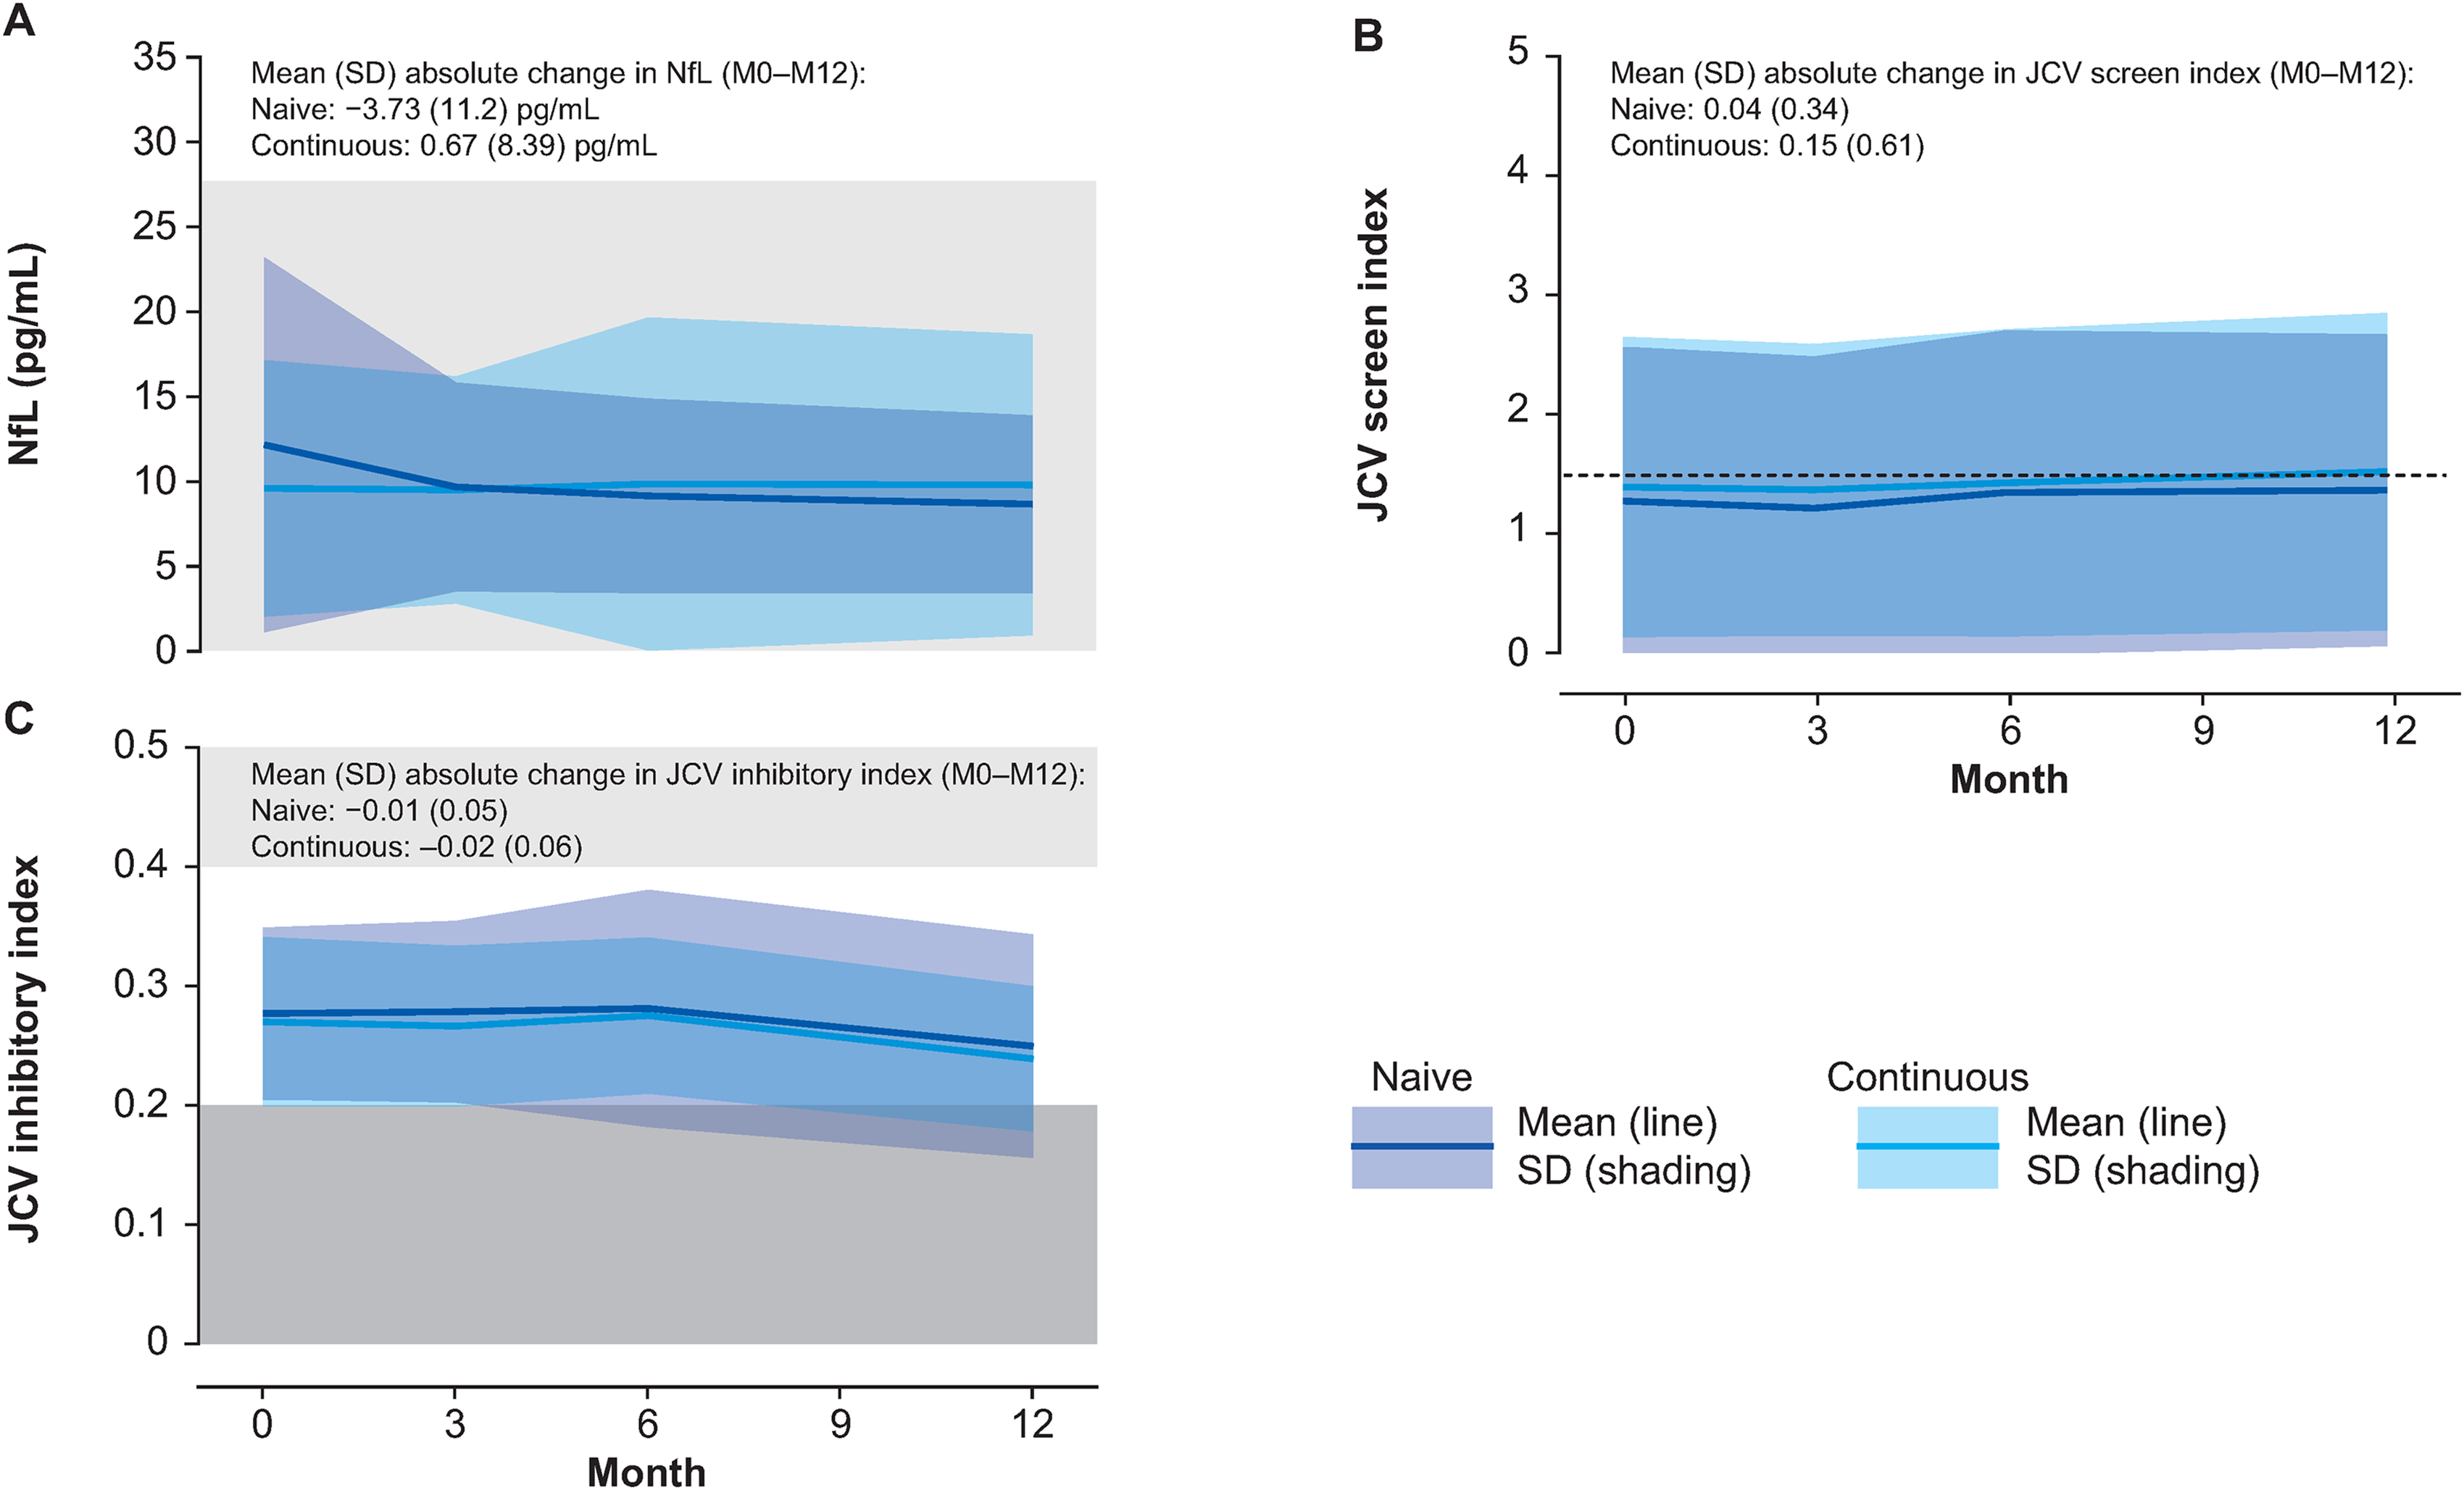
Clinical markers of disease: NfL and anti-JCV indices (safety set). (A) Mean NfL levels, indicative of MS disease severity, with gray-shaded box denoting normal range. 23 (B) Mean anti-JCV screen index, with dashed line indicating the upper limit for a medium risk of future PML. 12 (C) Mean anti-JCV inhibitory index, with a light gray box indicating the intermediate range for JCV positivity, and a dark gray box indicating JCV negativity. 12 Values were determined at baseline and at months 3, 6, and 12. Lines (mean values) and colored shading (SD: naive, mauve; continuous, pale blue; overlap, drab blue) show data trends over time.
In the fingolimod-naive and continuously fingolimod-treated groups, anti-JCV antibody index scores (SD) were 1.27 (1.29) and 1.39 (1.26), respectively, at baseline, remaining relatively stable thereafter for both groups (Figure 7). The proportion of JCV-seropositive participants increased slightly in both groups, though remained slightly lower in the fingolimod-naive group compared with the continuously treated group (baseline, 57.2% vs. 65.1%; month 12, 60.8% vs. 67.4%). In the subset of participants who underwent inhibitory antibody testing, all participants in both groups were within the 0.2–0.4 anti-JCV inhibitory index range 16 at baseline, followed by a small reduction in the mean inhibitory index score between months 6 and 12 in both cohorts (within 1 SD). No consistent correlations were observed between anti-JCV antibody index and any cellular subset at any time point. Full details of correlation analyses are in the Supplementary Results.
Effect of fingolimod on clinical parameters
At baseline, mean (SD) PDDS score in the overall population was 1.8 (1.88), with similar values in both cohorts. There were small numerical decreases from baseline in mean PDDS score at months 3, 6, and 12, both overall and in each cohort. The largest mean (SD) decrease from baseline was in the overall population at month 6 (−0.2 [0.88]); at month 12, the overall change was −0.0 (0.81). In both cohorts, only weak correlations were observed between changes in cellular subsets and PDDS score (−0.3 ≤ R ≤ 0.3).
Safety outcomes
There were no new or unexpected safety signals in FLUENT. No opportunistic infections, including PML or cryptococcal meningitis, were reported. See Supplementary Results and Table e-3.
Discussion
The FLUENT results are consistent with other investigations into the effects of fingolimod on lymphocyte subsets.3,17–20 A study of 36 participants with MS demonstrated significant reductions in percentages of peripheral CD4+ T cells and B cells after three months of fingolimod therapy compared with baseline. 17 As in FLUENT, this study found that fingolimod reduced the percentage of memory B cells and increased the percentage of regulatory B-cell subsets within the total B-cell population. However, an increase in the percentage of naive B cells was reported, 17 whereas in FLUENT the percentage of naive B cells appeared relatively unchanged. This difference could be attributable to B-cell count variability or the low proportion of regulatory B cells at baseline relative to other B-cell subsets in FLUENT. Given the therapeutic focus on targeting B cells in MS, sequestration of naive and memory B cells, but not of regulatory B cells, by fingolimod may contribute mechanistically to its efficacy, similar to the effect on regulatory B cells demonstrated with the S1P receptor modulator siponimod in patients with secondary progressive MS. 21 Furthermore, in FLUENT, small reductions in neutrophil and NK cell counts were observed but remained within the limits of normal and were stable over time. As such, these reductions would not be expected to be associated with an increased risk of infection, so their clinical importance, if any, is unclear.
Other, smaller studies have explored changes in immunological profiles with treatment, and the relationship to clinical outcomes in MS.19,22,23 From a population of 135 participants with RMS receiving fingolimod in a 2-year prospective study, possible associations between immune cell subsets before fingolimod initiation and the presence or absence of new disease activity on the study were investigated in a subgroup of 36 participants. 22 Before treatment, increased frequencies of CD4+ central memory T cells and reduced frequencies of terminally differentiated effector memory CD4+ and CD8+ T cells were seen in participants with new disease activity in the study versus those with stable disease. 22 An association between CD4+ central memory T-cell levels and outcome on fingolimod treatment was also seen in a study of 23 participants with RMS; 15 participants who did not relapse at three and six months had significantly lower percentages of this subset than the eight participants who relapsed. 23 In another study, participants with stable disease had significantly higher percentages of peripheral regulatory B cells than participants with active disease, despite having similar levels of the subset at baseline. 19 Such associations were not investigated in FLUENT because standardized data on clinical relapses or radiographic disease activity were not assessed.
Involvement of the innate immune system is suggested by the study data. A report by Akaishi and colleagues in 2021 of white blood cell profiles in patients with MS compared with healthy controls, found that patients with MS had elevated counts of neutrophils, basophils, and monocytes at diagnosis. 24 There is little evidence for possible roles of basophils and eosinophils in MS, but neutrophils may play a role: an elevated neutrophil–lymphocyte ratio is gaining traction as a simple marker of inflammation in patients with MS.25,26 There was at least one other report of fingolimod reducing circulating neutrophil counts in patients with MS 27 and evidence for an S1P receptor-independent mechanism for fingolimod-mediated neutrophil apoptosis was described. 28 A study in mice showed that fingolimod reduced the number of circulating eosinophils. 29 Potential roles of neutrophils in MS pathogenesis come from animal disease models and from analysis of patient samples. 30 However, it is challenging to determine whether the small changes in neutrophil counts seen in the fingolimod-naive group (and by inference the slightly reduced level at which the cell counts are maintained during long-term treatment) contribute to a therapeutic effect.
Results presented here could be affected by MS disease duration although it is not possible to elucidate the impact of this factor. However, innate cells may predominantly be drivers of disability as patients progress toward secondary progressive MS. 31 With age and disease duration the inflammatory component lessens 32 but innate cells (those not requiring antigenic stimulation) may continue to drive damage and disability accrual. 31 Prior disease-modifying therapy (DMT) usage may also influence immune cell dynamics and homeostasis.
Compensation mechanisms maintain immunity following DMT that depletes certain immune cells. With fingolimod treatment, while the frequency of TNFα-expressing monocytes was significantly reduced, IL-6 expression was unchanged, and dendritic cell expression of CD86 was increased. 22 The remaining circulating lymphocyte subsets potentially compensate following fingolimod therapy, altering the subset composition of T and B cells, particularly of circulating follicular T helper cells.18,33 Increased proinflammatory and regulatory cytokine production following DMT a compensatory mechanism also reported. 34
Findings in the naive cohort suggested that fingolimod treatment can reduce NfL levels within six months, although FLUENT did not include a parallel, untreated reference arm. The initial reduction in NfL parallels reductions in immune cells and may be indicative of a treatment effect. The higher mean baseline NfL concentration observed in fingolimod-naive than in continuously fingolimod-treated participants likely reflects greater disease activity at baseline in the former group. The effect of DMTs on NfL levels, and the utility of NfL as a biomarker in MS were the focus of considerable activity since this study was performed. A large (n = 1139) analysis found notable reductions in NfL levels after initiation of many recently approved MS therapies (follow-up period 4–24 months) 35 including fingolimod, a scenario similar to our study in that prior therapies among patients in our fingolimod-naive cohort were mostly, but not exclusively, interferons or glatiramer acetate. The prognostic value of NfL levels, after adjustment for normal age-related changes, was profiled. Changes in NfL levels (based on Z score) occurred on treatment, a reduction with fingolimod was comparable to those with other oral MS DMTs. 36 Finally, a post hoc analysis of two randomized controlled trials demonstrated that plasma NfL levels were reduced by DMT, including fingolimod, in progressive MS. 37 However, more evidence and consensus are needed on the implementation of NfL monitoring in MS and to understand its impact on prognosis.
No demonstrable change from baseline in anti-JCV antibody index score was observed in either cohort, although the proportion of JCV-seropositive participants increased slightly in both groups by month 12. 16 At up to 14 years of follow-up in the LONGTERMS study, there were no cases of PML or confirmed cases of cryptococcal meningitis, 38 which aligns with findings from this study, where patients had up to 12 years of exposure to fingolimod. While there was a slight increase in the proportion of JCV-seropositive participants in this study, recent literature suggests that JCV index values change over time with fingolimod treatment; however, the data are not consistent.39,40 An increase in JCV index scores was observed with fingolimod treatment; 40 in contrast, a separate meta-analysis saw a significant decrease in JCV index with fingolimod. 39 Analysis of MS-related PML patients indicated that lower JCV viral load at the time of PML diagnosis was associated with better outcomes. 41 It was suggested that opportunistic infections may correlate with the degree of lymphocytopenia on fingolimod but no causal relationship between fingolimod's mechanism of action and opportunistic infection was found. Of note, there was no relationship found between absolute lymphocyte counts and JCV index values in a meta-analysis of patients receiving DMTs, including fingolimod. 39 Associations between immune profiles, serum biomarkers, and occurrence of opportunistic infections could not be inferred.
The study has some limitations. A parallel, untreated arm was not included because of the phase IV study design; only participants previously treated with fingolimod were used as a reference cohort. Fingolimod initiation dates were unavailable for 40% of the continuously treated cohort, which included patients treated with fingolimod for >2 years. Patients in FLUENT attended participating study sites at enrollment but may have initiated fingolimod treatment elsewhere; exact treatment initiation dates were not available in many of these cases. As a consequence, the lack of an upper limit of exposure in the continuously treated group led to increased variation in exposure in this group compared with the treatment-naive group. All changes in immune profiles were made with respect to a group of participants already treated with fingolimod or to baseline samples collected at a single time point from fingolimod-naive participants. Standardized relapse and MRI data were not collected so correlations between immune cell subsets and these clinical outcomes could not be made. There was a small, clinically insignificant improvement in PDDS score in both cohorts over 12 months of treatment; however, the short study duration limits interpretation. Moreover, immune system function was not assessed. Changes in lymphocyte subsets did not correlate with immune responses to new antigens, so the clinical significance of the reported findings was not estimable. FLUENT recruited a predominantly White population from the United States, so findings may differ in other populations with MS.
In conclusion, FLUENT is the largest study of its kind to date and has closed a gap in previous studies that lacked longitudinal, comprehensive immunological profiling of both adaptive and innate immune cells, NfL, and anti-JCV antibody testing data. The study achieved the primary objective and demonstrated that within six months, fingolimod lowers lymphocyte subsets in a fingolimod-naive population to levels seen in participants treated with fingolimod for between 2 and 12 years. The greatest reductions in lymphocyte numbers in fingolimod-naive participants occurred in naive and central memory CD4+ and CD8+ T cells, and in naive and memory B cells. In summary, FLUENT demonstrated the rapid treatment effect when initiating fingolimod, and that long-term effects were stable with little evidence of increased risks to patient safety.
Supplemental Material
sj-docx-1-mso-10.1177_20552173221115023 - Supplemental material for Immune cell subset profiling in multiple sclerosis after fingolimod initiation and continued treatment: The FLUENT study
Supplemental material, sj-docx-1-mso-10.1177_20552173221115023 for Immune cell subset profiling in multiple sclerosis after fingolimod initiation and continued treatment: The FLUENT study by Yang Mao-Draayer, Jeffrey A Cohen, Amit Bar-Or, May H Han, Barry Singer, Ian M Williams, Xiangyi Meng, Chelsea Elam, Jamie L Weiss, Gina Mavrikis Cox, Marina Ziehn, Bruce AC Cree and in Multiple Sclerosis Journal – Experimental, Translational and Clinical
Footnotes
Acknowledgments
The authors would like to thank the participants of FLUENT. Medical writing support was provided by Oxford PharmaGenesis, Oxford, United Kingdom, sponsored by Novartis Pharmaceuticals Corporation, East Hanover, New Jersey, USA. Sarah Griffiths, PhD from Oxford PharmaGenesis provided copywriting assistance. Jenny Thorp, PhD, from Oxford PharmaGenesis styled the manuscript according to journal requirements.
Declaration of conflicting interests
The author(s) declared the following potential conflicts of interest with respect to the research, authorship, and/or publication of this article: Y.M-D. has received consulting and/or speaker fees from Acorda, Bayer Pharmaceutical, Biogen, Bristol Myers Squibb (Celgene), Chugai, EMD Serono, Genentech, Janssen, Novartis, Sanofi Genzyme and Teva, and research support from Chugai, Genentech, NIAID Autoimmune Center of Excellence, NIH NINDS, Novartis, PCORI, and Sanofi Genzyme. J.A.C. has received personal compensation for consulting for Biogen, Bristol-Myers Squibb, Convelo, Genentech, Janssen, NervGen, Novartis, and PSI; speaking for H3 Communications; and serving as an Editor of Multiple Sclerosis Journal. A.B-O. has participated as a speaker in meetings sponsored by, and received consulting fees and/or grant support from, Actelion, Atara Biotherapeutics, Biogen Idec, Celgene/Receptos, Genentech/Roche, MAPI, MedImmune, Merck Group/EMD Serono, Novartis, and Sanofi Genzyme. M.H.H. has served on advisory boards for Arena Pharma, Genentech (Roche), and Novartis. B.S. has received research grant support from AbbVie, Alkermes, Bayer, Biogen, MedImmune, Novartis, Roche, and Sanofi Genzyme; and consulting and/or speaking fees from AbbVie, Alexion, Bayer, Biogen, Bristol Myers Squibb (Celgene), EMD Serono, Genentech, Greenwich Biosciences, Novartis, Roche, Sanofi Genzyme, Teva, and TG Therapeutics. I.M.W. is an employee of Oxford PharmaGenesis Ltd. X.M., C.E., J.L.W., and M.Z. are employees of Novartis Pharmaceuticals Corporation. B.A.C.C. has received personal compensation for consulting from Alexion, Atara, Autobahn, EMD Serono, Novartis, Sanofi, TG Therapeutics, and Therini; and received research support from Genentech. The data availability policy is described here: ![]() .
.
Funding
The author(s) disclosed receipt of the following financial support for the research, authorship, and/or publication of this article: The FLUENT study is funded by Novartis Pharmaceuticals Corporation, East Hanover, New Jersey, USA. Editorial and medical writing support for the manuscript and the journal's article processing charges were funded by Novartis Pharmaceuticals Corporation.
Supplemental material
Supplemental information for this article is available online.
References
Supplementary Material
Please find the following supplemental material available below.
For Open Access articles published under a Creative Commons License, all supplemental material carries the same license as the article it is associated with.
For non-Open Access articles published, all supplemental material carries a non-exclusive license, and permission requests for re-use of supplemental material or any part of supplemental material shall be sent directly to the copyright owner as specified in the copyright notice associated with the article.