
Abstract
Background
Patients with Multiple Sclerosis (PwMS) display altered lipoproteins levels and function, which seem to affect disease risk and progress. Whether disease-modifying therapies affect the lipoprotein profile in PwMS has scarcely been studied.
Objective
The study aims to assess whether fingolimod and dimethyl fumarate (DMF) affect lipoproteins in PwMS.
Methods
We compared retrospectively the blood lipoprotein levels of 29 fingolimod-treated and 41 DMF-treated patients before and after 3 and 12 months of therapy. Patients treated with cholesterol-reducing medications were not included. Data on weight change and disease activity during 1-year follow-up were obtained.
Results
HDL level, HDL/LDL ratio and HDL/total cholesterol ratio were increased in both treatment groups after 3 months’ therapy and sustained, with no change in LDL or triglycerides. While at baseline only 26% of patients met the recommended minimum of HDL 60 mg/dl, after 3 months’ therapy, 43% of fingolimod-treated and 47% of DMF-treated patients reached the recommended level. The majority of patients had no weight reduction.
Conclusions
Fingolimod and DMF therapies are associated with a specific increase in HDL in PwMS. Further studies are required to validate these findings and their potential implication as biomarker of reduced inflammatory state and/or reduced risk of neurodegeneration or cardiovascular comorbidity.
Introduction
Dyslipidemia, which is a well-recognized player in atherosclerosis and in the vascular inflammation underlying cardiovascular diseases (CVDs), has been suggested in recent years to play a role also in Multiple Sclerosis (MS). Childhood obesity and elevated body mass index (BMI) are associated with increased risk for MS.1,2 Patients with MS (PwMS) have higher incidence of hypercholesterolemia and altered lipoprotein levels and function.2–5 Furthermore, PwMS were shown to have greater risk of cardiovascular mortality, 6 which may also reflect less physical activity due to disability, as well as the usage of corticosteroids, the standard treatment for relapses, which are known to induce hyperlipidemia. 7 Vascular comorbidities such as hyperlipidemia were found to adversely influence disability progression and MS outcomes,2,8 and recent findings suggest that defective cholesterol clearance limits remyelination in the brain. 9 Thus, PwMS may have enhanced risk of dyslipidemia and cardiovascular morbidity, and dyslipidemia may be associated with both MS risk and disability progression.
Whether disease-modifying therapies (DMTs) affect the lipoprotein profile in PwMS has scarcely been studied. We report herein the effect of the two immunomodulatory therapies, fingolimod and dimethyl fumarate (DMF), on circulating lipoproteins in PwMS. Increased total cholesterol (TC) and triglycerides (TG), but also nausea and weight loss, are possible adverse effects of fingolimod. 10 DMF therapy is associated with gastrointestinal adverse events in >80% of the patients, 11 which could potentially affect the patient's weight and consequently their lipid profile. Thus, both drugs may potentially affect the lipid profile.
Methods
Study participants
In total, 70 patients with relapsing–remitting MS (RRMS) (>18 years) fulfilling the revised McDonald criteria, treated with fingolimod (n = 29) or DMF (n = 41), followed at Carmel Medical Center, Israel, were included in this study. The study was approved by the Institutional Ethical Review Board of Carmel Medical Center (0036-13-CMC; 0034-13-CMC), and all patients provided written informed consent. The fasting lipid profile was obtained from patient files before and after 3 and 12 months of therapy retrospectively. None of the patients were taking cholesterol-reducing medication before or during the follow-up period. Information on weight change (±2 kg or more) within 1 year (y) of drug initiation was obtained from patient files or from retrospective qualitative questionnaires. Data on relapses, Expanded Disability Status Scale (EDSS), magnetic resonance imaging (MRI) and absolute lymphocyte count (ALC) from a 1-year follow-up was collected.
Statistical analysis
Statistical analysis was performed using SPSSv.23 and GraphPad Prism 5. Each treatment group was assessed independently. Lipid data after 3 months and 12 months of therapy were compared with baseline by repeated measurement ANOVA, followed by paired t-test or Wilcoxon signed-rank test, according to the normality of data, corrected for multiple, repeated testing by Bonferroni correction. A p-value < 0.05 was considered significant.
Results
Table 1 summarizes the demographic and clinical data of 29 fingolimod-treated patients and 41 DMF-treated patients included in this study. Full data are presented in Supplemental Table 1. All but one received fingolimod as a second-line therapy, whereas in DMF patients about half received DMF as a first-line therapy. IFNβ was the most frequent prior DMT, and median time since prior therapy termination was 1.5 months (DMF) and 3 months (fingolimod) (Table 1). EDSS was relatively stable in both patient groups after 1 year, with a slight increase of 19% in fingolimod patients (p = 0.04), not likely of clinical significance. Six patients had a relapse during the 1-year follow-up from drug initiation. At baseline, high-density lipoprotein (HDL) was below the minimum borderline of 50 mg/dl in 38% of the female patients, and below the minimum borderline of 40 mg/dl in 29% of the male patients, and only 26% of all patients had HDL ≥ 60 mg/dl, the recommended level (28% female and 18% male patients) (Table 1, Supplemental Table 1). 12 Baseline low-density lipoprotein (LDL) was above the upper recommended borderline 100 mg/dl in 51.5% of patients, TC was above the upper recommended borderline 200 mg/dl in 22% of patients, and TG was above the upper recommended borderline 150 mg/dl in 12% of patients (Table 1). 12
Summary of demographic and clinical data (baseline).

DMT: disease-modifying therapy; F: female; M: male; Y: year; m: month; EDSS: Expanded Disability Status Scale; DMF: dimethyl fumarate; FTY: fingolimod; GA: glatiramer Acetate; IFNβ: interferon-beta; NZ: natalizumab; LDL: low-density lipoprotein; TC: total cholesterol; TG: Triglycerides; HDL: high-density lipoprotein; Unt: untreated.
Data presented as mean ± SEM, median disease duration and time since prior DMT presented in parentheses. % patients with levels of LDL, TC or TG above recommended upper borderline, and % patient with levels of HDL above the recommended minimum level is presented.
Summary of lipid profile.
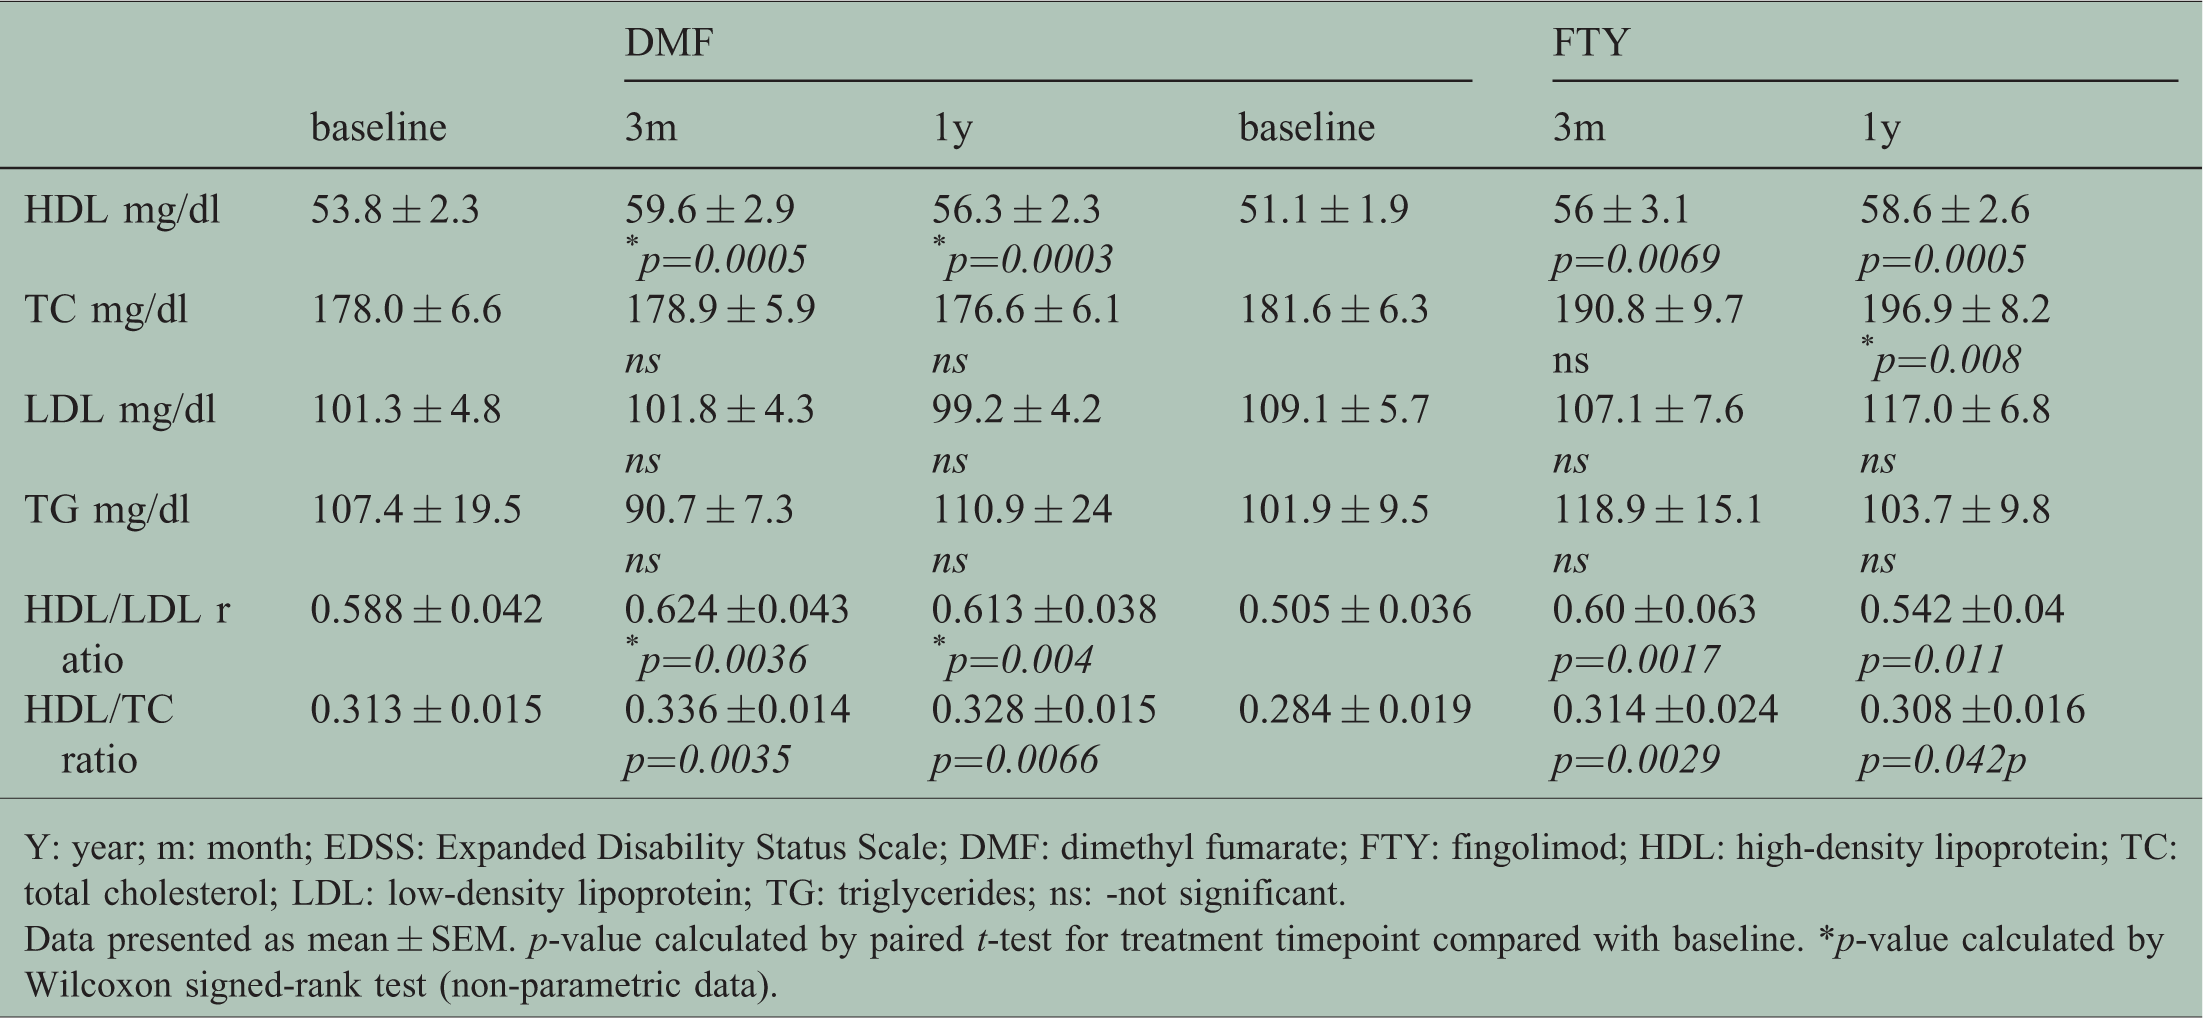
Y: year; m: month; EDSS: Expanded Disability Status Scale; DMF: dimethyl fumarate; FTY: fingolimod; HDL: high-density lipoprotein; TC: total cholesterol; LDL: low-density lipoprotein; TG: triglycerides; ns: -not significant.
Data presented as mean ± SEM. p-value calculated by paired t-test for treatment timepoint compared with baseline. *p-value calculated by Wilcoxon signed-rank test (non-parametric data).
Fingolimod and DMF therapies are associated with increased HDL levels
The lipid profile of patients post-treatment compared with pre-treatment was assessed separately for each treatment group. Fingolimod therapy was associated with a significant increase in HDL (ANOVA = 0.0004), with a 10% increase after 3 months (p = 0.014), and a 15% increase after 1 year (p = 0.0009) (Table 2), (Figure 1(a)I).The percentage of patients who reached the recommended level of HDL ≥60 mg/dl was doubled to 43% after 3 months of fingolimod therapy (Supplementary Table 1). No effect was found at any time point on LDL or TG (Table 2), (Figure 1(a)II,IV). However, an 8.4% increase was seen in TC after 1 year (p = 0.016, ANOVA = 0.005) (Table 2), (Figure 1(a)III), likely reflecting the increase in HDL. Fingolimod therapy was also associated with an increased HDL/LDL ratio (ANOVA p = 0.0035), with an 18.8% increase after 3 months (p = 0.003) and a 7.3% increase after 1 year (p = 0.022). In addition, the HDL/TC ratio was increased in treated patients (ANOVA p = 0.012), with a 10.6% increase after 3 months (p = 0.006), and an 8.5% increase after 1 year (p = 0.08, trend) (Table 2), (Figure 1(a)V,VI).

Lipoprotein profile of PwMS. The lipoprotein profile of 29 fingolimod-treated patients (a) and 41 DMF-treated patients (b) after 3 and 12 months of therapy was compared with pre-treatment. I–HDL, II–LDL, III–Total cholesterol (TC), IV–Triglycerides (TG). V–ratio HDL/LDL from baseline to 1 year. VII–ratio HDL/TC from baseline to 1 year. Presented is Bonferonni corrected p-values. FTY: fingolimod; DMF: dimethyl fumarate; m: months. Broken line presents recommended minimum level (I), or recommended maximum level (II–IV).
Similarly, a significant increase in HDL was found in DMF-treated patients (ANOVA p = 0.00009), with an 11% increase after 3 months (p = 0.001), sustained after 1 year (5%, p = 0.0006) (Table 2), (Figure 1(b)I). Some 47% of patients reached the recommended level of HDL ≥60 mg/dl after 3 months of DMF therapy (Supplementary Table 1). No change was found on TC, LDL or TG (Table 2), (Figure 1(b)II–IV). The HDL/LDL ratio was significantly increased after treatment (ANOVA p = 0.0002), with a 6.1% increase after 3 months (p = 0.007) and a 4.3% increase after 1 year (p = 0.008) (Table 2), (Figure 1(b)V). In addition, the HDL/TC ratio was increased after treatment (ANOVA p = 0.0001), by 7.4% after 3 months (p = 0.007) and by 4.8% after 1 year (p = 0.013) (Table 2), (Figure 1(b)VI).
Two sub-analyses, excluding from the DMF cohort four patients who had received prior fingolimod therapy, or three patients from the fingolimod cohort who had received prior DMF therapy, revealed similar results and a consistent significant increase in HDL (data not shown). We also performed a sub-analysis including only patients with prior interferon-beta therapy, and both in the DMF cohort and in the fingolimod cohort, the elevation in HDL remained robust and significant (data not shown). Finally, we performed a sub-analysis of only patients receiving DMF as a first-line therapy, and again, HDL remained significantly elevated (data not shown). Thus, with these sub-analyses confirming the results from the full cohorts, it can be concluded that the elevation in HDL is not attributed to a carry-over effect from prior therapy.
Patients were defined as having an active disease if experiencing any evidence of disease activity, namely a relapse, within the 1-year follow-up period, and/or EDSS elevation of >1 sustained for 3 months, and/or presence of disease activity/worsening on MRI > 1 year after treatment initiation (e.g. occurrence of contrast‐enhancing lesions in T1‐weighted or new/enlarging hyperintense lesions on T2‐weighted MRI), compared with pre-treatment. In the cohorts of this study, there was no significant difference in pre-treatment HDL (Figure 2(a)I) or in delta change in HDL after 3 months (Figure 2(a)II) between patients with an active versus stable disease in either patient group. There was also no correlation between delta HDL and reduction in ALC, commonly seen in fingolimod and DMF-treated patients (data not shown).

(a) HDL in patients with active versus stable disease. HDL level at baseline (I) or ratio HDL 3 months/baseline (II) in fingolimod- or DMF-treated patients with active disease versus stable disease. Broken line presents recommended minimum level (I), or no difference after 3 months compared with baseline (II). (b) Majority of patients do not experience weight loss after drug initiation. The weight change (increase, loss, no change or unknown) in patients during 1 year from drug initiation assessed retrospectively, presented as percentage of patients.
No weight reduction in the majority of patients
In order to assess whether the increase in HDL was part of a weight reduction process, we collected data retrospectively on weight change within 1 year from drug initiation. Information on weight change was available from 64% of DMF patients and 93% of fingolimod patients. Only 14% of fingolimod-treated patients reported weight loss after drug initiation, while the majority (79.3%) had no change or gained weight. Some 22% of DMF-treated patients reduced weight after drug initiation, while 41.5% either gained weight or had no weight change (Figure 2(b)).
Discussion
The high rate of hyperlipidemia among PwMS3 emphasizes the importance of addressing the impact of the various DMTs on the lipoprotein profile of the patients. The results of our study indicate that treatments with fingolimod and DMF in PwMS are associated with increased levels of circulating HDL, HDL/LDL and HDL/TC ratios in PwMS, with no effects on LDL or TG, findings which to the best of our knowledge have not been reported to date. The increase in HDL cannot be a result of weight loss, since only 22% (DMF) or 14% (fingolimod) of patients reported loss of weight within the 1-year follow-up period. Exact BMI values pre- and post-treatment were not available in this retrospective study. PwMS, and especially newly diagnosed patients, composing 27% of the patients in this study, may be motivated to introduce lifestyle changes, such as a healthier diet, increased physical exercise, etc. However, such lifestyle changes, if sufficient to cause an elevation in HDL, would likely also result in weight reduction, not noted in the majority of patients in this study, as well as be associated with reduction in LDL and TG, 13 both which were unchanged during the 1-year follow-up. Thus, it seems unlikely that lifestyle changes are the direct cause of the specific elevation in HDL detected in the current study. With only 26% of patients meeting the recommended HDL levels of ≥60 mg/dl at baseline, increased to 46% of the patients after 3 months of fingolimod or DMF therapy, the DMT-induced elevation in HDL could be of clinical importance, especially since the size effect of 10–15% HDL increase found in this study is similar to or higher than the HDL increase commonly induced by statin treatment (2–10%). 14 Increased HDL is not only associated with inhibition of progression of atherosclerosis, but also seems to have a protective role against blood–brain barrier injury and inflammatory disease activity, and was reported to correlate with positive outcomes in MS,2,15,16 suggesting that HDL may be a potential biomarker of MS disease state. In contrast, higher levels of LDL, TC and TG have been associated with worsening disability score in MS,2,17,18 and with increased risk of disability progression and activity in patients with clinically isolated syndrome (CIS). 19 In the relatively small cohorts of this study and the 1-year follow-up period, pre-treatment HDL levels did not predict disease activity; however, the predictive value of HDL should be assessed in larger cohorts and longer follow-up periods. In PwMS, higher levels of HDL, but also of LDL, have been associated with greater levels of vitamin D; 20 however, since low vitamin D level, like high LDL level, is associated with higher risk of disease progression, the biological relevance of this finding is puzzling. In our cohorts, there was no correlation between baseline or 1-year HDL or LDL levels and vitamin D (data not shown).
The classical role of HDL is reverse cholesterol transport and removal from peripheral tissue, thereby decreasing the risk of CVD, and apolipoprotein A-I (ApoA-I), a major component of HDL, reduces inflammation in the central nervous system (CNS).5,21 The role of HDL in pathological conditions is complex, depending upon HDL subclasses.2,5 Elevated HDL could reduce accumulation of cholesterol from excess myelin degradation, which was recently shown to trigger cholesterol crystal formation that promotes inflammation and limits CNS remyelination. 22 The above findings indicate the importance of preventing dyslipidemia in CIS and MS patients, and may provide additional explanation for the beneficial effects of these DMTs also in reducing brain atrophy in PwMS. Notably, trials of cholesterol-lowering statin therapy in CIS and RRMS patients have not met expectations, although some beneficial outcome was seen in patients with secondary MS. 23 It seems, however, indisputable that encouraging a healthy lifestyle, including healthy nutrition and regular physical activity, which increases HDL, is beneficial for PwMS.
How other MS DMTs affect the lipid profile has scarcely been studied. IFNβ therapy rapidly, but temporarily, decreases HDL, LDL and TC within 3 months, with HDL returning to baseline level within 18 months, while LDL and TC return to baseline after >4 years. 24 The early reduction in HDL in IFNβ-treated patients correlated with less long-term brain atrophy, and was suggested by authors as a potential biomarker for treatment response. 24 TC and HDL levels are decreased in natalizumab-treated patients, not correlating with clinical outcomes. 25 Thus, elevated HDL in fingolimod and DMF-treated patients seems to be related to the specific modes of action of these drugs, and not only due to improved disease state. Whether the increase in HDL induced by fingolimod or DMF therapy is sustained over years, or returns to baseline over time as occurring in IFNβ-treated patients, remains to be determined. However, in our study there was no statistically significant difference in HDL levels between 3 months and 1 year.
The diverse effects of different DMTs on lipoproteins in PwMS most likely reflect their various modes of action, which mainly target inflammation but may also include prevention of neurodegeneration. In a phase 2 clinical trial of patients with secondary progressive MS, a disease state characterized by mainly neurodegeneration, patients receiving cholesterol-reducing medication (simvastatin) had less brain atrophy than patients receiving placebo, 26 supporting that lowering lipoproteins like LDL and TC may have a protective effect against neurodegeneration in PwMS. Since several reports have found correlations between lipoprotein levels and disability progression and MRI features, but not with relapse risk,2,17,18,27 it is possible that lipoproteins mainly affect the neurodegenerative process in MS, but less the inflammatory part of the disease; however, further research of these aspects is necessary.
The molecular mechanisms underlying the elevation in HDL in fingolimod- and DMF-treated patients is yet to be explored. As fingolimod is an antagonist of sphingosine 1-phospate (S1P), which is carried in the blood by apolipoprotein M/HDL, 28 the increase in HDL could be a positive response to meet the demand of the S1P carrier. Fingolimod reduced in vitro cholesterol toxicity in macrophages, by stimulating production of 27-hydroxycholesterol and promoting cholesterol efflux to ApoA-I. 29
A recent study of 7β-hydroxycholesterol (7β-OHC)-mediated oxidative stress, mitochondrial dysfunction and autophagy, all hallmarks of neurodegenerative diseases, using murine oligodendrocyte cells, showed that DMF and monomethyl fumarate prevented 7β-OHC-induced oxidative stress, cytotoxicity and cholesterol homeostasis disturbance, and restored a normal lipid profile of myelin-associated lipids (cholesterol, phospholipids). 30 These effects were thought to be mediated through activation of the Nrf2 pathway and/or the increase of antioxidant molecules such as glutathione. Nrf2 seems to play an important role also in regulating plasma lipid content, as shown in a model of Nrf2-knockout obese mice, which presented a reduced level of HDL and increased TG. 31 Thus, the DMF-induced elevation of HDL found in PwMS in this study could potentially be mediated through the activation of the Nrf2 pathway.
Notably, lack of data on changes in lifestyle, diet and physical activity could bias results; however, as shown, the absolute majority of the study population had no weight loss, suggesting an independent mechanism.
Conclusions
This pilot study indicates HDL elevation following fingolimod or DMF therapy, a potential beneficial side effect that, if sustained in long-term treatment, could potentially diminish the neurodegenerative process as well as the vascular inflammatory state and atherosclerosis. Whether the DMT-induced increase in HDL is associated with lower risk of cardiovascular comorbidity or may serve as a biomarker for response to therapy remains to be explored.
Supplemental Material
MSO882720 Supplemental Material - Supplemental material for HDL-cholesterol elevation associated with fingolimod and dimethyl fumarate therapies in multiple sclerosis
Supplemental material, MSO882720 Supplemental Material for HDL-cholesterol elevation associated with fingolimod and dimethyl fumarate therapies in multiple sclerosis by S Blumenfeld Kan, E Staun-Ram, D Golan and A Miller in Multiple Sclerosis Journal—Experimental, Translational and Clinical
Footnotes
Acknowledgements
We thank the MS patients for participation in this study, Sara Dishon, RN, M.PA., Carmel Medical Center, Haifa, Israel, for providing patient care and assistance in clinical data management and Eiman Najjar M.Sc, Lea Glass-Marmor PhD and Anat Volkowich M.Sc for assistance in clinical data management and collection.
Conflict of Interests
The author(s) declared the following potential conflicts of interest with respect to the research, authorship, and/or publication of this article: Dr. Blumenfeld Kan, Dr Staun-Ram and Dr. Golan have nothing to disclose. Prof. Miller has served on the scientific advisory board, and received personal compensation for consulting and/or speaking activities and/or honoraria and/or received grant support for research from: Avanir Pharmaceuticals; Bayer-Schering Pharma; Biogen Idec; Mapi Pharma; Medison Pharma Ltd.; Merck Serono; Novartis, Sanofi - Genzyme Israel Ltd and Teva Pharmaceutical Industries Ltd.
Funding
The author(s) received no financial support for the research, authorship, and/or publication of this article.
Supplemental Material
Supplemental material for this article is available online.
References
Supplementary Material
Please find the following supplemental material available below.
For Open Access articles published under a Creative Commons License, all supplemental material carries the same license as the article it is associated with.
For non-Open Access articles published, all supplemental material carries a non-exclusive license, and permission requests for re-use of supplemental material or any part of supplemental material shall be sent directly to the copyright owner as specified in the copyright notice associated with the article.