
Abstract
Background
Timed 25-foot walk (T25FW) test serves as gold standard in care of persons with multiple sclerosis (PwMS) and as walking measure of regulatory trials.
Objective
To validate and determine the clinical utility of Expanded Timed Get-Up and Go (ETGUG) as a disability measure in MS.
Methods
ETGUG intra-rater and inter-rater reproducibility was determined in 65 PwMS that were examined twice in two centres over 1-week. Values below the 5th and above the 95th percentile were considered minimally detectable change. A longitudinal cohort (32.4 months) of 145 PwMS from New York State MS Consortium (NYSMSC) was used for clinical validation as a predictor of disability worsening measured by Expanded Disability Status Scale (EDSS).
Results
ETGUG and T25FW had noteworthy intra-rater and inter-rater reproducibility (Cronbach coefficient>0.949). One-week ETGUG difference ranged from 15.07% to −14.84% (5th and 95th percentile). Over the NYSMSC follow-up, PwMS had significant slowing in walking as measured by ETGUG (20.8 to 25.9s, p = 0.009) but not by T25FW. 15% ETGUG worsening had similar ability to predict EDSS worsening when compared to 20% T25FW worsening (AUC 0.596 vs. 0.552).
Conclusion
Over 32-month follow-up, PwMS experience slowing in ETGUG walking time but not in T25FW. Although the scoring may be more challenging, ETGUG could be more sensitive to change and provide more comprehensive measure of lower extremity performance and ambulation in PwMS.
Background
Multiple sclerosis (MS) is a life-long neuroinflammatory and neurodegenerative disease of the central nervous system (CNS) that results in significant physical and cognitive disability. 1 Early in their disease course, most persons with MS (PwMS) are diagnosed with relapsing-remitting (RR) disease, where they experience acute neurological worsening with complete or partial recovery. 1 Over a period of 20–25 years, most PwMS will transition into a progressive MS (PMS) phase that is characterized by a continuous and slow accumulation of permanent disability. 2 Within the disability spectrum, walking impairment is reported as most prevalent disease symptom. 3 More importantly PwMS value ambulation and gait as one of the most important bodily dimensions.4,5
Two most commonly utilized outcome measures that focus on MS disability, and walking in particular, are Expanded Disability Status Scale (EDSS) and Timed 25-foot walk (T25FWT) test.6,7 Additional measures such as 6-min walk test (6MWT) and patient-reported walking measures (e.g. Multiple Sclerosis Walking Scale-12; MSWS-12) are also used. 3 Whereas lower EDSS scores are calculated as a composite measure of multiple neurological domains, EDSS scores of 4.0 or greater are primarily based on the gait dysfunction and directly linked to the patient’s ambulation. 6 Similarly, T25FW test directly quantifies the time needed for walking 25 feet in a straight line as quickly as possible but safely. 7 T25FW is easy to administer and widely used in routine clinical practice. 7 Both measures have served as either primary or secondary trial outcomes of almost all phase-3 clinical trials.8,9
A limitation of both measures is their relative unidimensionality when it comes to capturing the extent of the walking disabilities and their impact on real-world functioning. Aspects such as turning while walking, getting up from a seated position, or sitting down, are all important activities that can significantly impact the quality of life and would not be captured by T25FW. 10 T25FW test covers only a small walking distance and previous studies suggest that the PwMS do not reach their maximum walking speed. 11 In contrast, a walking test called the Expanded Timed Get-Up and Go (ETGUG), an adaptation of the Timed Up and Go (TUG), has been developed and utilized for the purpose of screening the geriatric population for their walking disability and their risk for falls. 12 TUG test has been previously validated as a measure of functional mobility in MS and demonstrates construct validity with T25FW.10,13 It comprises of several steps including standing-up, walking 3 metres, turning-around and walking back to sit down. While TUG provides a single time outcome for the sequence of events, ETGUG measures separate times for each segment of the test. 12 ETGUG test has not been validated in the MS population thus far, but extensive data in aging healthy population is published.
Based on this background, there is a significant scientific rationale to validate and determine the clinical utility of ETGUG as an appropriate disability measure in the MS population. We hypothesize that ETGUG will have good intra-rater, inter-rater, and short-term test-retest reproducibility. Moreover, we hypothesize that ETGUG will have comparable clinical utility when compared to T25FW. Lastly, we aim at determining ETGUG change cut-off values for determining walking worsening in PwMS.
Methods and materials
Prospective reproducibility cohort
The ETGUG reproducibility was designed as a two-centre study (both sites located in Buffalo, NY) which enrolled PwMS with the following inclusion criteria: 1) 18–65 years old, 2) MS diagnosis based on the 2010 McDonald criteria, 3) being ambulatory or having EDSS between 2.0–6.5 (EDSS score of 6.5 reflects ability to walk 20 metres with bilateral support such as crutches or walker). The exclusion criteria were experiencing an MS relapse within the last 3 months and cognitive disorders that would prevent the patient to provide informed consent.
New York State Multiple Sclerosis Consortium (NYSMSC) cohort
The second longitudinal study cohort consisted of PwMS enrolled in the New York State Multiple Sclerosis Consortium (NYSMSC) following the same inclusion/exclusion criteria. In particular, the NYSMSC database excludes visits that occurred due to acute clinical relapse and/or new MRI activity. Only the patients from the NYSMSC were considered for the longitudinal EDSS worsening analysis shown hereafter.
The PwMS from site 1 of the reproducibility cohort and the NYSMSC cohort were clinically evaluated by a board-certified neurologist and their disability scores were determined using EDSS and functional scores (FS). 6 The EDSS scores from the second site were retrieved from their electronic medical records. Disability progression was determined based on criteria commonly used in all recent phase 3 MS trials and explained in Supplemental Material. 14 All remaining patients were categorized as stable. Based on the disease history and clinical presentation, the treating neurologist classified them as RRMS or PMS. Demographic and clinical information such as age of diagnosis, disease duration, relapses, and use of disease-modifying treatment (DMT) were collected. The study was approved by the Institutional Review Board (IRB) and all study participants signed a written consent form.
Walking measures
The walking ability of the PwMS was determined using ETGUG and T25FW test. Detailed description of both tests is found in Supplemental Material.
The PwMS enrolled in the prospective part of the study underwent evaluation by two separate raters (two raters in each centre, with a total of 4 tests performed during a visit) for ETGUG and T25FW. Each rater performed the tests twice on the same PwMS. The evaluation was additionally repeated after 1-week follow-up.
PwMS from the NYSMSC underwent one-time (1 rater, 1 test per visit) ETGUG and T25FW testing both at baseline and approximately 2 years afterward (follow-up times were based on the routine clinical visits with the treating neurologist). All study visits and follow-up times recorded in the NYSMSC are based on the routine care of the PwMS with no additional study visits being implemented. Clinical visits due to acute neurological/MRI changes such as clinical relapse, administration of corticosteroid therapy or presence of new gadolinium/T2 lesions are excluded from the Consortium. Absolute and percent-based changes in ETGUG and T25FW were analyzed with regard to their disability progression through the aforementioned EDSS criteria.
Statistical analyses
All statistical analyses were performed using SPSS version 26.0 (IBM, Armonk, NY, USA). Data distribution and data normality were assessed using the Kolmogorov-Smirnov test and visual inspection of Q-Q plots and tests selected based on the normality of the data distribution. Outliers were determined as data points falling outside 3.29 standard deviations (SD), representing data outside of the 99.9th percentile. 15 Missing values of some ETGUG segments were added using imputation which was proportionately based on the longitudinal change in other segments. In detail, the change of a missing ETGUG segment from baseline to follow-up was calculated based on the % change seen in the remaining five ETGUG segments. Less than 5% of the data was imputed. Due to the non-parametric (skewed) data distribution of the walking measures, all measures are shown as medians and interquartile ranges (IQR). Data was compared using Mann Whitney U-test (non-parametric numerical data), Student’s t-test for (parametric numerical) and χ2 for categorical data. Analysis of covariance (ANCOVA) with ranked transformed variables was also utilized for adjusted comparison of non-parametric data. Each test utilized for each comparison is shown in the respective legends of the Tables. Associations between parametric variables were assessed using Pearson’s correlations. The reproducibility (intra-rater and inter-rater variability) was assessed using a two-way mixed model for interclass correlation coefficient (ICC) and Cronbach α coefficient. ICC ranges from 0 to 1, where coefficients close to 1 indicate high similarity between the trials. Cronbach α coefficient determines how close all the variables are grouped, and values close to 1 indicate unidimensionality (internal consistency). Bland-Altman plots were used to determine the pooled test-retest reproducibility and limits of agreement (data within the 5–95th percentile). Short-term variability of ETGUG and T25FW were also determined over a week’s period where the 5th and 95th percentile were considered the limits of minimally detectable change (MCD).16,17 Any data points below the 5th and above the 95th percentile should be considered as true changes in the walking tests. 18 Тhese analyses were set to replicate the original T25FW work in establishing its cut-off which is currently used in the clinical studies and MS trials.
Logistic regression determined the ability of ETGUG and T25FW cut-offs in predicting disability progression or improvement. The 20% worsening of T25FW cut-off was previously validated and widely used in the clinical routine and clinical trials. 18 The 20% ETGUG cut-off was derived from the reproducibility analysis shown hereafter. Receiver operating characteristics (ROC) tests were used to compare and determine the sensitivity and specificity of the tests. Additional comparisons of T25FW, ETGUG, and its components were done between the disability groups and between patients based on a baseline EDSS </≥ 3.0 [a cut-off between PwMS with mild disability (<3.0) and PwMS with moderate or greater disability levels (≥3.0)]. Moreover, the median EDSS of the NYSMSC population was 3.0 and such cut-off proportionately separated the disability groups. Two-tailed p-values below 0.05 were considered statistically significant. Correction for false discovery rate (FDR) using Benjamini-Hochberg procedure was additionally performed.
Results
Reproducibility cohort
The characteristics of the reproducibility cohort are shown in Table 1. There were no significant demographic differences between the centres in age and sex. The groups were comparable in their age of MS diagnosis, disease duration, disease subtype and EDSS (the EDSS scores from the second site were available for 18 patients which were retrospectively collected from their clinical chart). The only significant difference between the centres was in the pyramidal FS (median 2.0 vs. 3.0, p = 0.012).
Demographic characteristics of the study population from the ETGUG reproducibility study.

Legend: MS – multiple sclerosis, RRMS – relapsing-remitting multiple sclerosis, PMS – progressive multiple sclerosis, EDSS – Expanded Disability Status Scale, FS – functional scores, SD – standard deviation, n – number, IQR – interquartile range. Based on the distribution of the data, the comparison was performed using: a - parametric Student’s t-test, b - non-parametric Mann-Whitney U test, c – χ2 test.
*EDSS scores were only available for participants at Site 1. Retrospective analysis of EDSS scores for participants at Site 2 was performed and scores for only 18 patients were collected. Six (6) patients were of African-American descent and no information was available for the remaining two (2). The disease type was unknown for one (1) participant. Statistically significant p-values lower than 0.05 are shown in bold.
Intra-rater and inter-rater reproducibility
The pooled ETGUG and T25FW times and their reproducibility are shown in Table 2. ETGUG ranged from 19.5s (visit 1, rater 1, trial 1) to 18.1s (visit 2, rater 1, trial 2). Both intra-rater and inter-rater reproducibility were almost perfect. T25FW ranged from 6.28s (visit 1, rater 2, trial 1) to 6.8s (visit 2, rater 1, trial 1). Comparably to ETGUG, T25FW was highly reproducible with almost perfect intra-rater and inter-rater coefficients >0.949. The pooled average inter-rater ETGUG difference was 0.03s and SD of 0.46s (Bland-Altman plot in Figure 1). The 5th and 95th percentiles for inter-rater ETGUG differences were 0.92 and −0.86s, respectively (limits of agreement for ETGUG).

Bland-Altman plot demonstrating pooled inter-rater agreement for all recorded trials. Legend: ETGUG – Expanded Timed Get-Up and Go. The inter-rater ETGUG difference was on average 0.03 s and had a standard deviation of 0.46 s. The green y-axis represents the average difference, and the red y-axes represent the 5th and 95th percentile (0.92 and −0.86 s, respectively), also known as limits of agreement. One ETGUG measurement pair with a difference of 9.4 s was removed from the analysis.
Intra-rater and inter-rater variability of ETGUG and T25FW in the reproducibility database.
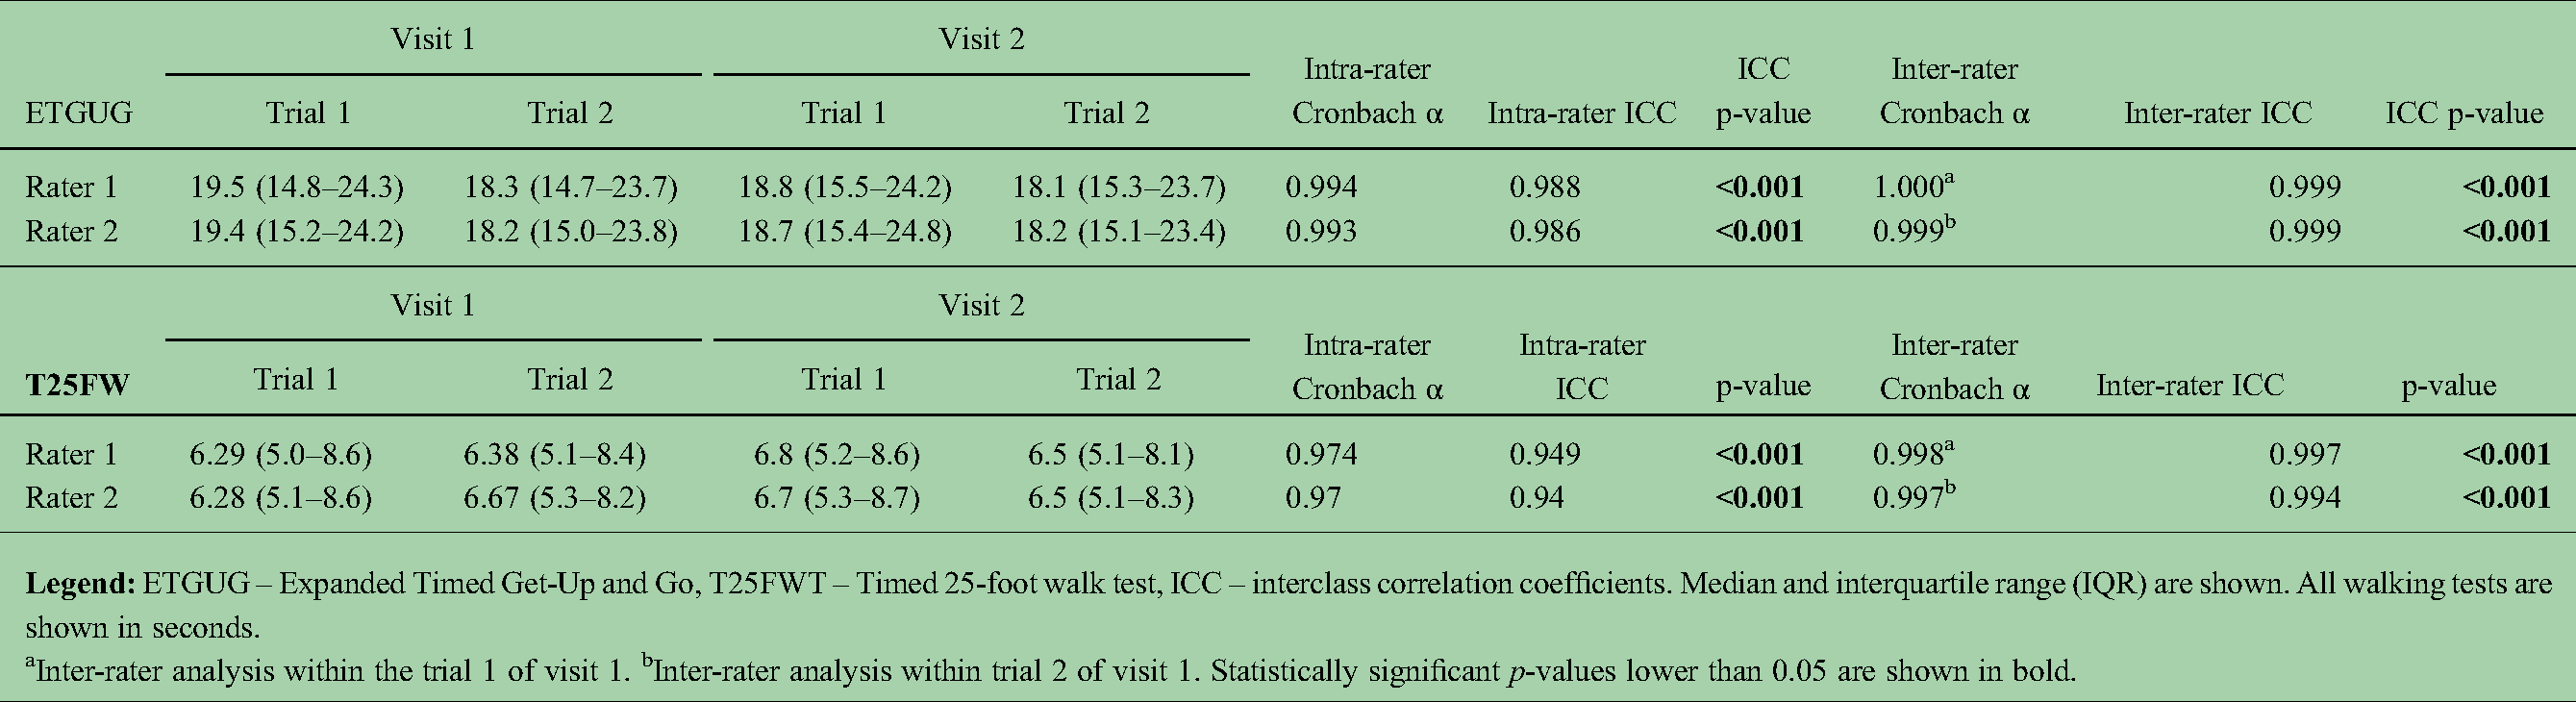
Inter-rater analysis within the trial 1 of visit 1. bInter-rater analysis within trial 2 of visit 1. Statistically significant p-values lower than 0.05 are shown in bold.
The median times, intra-rater and inter-rater reproducibility for all ETGUG components are shown in Supplemental Table 1. All segments had almost perfect intra-rater reproducibility. The inter-rater reproducibility followed suit, with exceptions in Get-Up and Gait Initiation with moderate reproducibility.
Short term reproducibility and minimal detectable change (MCD)
The short-term variability is shown in Table 3. ETGUG did not significantly change between visits (p = 0.512). The Bland-Altman plot in Figure 2 depicts the agreement in ETGUG between visits with an average ETGUG difference of −0.179s and SD of 1.73s. The 5–95th percentile were 3.22s and −3.57s, respectively and depict the limits below the smallest detectable change. When transformed in percentages, the 5–95th percentile ranged from 15.07% to −14.84%. Any change greater than the smallest detectable change should be considered as true clinical change. On the contrary, T25FW had an almost statistically significant change from 6.3s to 6.6s (repeated-measure p = 0.067). The short-term changes in ETGUG and T25FW measured independently in both sites are depicted in Supplemental Table 2. There was a statistically significant difference in the T25FW measured at the first site (change of 5.3%, repeated-measure p-value = 0.021).
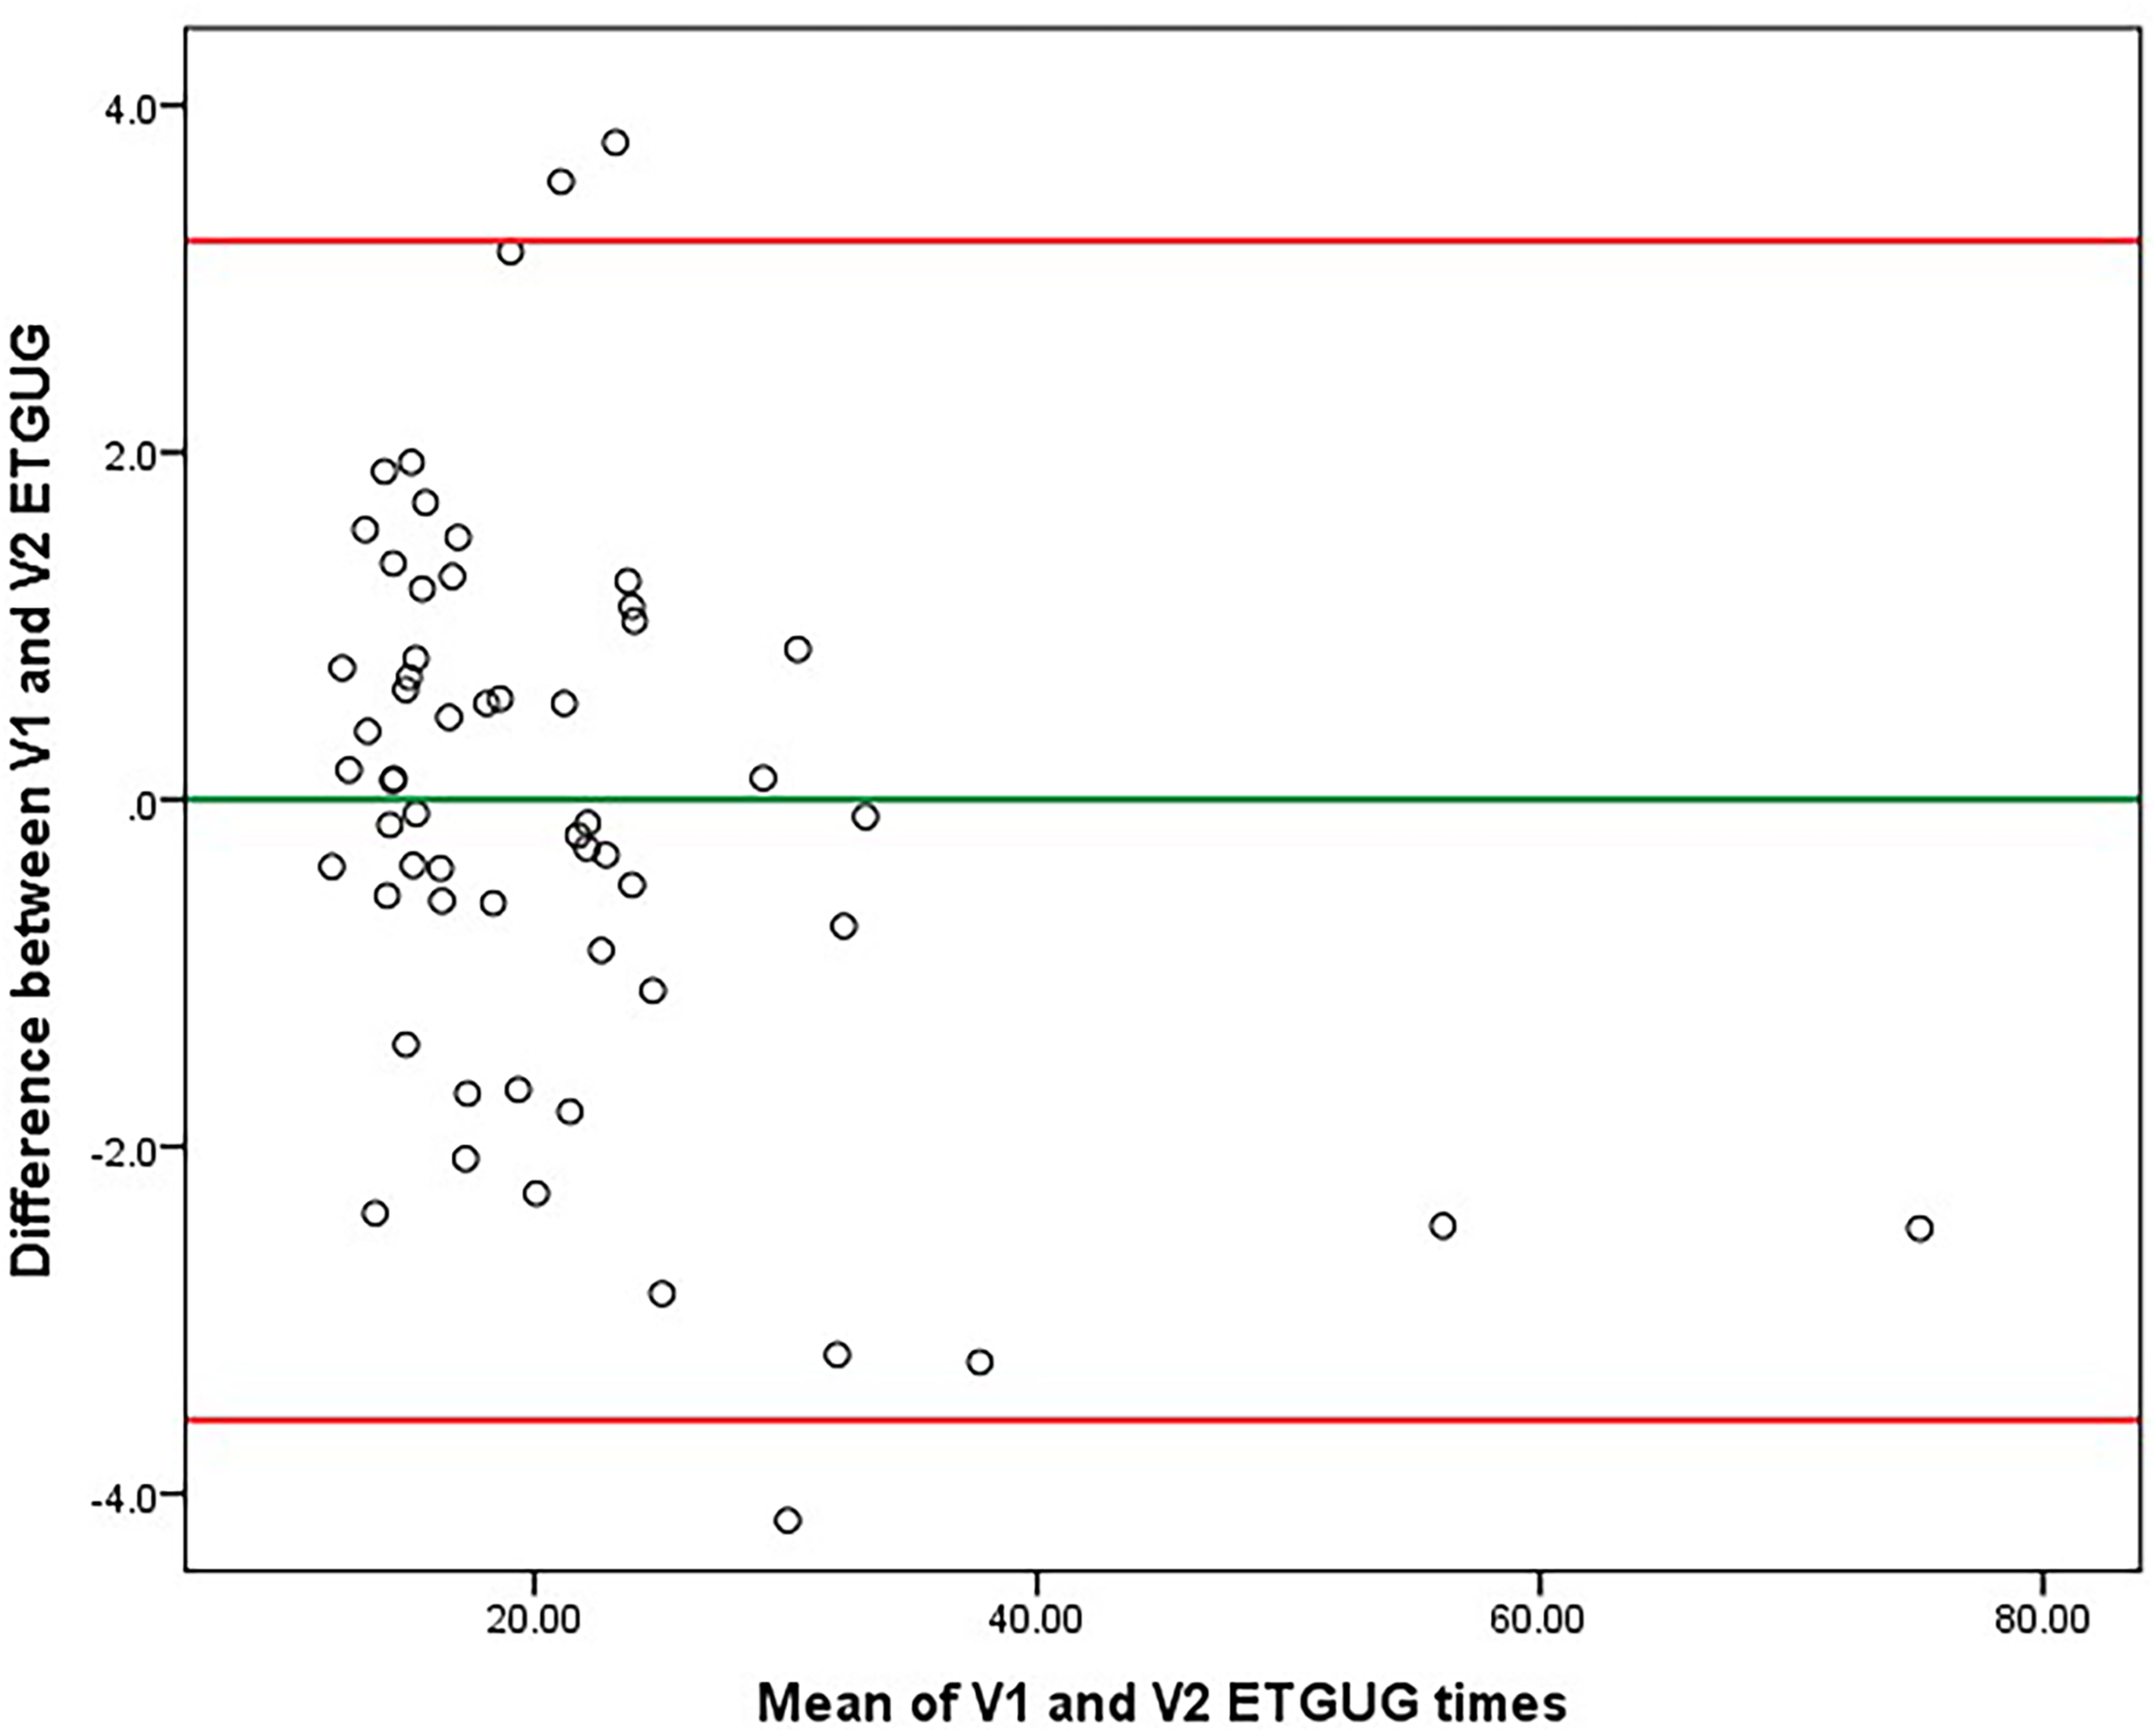
Bland-Altman plot demonstrating longitudinal agreement for ETGUG (walking speed change within a week). Legend: ETGUG – Expanded Timed Get-Up and Go. The longitudinal ETGUG difference was on average −0.1789s and had a standard deviation of 1.73213s. The green y-axis represents the average difference, and the red y-axes represent the 5th and 95th percentile (3.2161s and −3.5739s, respectively), also known as limits below the smallest detectable change (SDC). When transformed into percent changes, the 5th and 95th percentile ranges from 15.07% to −14.84%. Any change greater than the minimally detectable change should be considered as true clinical change. When compared to Table 4, one extreme outlier with ETGUG measurement pair difference of 12.94s was removed from the analysis.
Variability of ETGUG and T25FW over repeated testing (one week) within the reproducibility database.
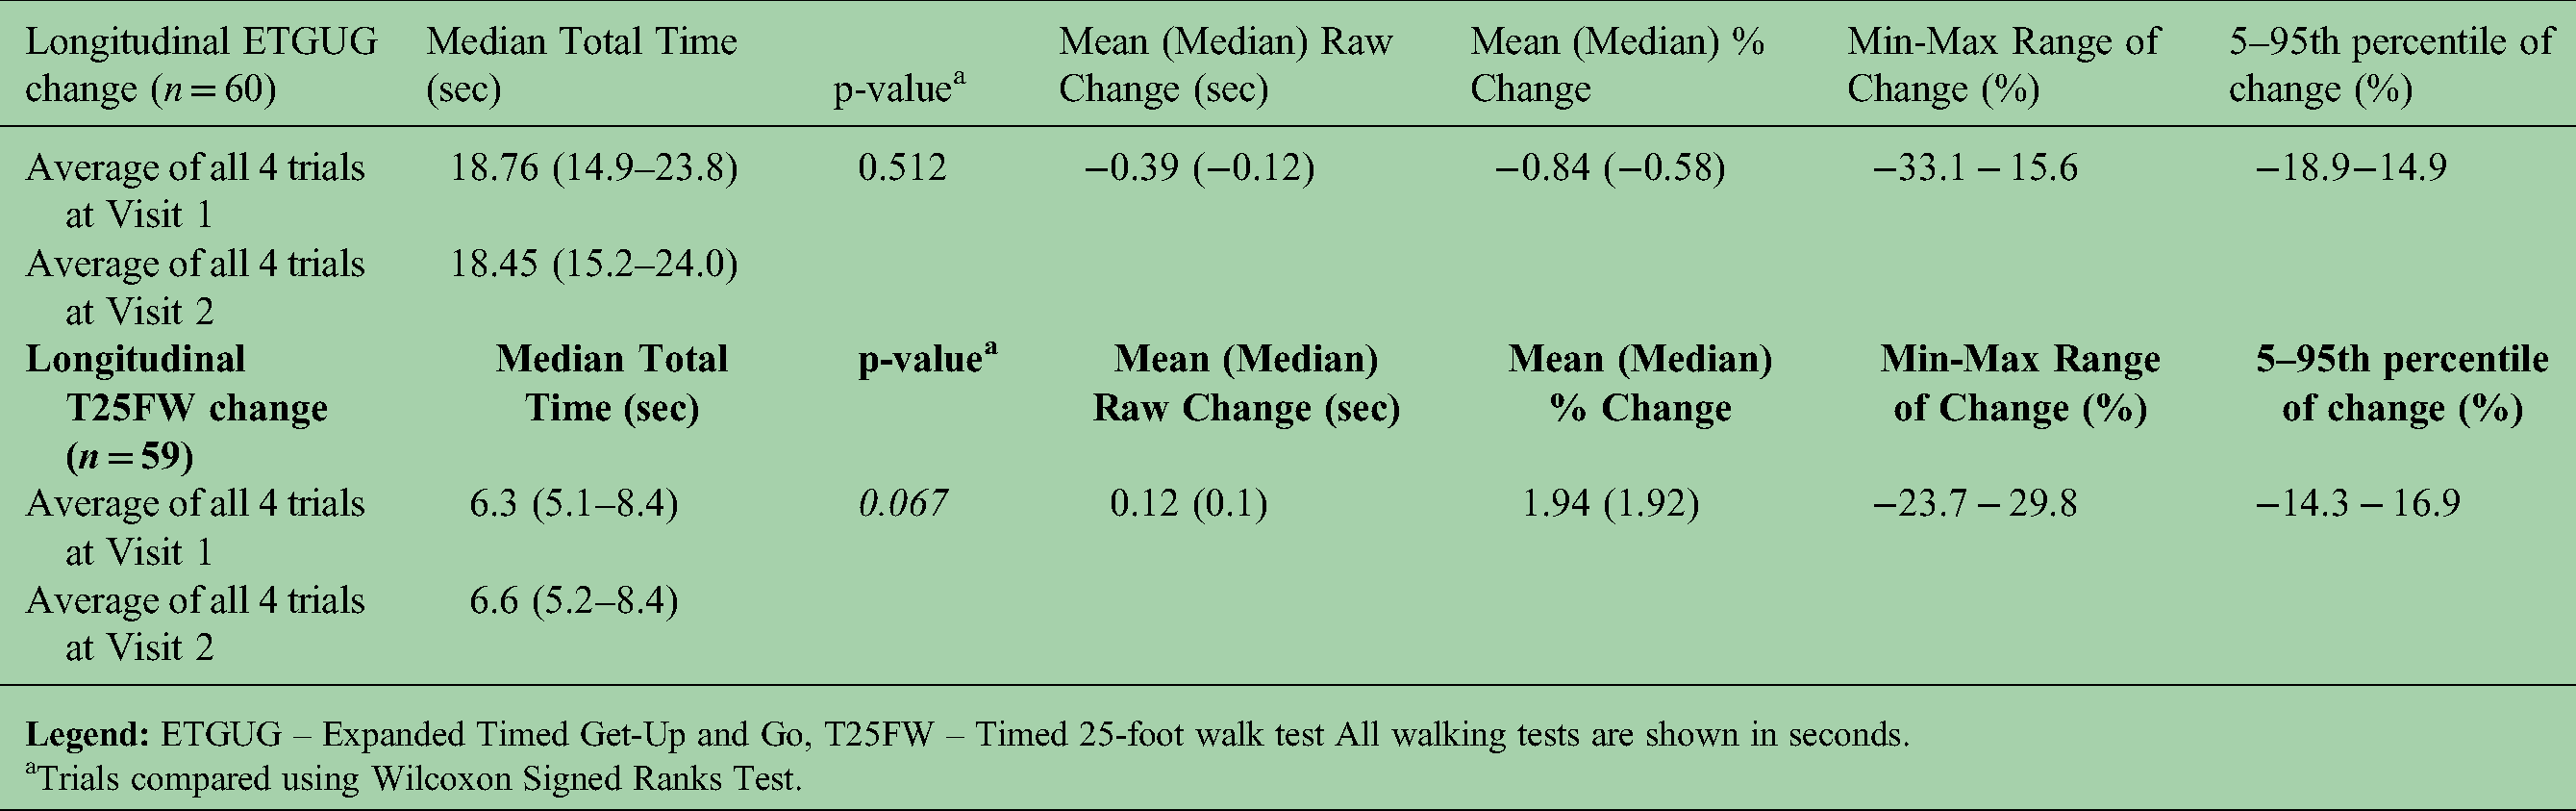
Trials compared using Wilcoxon Signed Ranks Test.
Demographic characteristics of the study population in the NYSMSC database.

Legend: NYSMSC – New York State Multiple Sclerosis Consortium, MS – multiple sclerosis, RRMS – relapsing-remitting multiple sclerosis, PMS – progressive multiple sclerosis, EDSS – Expanded Disability Status Scale, DMT – disease modifying treatment, FS – functional scores, ETGUG – Expanded Timed Up and Go, T25FW – Timed 25-foot walk test, SD – standard deviation, n – number, IQR – interquartile range. All walking measures are shown as median (IQR) and represented in seconds. The follow-up time is shown in months. All comparisons were performed with non-parametric Mann Whitney U test. Statistically significant p-values lower than 0.05 are shown in bold.
Five (5) patients were of African-American descent, six (6) were labelled as “other” and no information was available for the remaining three (3). At baseline, three (3) patients were labelled as clinically isolated syndrome (CIS), and two (2) were labelled as neuromyelitis optica spectrum disorder (NMOSD).
For comparison, data from the literature clocks young healthy controls (average 25.5 years old) at 15.36 (SD of 1.638) seconds and elderly healthy controls (average 72.7 years old) at 19.095 (SD of 2.112). 12
Based on these findings. the 15% mark was determined as ETGUG cut-off for any clinically significant change in PwMS. This cut-off is the equivalent of the 20% cut-off previously recorded and validated for T25FW. 7
NYSMC cohort
The characteristics of the NYSMSC cohort are shown in Table 4. Over the follow-up period, 26 PwMS experienced EDSS worsening, 4 had EDSS improvement, and 115 remained stable. A total of 67.6% remained on the same DMT, 8.3% started DMT, 16.6% stopped their DMT, and 7.6% switched to a different DMT group.
Longitudinal change in walking measures and falls
Over the follow-up time, the PwMS had significant slowing in walking speed measured as total ETGUG (from 20.8s to 22.5s, p = 0.009). PwMS showed improvements in Get-up and Sit-down (p = 0.003 and p < 0.001) but worsening in Walk 1 (p < 0.001), Turn around (p < 0.001) and Walk 2 (p < 0.001). All findings remained significant after FDR correction. There were no significant changes in T25FW. Аt baseline 62 (42.8%) of the PwMS reported having at least one fall in the previous year. Within these patients, 33.9% had 4 + falls, 17.8% had 3 or 2 falls respectively, and 30.6% reported one fall. At follow-up, 56 (38.6%) of PwMS reported having at least one fall in the previous year. Similar distribution of number of falls was seen at the follow-up.
The differences in baseline walking times between PwMS reporting any falls and PwMS without falls are shown in Table 5. The patients that reported falls had significantly greater EDSS scores when compared to patients that did not report falls (median 3.5 vs. 3.0, p < 0.001). Moreover, those who reported falls had significantly longer gait initiation (p = 0.001), Walk 1 (p < 0.001), Walk 2 (p = 0.001), total ETGUG (p < 0.001) and T25FW (p < 0.001). The significances remained the same after age adjustment.
Lower extremity performance measures between PwMS that experience vs. not experience falls.

Legend: MS – multiple sclerosis, ETGUG – Expanded Timed Get-Up and Go, T25FWT – Timed 25-foot walk test, EDSS – Expanded Disability Status Scale. Median and interquartile range (IQR) are shown for all walking measures. All walking tests are from the follow-up visit and are shown in seconds.
All comparisons were performed using non-parametric Mann-Whitney U test For age-adjusted ANCOVA, the walking measures were rank transformed. Statistically significant p-values lower than 0.05 are shown in bold.
* - Not significant after false discovery rate (FDR) correction using Benjamini-Hochberg procedure.
ETGUG predictor of disability worsening as measured by EDSS
The comparative changes in between stable and worsening PwMS are shown in Table 6. PwMS with EDSS worsening had a numerically greater percentage of concurrent 15% ETGUG worsening (10 out of 26). On the contrary, there was a greater discrepancy between EDSS worsening and T25FW worsening (5 out of 26). In the ROC analysis, 15% ETGUG worsening was a similar predictor (numerically better) of EDSS worsening when compared to 20% worsening in T25FW (AUC 0.596 vs. 0.552). (The ROC curve is shown in Figure 3) Based on the ROC coordinates, examples for ETGUG cut-off values include: −6.2% change with 80% sensitivity and 34.4% specificity, −12.5% change with 92.3% sensitivity and 22.2% specificity and −16.3% change with 96.2% sensitivity and 17.9% specificity. Follow-up EDSS scores were associated with all walking measures and ETGUG subscores (walk1>gait initiation>walk2>sit-down>sit-up>turn-around). The absolute change in EDSS was significantly associated only with changes in walk-1 of ETGUG (r = 0.172, p = 0.038). Neither changes in total ETGUG, nor T25FW were associated with absolute change in EDSS. On the other hand, a greater % of PwMS had improvement in ETGUG when compared to T25FW (14.5% vs. 6.2%).

Receiver operating characteristics (ROC) for predicting disability progression. Legend: The positive actual state is EDSS worsening. Using the previously determined cut-off value of −15% change in the total ETGUG, the sensitivity and specificity for EDSS worsening was 92.3 and 83.9, respectively.
Logistic regression and receiver operating characteristics (ROC) analysis of ETGUG and T25FW in terms of EDSS progression in patients from the NYSMSC database.

Comparison in lower extremity performance between PwMS with stable or worsening EDSS are shown in Table 7. PwMS with EDSS worsening had significantly longer baseline T25FW (age-adjusted p = 0.043) when compared to stable PwMS. At the follow-up visit, PwMS with EDSS worsening had significantly longer T25FW (age-adjusted p = 0.01), gait initiation (age-adjusted p = 0.003), walk-1 (age-adjusted p = 0.005), walk-2 (age-adjusted p = 0.007) and total ETGUG (age-adjusted p = 0.012) when compared to stable PwMS. No concurrent absolute changes were different between worsening versus stable PwMS.
ETGUG and T25FW changes in PwMS based on EDSS changes.

Patients were classified as worsening when they had an EDSS worsening ≥1.0 in patients with baseline EDSS between 1.0–5.5, or 0.5 in patients with baseline EDSS of ≥5.5. The remaining patients were classified as stable.
* - Not significant after false discovery rate (FDR) correction using Benjamini-Hochberg procedure.
All measures are shown as median (interquartile range). All walking tests are shown in seconds. Non-parametric Mann-Whitney U-test was used. For age-adjusted ANCOVA, the walking measures were rank transformed. Statistically significant p-values lower than 0.05 are shown in bold.
The progression in walking measures over the follow-up based on EDSS cut-off of ≥3.0 are shown in Supplement Table 3. Lastly, walking differences between PwMS and their DMT status are shown in Supplement Table 4. The only significant difference between the four groups was the % change in walk-1 of ETGUG. PwMS that started or stopped DMT had a significantly greater % increase in walk-1 when compared to patients that remained on the same or changed the DMT. This finding did not survive FDR correction.
Discussion
Utilizing two separate study cohorts of PwMS we were able to demonstrate almost perfect reproducibility of the ETGUG measure. The clinical meaningfulness of ETGUG in capturing walking/physical disability was similar to the current gold standard (the T25FW test). Over the 32-month follow-up period, the PwMS patients demonstrated significant worsening only in the ETGUG, while the T25FW test remained unchanged.
In previous MRI-based work, our group also demonstrated that the ETGUG measure and its components may be a better depicter of global gray matter pathology. 19 After adjustment for disease duration and age, the ETGUG was significantly associated with cortical gray matter volume. 19 Moreover, the measure of turn-around was correlated with all investigated MRI measures, including both lesional and neurodegenerative pathology. 19 This ETGUG segment particularly correlated with more MRI-based structures when compared to the T25FW measure. 19 In addition to general MRI-based biomarkers, the ETGUG segments could potentially provide better phenotypical depiction of pathologies located in the cerebellum in general and in separate cerebellar regions. Given that the cerebellum is recently linked as a driver of disability in early and progressive MS, an easy walking test sensitive to cerebellar pathology could be of significant predictive benefit.20,21 Indicators of gait coordination in PwMS have been previously associated only with cerebellar volume and no correlations with other brain structures were found. 22 Moreover, a recent study showed that physical disability can be explained by gray matter atrophy of the cerebellum lobules I-IV and the vermis. 23 Lesions or atrophy in the flocculonodular lobe could be associated with gait imitation times, midline (vermis) lesions could significantly affect turn-around times and hemisphere pathology with walk and turn-around times. Cerebellar pathology is present from early MS stages and particularly prevalent in primary-progressive MS. 24
The total ETGUG times and the components can also be a more responsive biomarker in treatments that include physical therapy or movement therapy. Many of the physical therapy techniques teach safe turning while walking and demonstrate how to safely maintain balance standing up from a seated position. None of the improvements derived from this type of physical therapy could be captured by the T25FW or the TUG tests. Albeit TUG does incorporate these standing-up, turning around and sitting-down components, it only measures the total completion time. On the other hand, ETGUG can directly identify the specific component that the patient is having the most trouble with, which would allow the physiotherapists to effectively plan a program that will target the specified limitation and address one ETGUG segment at a time. The single time measurement of T25FW and TUG potentially averages out the important change. Taken together, here we propose that the 15% improvement in ETGUG could potentially be utilized in exercise-based MS trials and as targets for physiotherapists in their programs. Before ETGUG is included in physiotherapy studies of PwMS, its utility remains hypothetical. However, the use of ETGUG in determining patients at risk for future falls is of an additional benefit over the T25FW test. 25 In a previous analysis, the total ETGUG test and each ETGUG segments were shown as a sensitive predictors of future falls, with odds ratios ranging from 7.3 (95% CI from 2.2 to 24.5) to 19.8 (95% CI from 5.0 to 78.0). 25
One limitation to this report includes the length of the follow-up and lack of healthy control comparison. Given that changes in lower extremity performance and changes in disability could take a relatively long time to occur, the follow-up period of <3 years may have not been sufficient enough. In our longitudinal cohort, only 26 PwMS experienced disability worsening and even fewer (4 patients) experienced disability improvement as measured by EDSS. In a similar fashion, only 35 PwMS had ETGUG worsening greater than the cut-off of 15%, and only 23 PwMS had T25FW worsening greater than the cut-off of 20%. While the majority of these patients were stable in their EDSS, a potential clinically meaningful improvement should not be disregarded. Future long-term studies should confirm the utility of ETGUG as a potential proxy measure for lower extremity performance and as a potential predictor of future disability changes.
Several studies have previously examined the ETGUG utility in healthy controls and compared it patients with various pathologies. First of all, the initial study by Wall et al. also demonstrated that there is no significant difference if ETGUG was performed by two different raters. 12 The study also demonstrated that each ETGUG component was able to differentiate young and elderly healthy controls with elderly subjects at risk of falling. 12 To facilitate cross-study comparison, the healthy control data from Wall et al. is shown in the legend of Table 4. The test-retest reproducibility in our sample were performed in PwMS, potentially increasing the variability through MS-based fatigue. On the other hand, the test-retest ETGUG reliability was tested in a sample of 54 healthy young individuals over two 18-days apart sessions. 26 ETGUG demonstrated good intra-rater ICC of 0.919 and non-significant difference over 18-days of follow-up (mean difference of 0.3s). 26 Lastly, the ETGUG demonstrated excellent inter-rater consistency, test-retest reliability and small detectable change (0.05–0.21s) in a patients with bilateral vestibular loss. When compared to healthy controls, all but gait initiation had good and significant dissimilatory capability. 27
The lack of healthy controls in our longitudinal analysis limit the interpretation of the improvement in the sit-down segment. When compared to the remaining worsening ETGUG segments, sit-down demonstrated an unexpected ∼25% improvement (from 3.9s to 2.9s). Another interesting data divergence occurs between worsening in walk segments when compared to T25FW. While these walks are similar in length at face value, the string of tasks in ETGUG may further exacerbate the walking disabilities. Another limitation of the manuscript is the fact that only a small number of patients underwent changes in their DMT regiment, thus reflecting low overall disease activity and not including patients from all aspects of disability. While there were no differences in their walking measures in cross-sectional analysis (at baseline and follow-up), patients that changed therapy had a greater increase in walk-1 time from the ETGUG. These findings could potentially be attributed to disease worsening that prompted the start of DMT (in case of early RR), or disease worsening in the later stages of the disease (aging and progressive PwMS), where the clinicians have decided to discontinue medication due to lack of efficacy. Our DMT comparison findings should be further replicated in additional sample analyses, given that there were only a limited number of patients in the respective DMT categories. Additional long-term studies should determine whether the slowing in walking in our cohort was a reason for DMT change, or a result of it. More disabled PwMS (use of cane or a walker aids) could provide data regarding the generalizability of the ETGUG test in all disability categories. That said, ETGUG time and its segments have potential to further differentiate significantly disabled PwMS which have problems such as getting up and sitting down, an aspect that is not captured by T25FW. Contrarily, the reproducibility of ETGUG may be lower in more disabled MS population. Lastly, a limitation of the ETGUG test is the greater demand on the clinic/study operators that need to collect and calculate the patient scores. The additional value of ETGUG over T25FW should be considered with this cost-benefit limitation in mind.
In conclusion, ETGUG provides a more detailed and comprehensive measure of lower extremity performance when compared to the T25FW. When compared to some reproducibility differences in T25FW, ETGUG had almost perfect intra-rater and inter-rater repeatability. ETGUG cut-off of 15% has similar ability when compared to T25FW in terms of associations with concurrent disability changes as measured by EDSS scores. Further studies could focus on each segment of the ETGUG, with emphasis on relationships such as “turn around” and “get-up” times with cerebellar pathology. Lastly, the greater range of ETGUG changes (on both ends of the spectrum) could allow better sensitivity in clinical monitoring and response to DMT treatment.
Supplemental Material
sj-docx-1-mso-10.1177_20552173221099186 - Supplemental material for A prospective study to validate the expanded timed get-up-and-go in a population with multiple sclerosis
Supplemental material, sj-docx-1-mso-10.1177_20552173221099186 for A prospective study to validate the expanded timed get-up-and-go in a population with multiple sclerosis by Dejan Jakimovski, Katelyn S Kavak, Karen Zakalik, Lacey Bromley, Osman Ozel, Natasha Qutab, Svetlana P Eckert, Channa Kolb and Bianca Weinstock-Guttman in Multiple Sclerosis Journal – Experimental, Translational and Clinical
Footnotes
Declaration of conflicting interests
The author(s) declared the following potential conflicts of interest with respect to the research, authorship, and/or publication of this article: Dejan Jakimovski, Katelyn Kavak, Karen Zakalik, Lacey Bromley, Osman Ozel, Natasha Qutab, and Svetlana Eckert and have nothing to disclose. Channa Kolb has received speaker honoraria and consultant fees from EMD Serono, Teva Pharmaceuticals, Acorda, Novartis, Genzyme, Alexion, Genentech, Mallinckrodt and Biogen Idec.Bianca Weinstock-Guttman has participated in speaker’s bureaus and/or served as a consultant for Biogen, Novartis, Genzyme; Sanofi, Genentech, Abbvie, Bayer AG, and Celgene/ BMS. Dr. Weinstock-Guttman also has received grant/research support from the agencies listed in the previous sentence as well as Mallinckrodt Pharmaceuticals, Inc. She serves in the editorial board for BMJ Neurology, Journal of International MS and CNS Drugs.
Funding
The author(s) disclosed receipt of the following financial support for the research, authorship, and/or publication of this article: This work was supported by the Biogen, (grant number US-MSG-17-11179).
Supplemental material
Supplemental material for this article is available online.
References
Supplementary Material
Please find the following supplemental material available below.
For Open Access articles published under a Creative Commons License, all supplemental material carries the same license as the article it is associated with.
For non-Open Access articles published, all supplemental material carries a non-exclusive license, and permission requests for re-use of supplemental material or any part of supplemental material shall be sent directly to the copyright owner as specified in the copyright notice associated with the article.