
Abstract
Background
Siponimod (BAF312), a selective S1P1/S1P5 agonist, reduces disability progression in secondary progressive MS. Recent observations suggest it could act via S1P1/S1P5-dependent anti-inflammatory and pro-myelination effects on CNS-resident cells.
Objective
Generate preclinical evidence confirming siponimod's CNS penetration and activity.
Methods
Siponimod's CNS penetration and distribution was explored in rodents and non-human primates (NHPs) using: Liquid Chromatography coupled to tandem Mass Spectrometry (LC-MS/MS), quantitative whole-body autoradiography (QWBA) using 14C-radiolabeled siponimod or non-invasive single-photon emission CT (SPECT) with a validated 123I-radiolabeled siponimod analog. Functional CNS activity was investigated by S1P1 receptor quantification in brain homogenates.
Results
In mice/rats, siponimod treatments achieved dose-dependent efficacy and dose-proportional increase in drug blood levels, with mean brain/blood drug-exposure ratio (Brain/BloodDER) of 6–7. Efficacy in rat brain tissues was revealed by a dose-dependent reduction in brain S1P1 levels. QWBA distribution analysis in rats indicated that [14C]siponimod related radioactivity could readily penetrate CNS, with particularly high uptakes in white matter of cerebellum, corpus callosum, and medulla oblongata versus lower exposures in other areas such as olfactory bulb. SPECT monitoring in NHPs revealed CNS distribution with a brain/bloodDER of ∼6, as in rodents.
Conclusion
Findings demonstrate siponimod's CNS penetration and distribution across species, with high translational potential to human.
Keywords
Introduction
Siponimod is the first oral disease-modifying therapy shown to reduce disability progression, cognitive decline, total brain volume loss, gray matter atrophy, and signs of demyelination in secondary progressive multiple sclerosis (SPMS) patients.1–3 It is a potent and selective agonist for two of the five known membrane G-protein-coupled receptors for sphingosine-1-phosphate (S1P)-receptor subtypes 1 and 5 (S1P1 and S1P5) that has demonstrated robust immunomodulatory, anti-inflammatory, pro-myelination, and neuroprotective properties in various preclinical models.4–7 It was recently approved, as Mayzent®, for the treatment of relapsing forms of MS, including clinically isolated syndrome, relapsing-remitting disease (RRMS), and SPMS, in adults (USA) 8 and for SPMS patients with active disease (Europe). 9
The immunomodulatory properties of siponimod involve S1P1-dependent retention of blood-pathogenic lymphocytes within secondary lymphoid organs, as established previously for fingolimod (FTY720, Gilenya®), the prototype S1P-modulator approved as an oral agent for RRMS,10,11 and for all the S1P1 agonists described thus far.12,13 The underlying molecular mechanisms involve internalization and degradation (down-modulation or functional antagonism) of S1P1 receptors on pro-inflammatory T- and B-lymphocytes. 10 Consequently, lymphocytes become unresponsive to the S1P gradient, depriving them of an obligatory signal to egress from secondary lymphoid organs and thus preventing their recirculation to susceptible target organs such as the central nervous system (CNS).
In addition, siponimod's apparent anti-inflammatory, pro-myelination, and neuroprotective properties might be attributable to S1P1/S1P5-dependent effects on CNS-resident cells, as strongly suggested by numerous preclinical observations.4,6,14–16 Understanding siponimod's mechanism of action therefore requires exploration of its ability to penetrate and distribute within CNS tissues. A first set of evidence supporting CNS penetration for siponimod was obtained in mice 17 ; and the present study aimed to consolidate these observations by assessing CNS penetration/distribution for siponimod, and siponimod-related radioactive material (siponimod and/or metabolites), in rodents and in a more translational relevant preclinical species such as non-human primates (NHPs).18,19
Materials and methods
Animals and animal welfare
All studies in rodents were performed in accordance with protocols approved by the Cantonal Veterinary Office of Basel and according to regulations defined by the European Community Council Directive for animal protection. Briefly, adult female C57BL/6J mice (18–19 g; Charles River or Harlan Laboratories Switzerland) and male Long Evans or Han:Wistar rats (220–230 g; Janvier, France/Harlan, The Netherlands) were group housed and had free access to tap water and standard diet (Maus/Ratte Haltung GLP, KLIBA NAFAG-3890; Provimi Kliba AG, Switzerland). Housing rooms were temperature controlled (22 ± 2°C) throughout the study period. Animal housing, care, and experimental use were conducted according to the Swiss Federal Law for animal protection.
Studies in NHPs were carried out under institutional animal care protocols complying with US-Federal regulations. Animal housing/care approval and oversight was provided by the Rush University, Chicago, Illinois IACUC. Briefly, 2 male rhesus macaques (Macaca mulatta) housed at the Rush University Medical Center in Chicago (Illinois, USA) were used for SPECT imaging. Imaging was conducted under institutional animal care protocols complying with Federal regulations.
Experimental protocols
Studies in mice
These studies aimed at measuring siponimod concentrations in blood and brain in mice treated with siponimod-loaded diet for at least 10 days at various doses. Mice were either healthy or subject to experimental autoimmune encephalomyelitis (EAE):
In healthy mice: C57BL/6 mice were randomization in treatment groups (n = 6/group) and fed for 10 days with siponimod-loaded food pellets (prepared as described in Supplementary Information) at various doses, 0.1, 0.3, 1, 10, and 30 mg siponimod/kg of food, to achieve drug uptakes of about 0.3, 1, 3, 30, and 100 µg/day, respectively (when considering a mean daily food uptake of ∼3 g/day). At termination, mice were deeply anesthetized with oxygen/isoflurane (97/3, v/v; isoflurane:Forene®, Abbott AG, Switzerland). Terminal blood samples (∼100 µL) and brain tissues were collected for measuring the blood lymphocyte counts and the siponimod levels via LC-MS/MS. As all terminations were performed early mornings (∼2 h after start of day light), the measured drug levels correspond to the peak drug exposures, considering that mice eat about 70–80% of their food during the night. In EAE mice: Female C57BL/6 mice (12 weeks old) were randomized so all groups had similar mean body weights (n = 6–10/group). Siponimod treatment started on day-0 by introducing siponimod-loaded food pellets at 0, 3, 10, 30, 100 or 200 mg siponimod/kg of food (corresponding to drug uptakes of about 0, 10, 30, 100, 300 and 600 µg/day, respectively). On the same day (day-0), EAE was induced as described in the Supplementary information.
Studies in rats
These studies aimed at, 1 – Measuring siponimod concentrations in blood, plasma, brain and CSF at various time points after repeated oral dosing; 2-Assessing siponimod-induced down-modulation of S1P1 receptors in brain after repeated oral dosing; 3- Performing quantitative whole-body autoradiography (QWBA) at various time points after repeated oral dosing of [14C]siponimod hemifumarate.
Rat studies with non-radiolabeled siponimod:
- Rat study 1: Long Evans rats were treated daily by oral gavage over 7 days with siponimod at 0.01, 0.1, and 1 mg/kg/day (n = 3 /group). At 8 h after the last treatment, terminal blood and CSF samplings were performed under deep anesthesia with oxygen/isoflurane mixture (Forene®). Bodies were then perfused for 8 min, via a left ventricle cannula, with ice-cold phosphate-buffered saline before collecting the whole brain. Hemispheres were separated, weighed and placed onto dry ice before storage at − 80°C until further use, one side for siponimod content via LC-MS/MS, the other side for the level of S1P1 receptors. - Rat study 2: Han:Wistar rats were treated daily by oral gavage over 7 days with siponimod at 3 mg/kg. On the last treatment day, terminal blood (∼200 µL), CSF (∼20 µL) and brain samplings were performed, under deep Forene® anesthesia, at 8, 24, 72, or 168 h post-last dosing (n = 2–3/time point). Plasma samples were prepared by centrifugation (2000 g) of blood aliquots at 4°C for 10 min. All blood, plasma, CSF and brain samples were stored at − 80°C until further processing for siponimod content via LC-MS/MS. Rat studies with radiolabeled siponimod:
- Male Long Evans rats were treated daily by oral gavage over 7 days with [14C]siponimod hemifumarate at 3 mg/kg (dose referring to base). On the last treatment day, rats were terminated via deep Forene® anesthesia at 8, 24, 72, or 168 h post-dose (n = 1/time point) and blood samples (∼200 µL) collected via sublingual vein puncturing for radioactivity determination by liquid scintillation counting (LSC). The carcasses were processed for QWBA analysis (details in Supplementary Information) to assess the distribution of [14C]siponimod related radioactivity over time to the various CNS regions.
Studies in NHPs
These studies aimed at monitoring, in 2 male rhesus macaques, siponimod brain penetration and distribution, via non-invasive single-photon emission CT (SPECT), using a specific tracer (MS565), a previously validated 123I-radiolabeled imaging analog for siponimod. 17 Parts of these works were previously reported. 20 Details concerning the SPECT analysis are described in Supplementary Information.
Treatment materials
All test materials used in different studies were supplied by Novartis, Basel, Switzerland (see Supplementary Information).
Analysis of biological samples
The whole blood lymphocyte counts were measured with the use of an ADVIA 120 Hematology System with MultiSpecies Software [BAYER].
Plasma samples were prepared by centrifugation (2000 g for rodent, 3000g for NHP) of blood aliquots at 4°C for 10 min. All blood, plasma, and brain tissue samples were stored at −80°C until further processing for siponimod content via LC-MS/MS or radioactivity measurements. Further technical details concerning analysis of biological samples collected are described in the Supplementary Information.
Data analysis
For the EAE study, clinical score comparisons between treatment groups were evaluated on a daily basis and compared to vehicle control. All statistical analyses of clinical score parameters used a Mann-Whitney rank sum test For S1P1 levels in tissues, a parametric Student's T-test was utilized. All statistical analyses were performed using GraphPad Prism version 6 for Windows, (GraphPad Software, USA). Statistical significance was set at p < 0.05.
Results
Siponimod penetrates mouse CNS in a dose-proportional manner and protects against the development of EAE
Both heathy and EAE mice fed with siponimod-loaded food pellets showed dose-proportional steady-state siponimod levels in blood and brain homogenates, with markedly higher levels in brains for all siponimod doses tested (Figure 1). Similar siponimod levels were determined in the cerebral cortex versus rest of brain, although there was a trend for the levels to always be the lowest in the cortex.
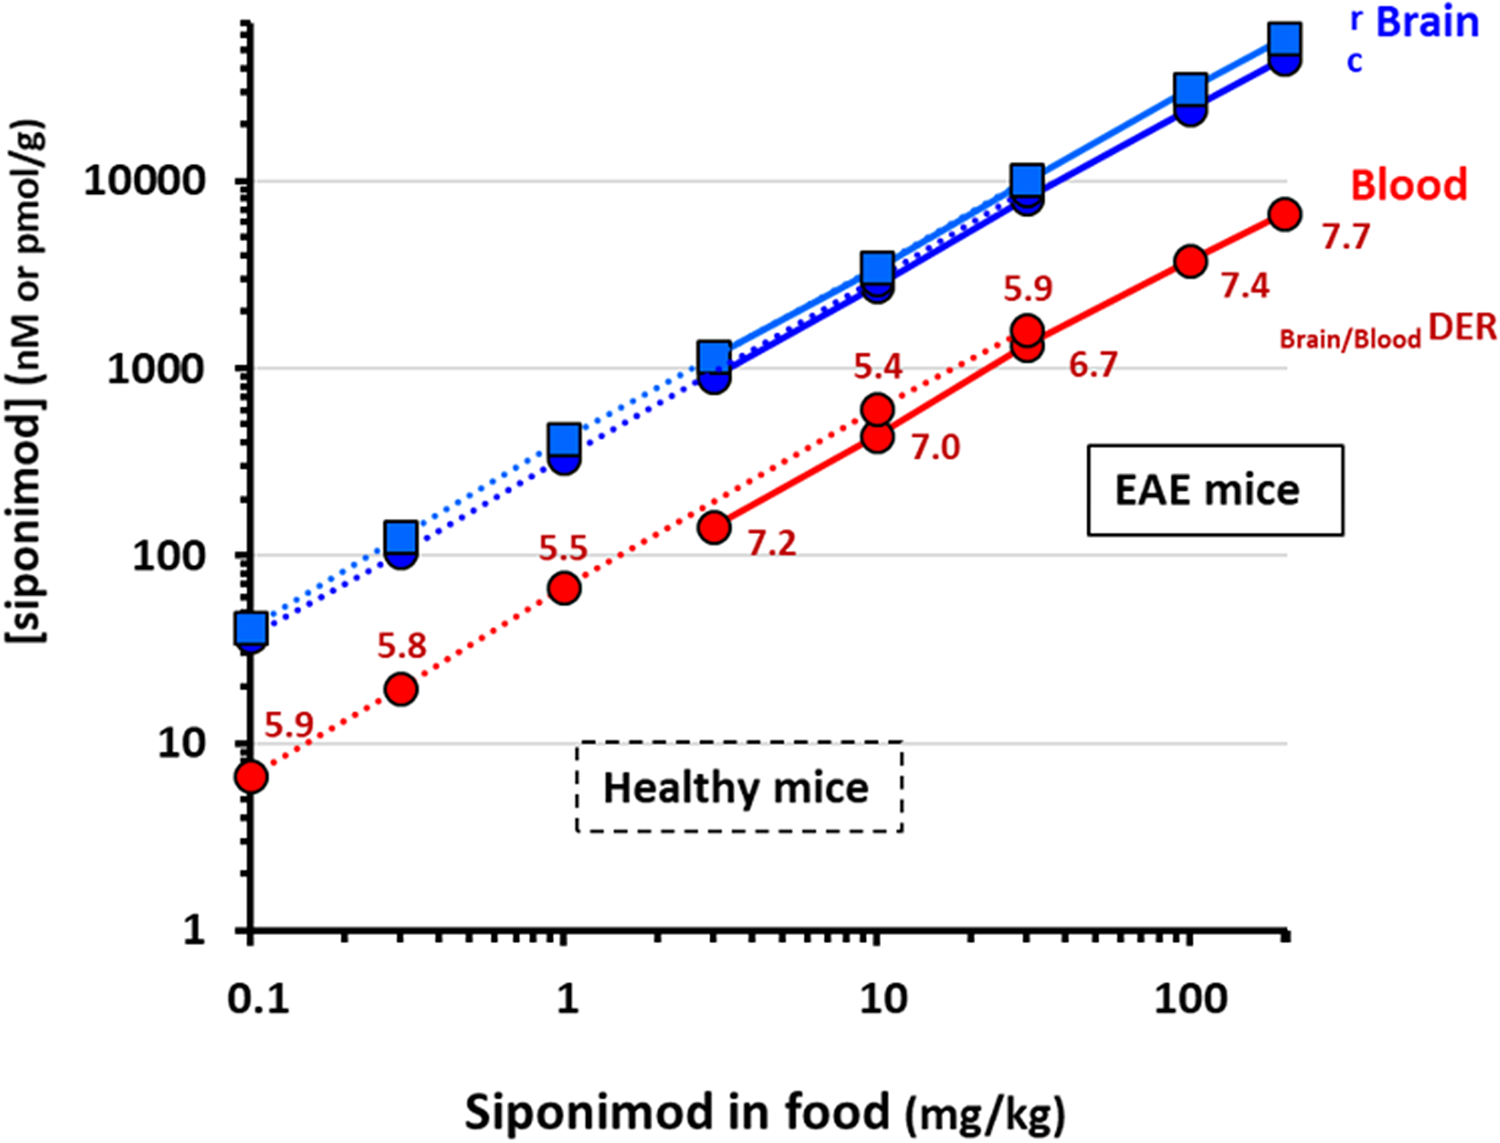
Dose-proportional steady-state siponimod levels in healthy and EAE mice. Healthy and EAE mice were fed for several days with siponimod-loaded food pellets at various concentrations (0.1 to 200 mg of siponimod per kg of food). Steady-state siponimod concentrations reached in blood and brain homogenates are shown (c, cortex; r, rest of the brain). Dotted lines link results obtained in healthy mice whereas plain lines are used for EAE mice. Blood concentrations are expressed as nM and in brain as pmol/g (equivalent to nM). All points are mean ± SEM (n = 6–10). For each dose tested, the mean Brain/BloodDER was calculated.
In heathy mice, the dose-proportional increase in siponimod blood levels resulted in a dose-dependent reduction in blood lymphocyte counts (Figure 2(a)), with a maximal reduction of about 80% achieved at a diet-loading dose of 10 mg/kg (approximatively equivalent to a daily drug intake of 30 µg/mouse or 1.5 mg/kg). At this dose, the mean siponimod levels achieved in whole blood and brain homogenates were within the 500 nM and 3 µM ranges, respectively. Higher drug exposures did not induce stronger reduction in blood lymphocytes. For all doses tested, the mean drug-exposure ratio between brain homogenates and blood (Brain/BloodDER) approached 6, suggesting a steady CNS penetration for siponimod across a wide dose-range.
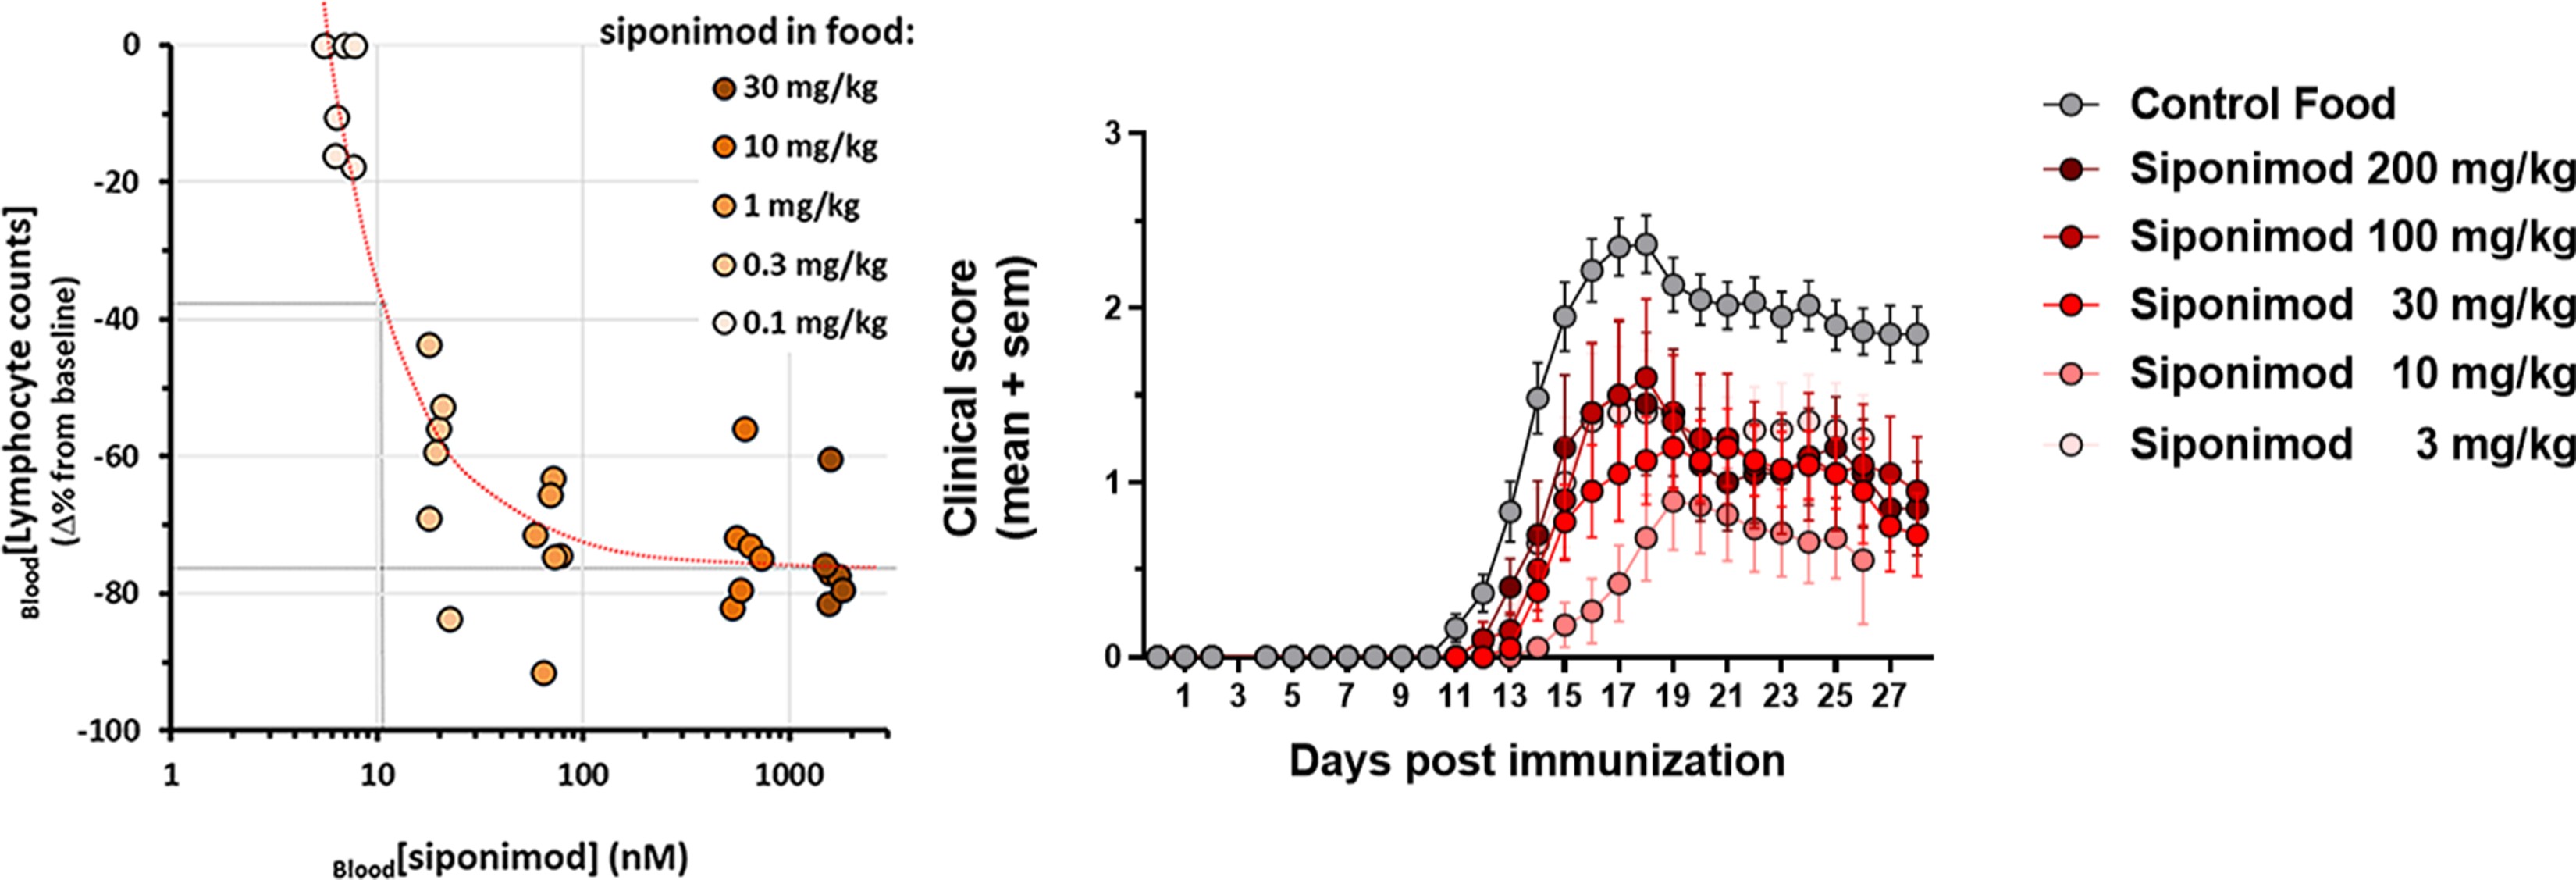
(a) individual blood lymphocyte counts measured in naive mice fed over 10 days with diet loaded with siponimod at 0.1, 0.3, 1, 10 and 30 mg/kg. (b) Longitudinal changes in mean EAE severity scores in mice fed with a siponimod-loaded diet at 3, 10, 30, 100 or 200 mg/kg of food (n = 6–10/treatment group). SEM, standard error of the mean.
In EAE mice, the dose-proportionality of the siponimod levels in blood and brain homogenates were aligned with those seen in healthy mice. As blood drug levels tended however to be a bit lower than in healthy mice, a mean Brain/BloodDER around 7 was found for all doses tested (Figure 1). In addition, all the siponimod doses tested were efficacious at significantly reducing the blood lymphocyte counts by 70–80% (p < 0.05; details not shown), as well as the development of EAE scores (p < 0.05), with a maximal efficacy obtained at the diet-loading dose of 10 mg/kg (Figure 2(b)). At this dose, the mean siponimod levels in whole blood and brain homogenates were within the 400–500 nM and 3–3.5 µM ranges, respectively. Higher drug exposures did not result in significantly stronger protection against EAE.
Siponimod penetrates rat CNS and is pharmacologically active
The siponimod concentrations in blood, plasma, brain homogenates, and CSF measured 8 h post-last treatment in rats treated for 7 consecutive days with siponimod at 0.01, 0.1, or 1 mg/kg/day (rat study 1) are shown in Figure 3(a). Siponimod concentrations in blood and plasma were within the same range and increased in a dose dependent manner, reaching the 2-, 12-, and 120-nM range at 0.01, 0.1, and 1 mg/kg/day, respectively. Nearly 6-fold higher drug levels were measured in brain homogenates (i.e. ∼16, 70 and 700 nM range, respectively), indicating brain/blood(DER) or brain/plasma(DER) around 6, as in mice. In CSF, siponimod concentrations within 0.2 nM were detected only with the highest treatment dose of 1 mg/kg/day, indicating a CSF/brain ratio reaching 0.0003 and therefore suggesting that the siponimod measured in brain tissues was mostly (>99.9%) bound to tissues.
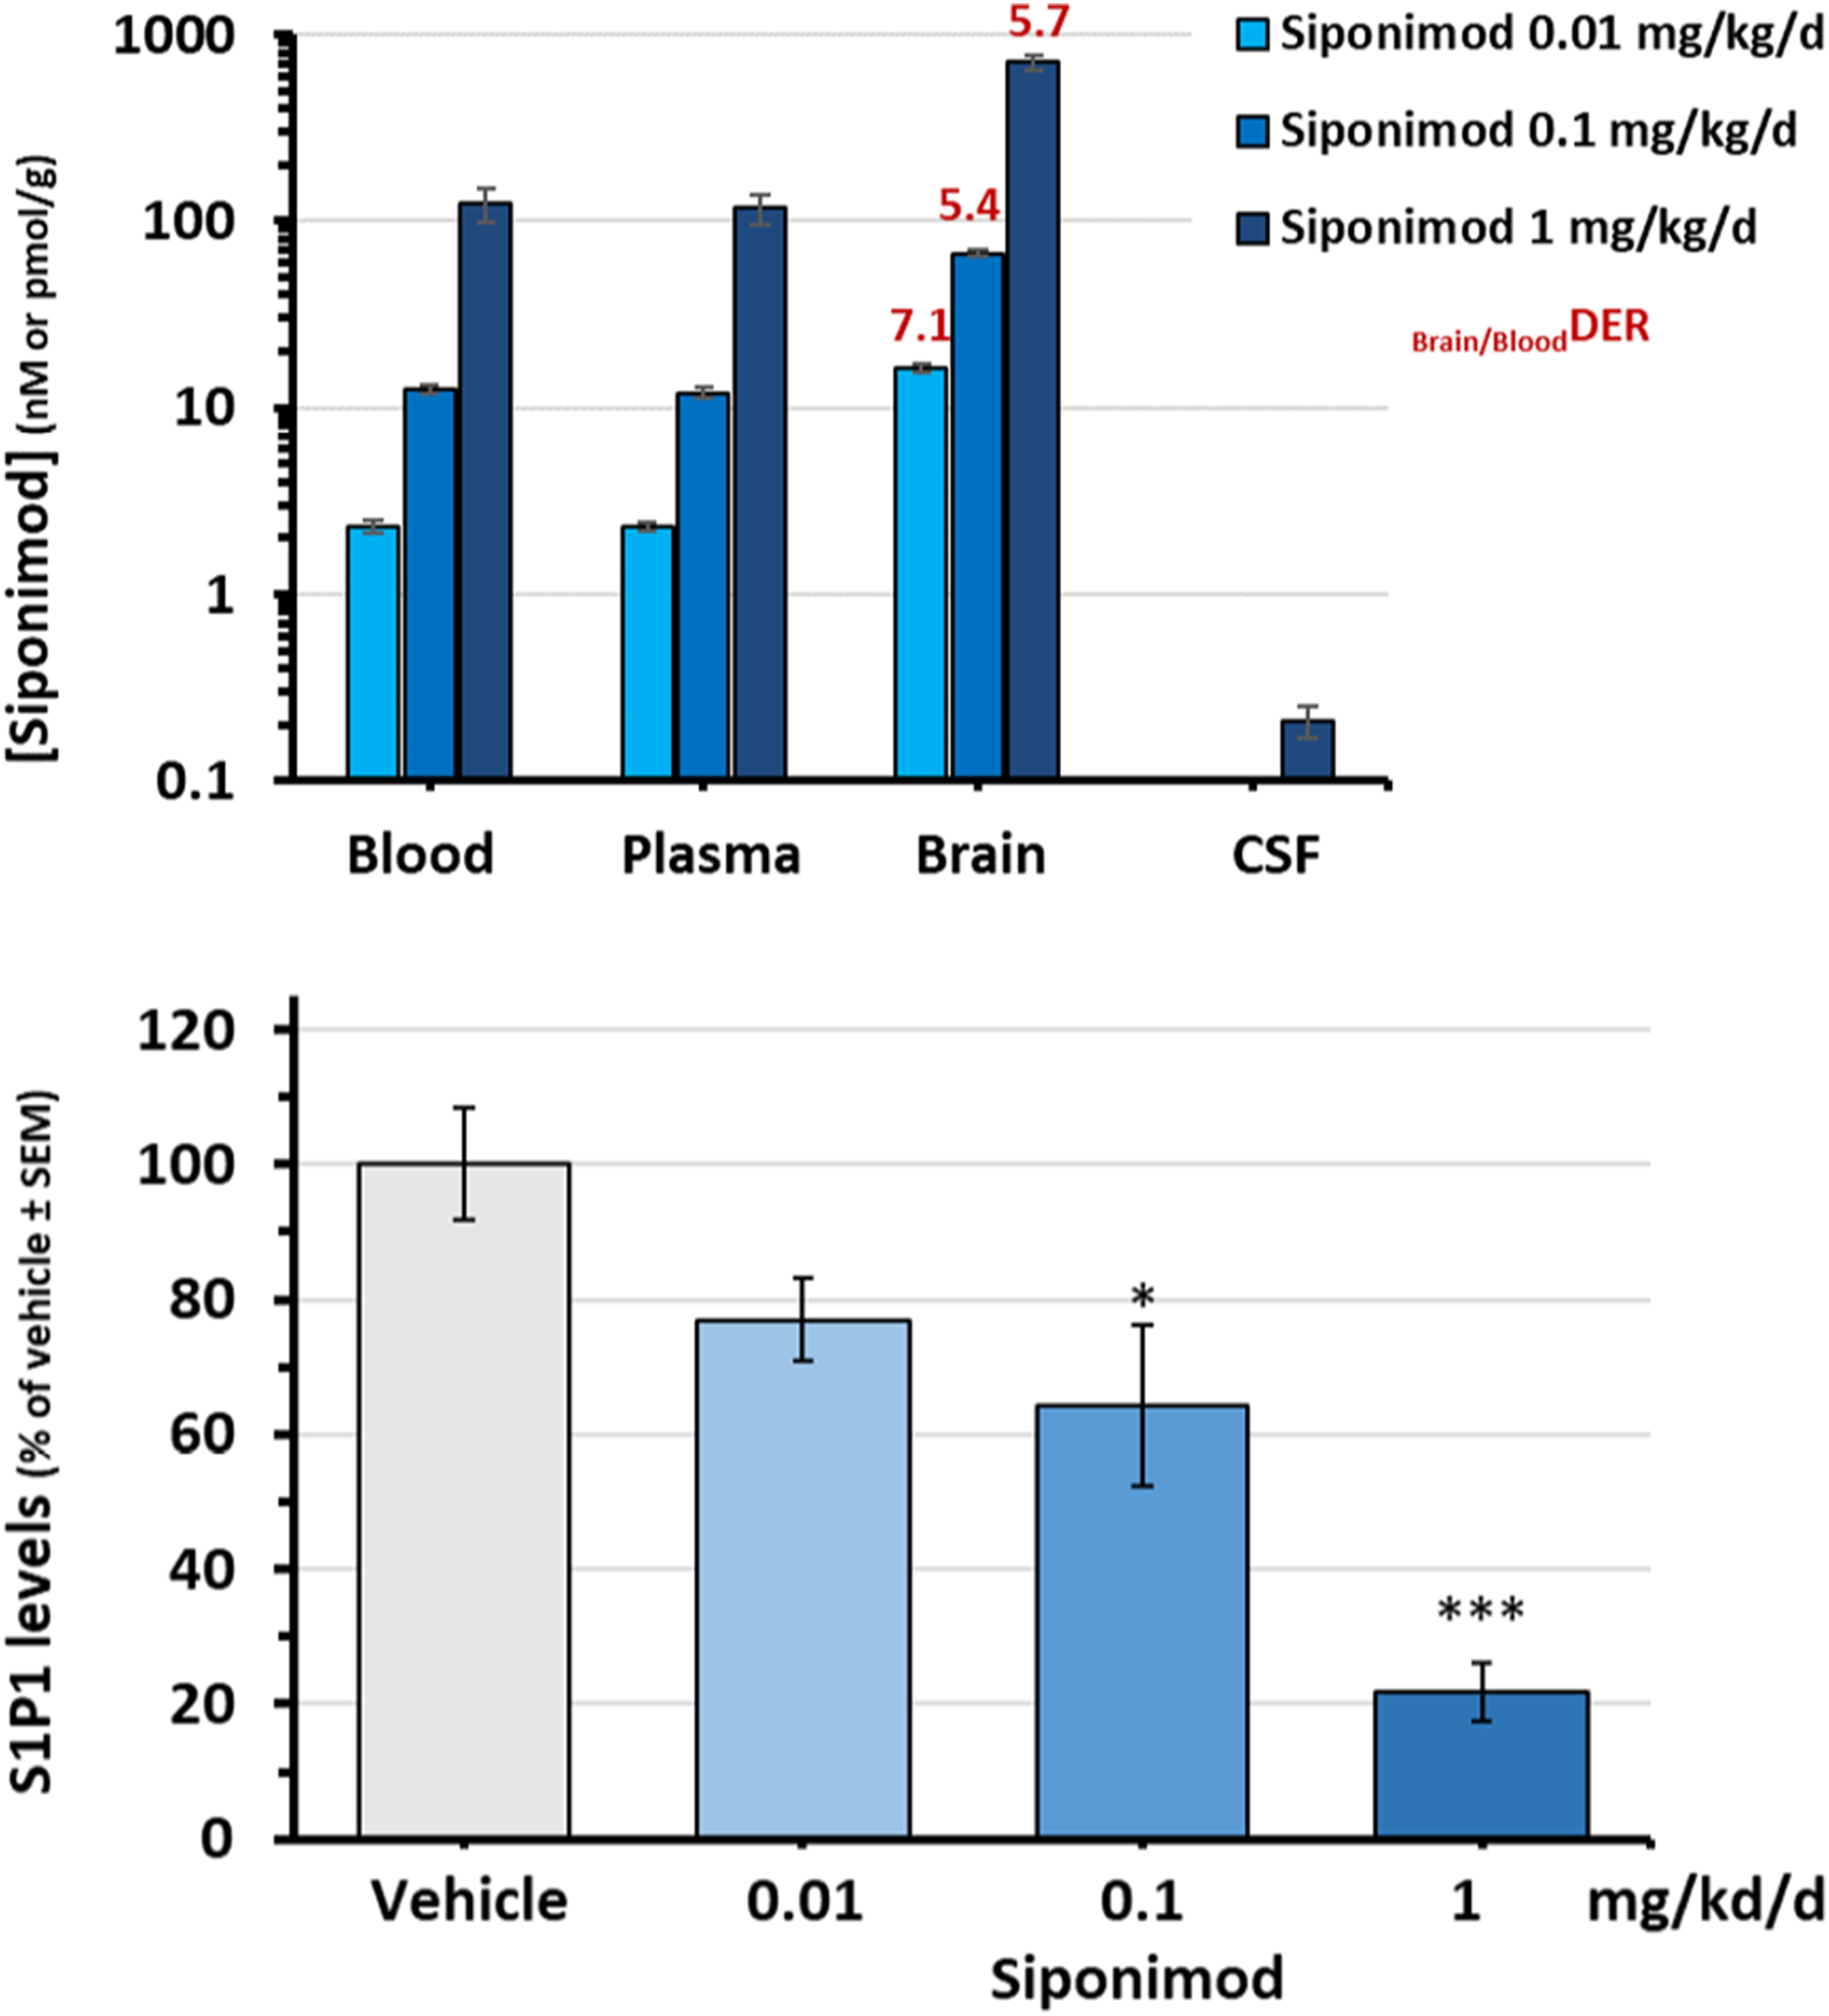
Dose-dependent siponimod levels in rats. Rats were treated orally for 7 days with siponimod at 0.01, 0.1, and 1 mg/kg/day (n = 3/group): (a) Siponimod concentrations in blood, plasma, brain, and CSF, at 8 h after the last treatment. Blood, plasma, and CSF concentrations are expressed in nM and brain levels in pmol/g (equivalent to nM); (b) Mean amount of S1P1 protein detected in the brain homogenates of the treated rats, as expressed in % versus vehicle-treated group. *p < 0.05, ***p < 0.005. CSF, cerebrospinal fluid; DER, drug-exposure ratio; S1P, sphingosine 1-phosphate; SEM, standard error of the mean.
The siponimod concentrations achieved in brains were associated with a dose-dependent down-modulation of S1P1 receptors in brain homogenates, as indicated by measurements of S1P1 protein levels (Figure 3(b)). There was no significant effect for siponimod at 0.01 mg/kg/day (∼16 nM in brain tissues) and average reductions of 36% and 78% in S1P1 protein levels were observed for siponimod at 0.1 and 1 mg/kg/day (∼70 and 700 nM in brain tissues), respectively, versus vehicle control.
To track siponimod concentrations over time in plasma versus brain and CSF, rats were treated with 3 mg/kg/day siponimod and samples were collected at 8, 24, 72, and 168 h after the last treatment (rat study 2). The plasma siponimod levels measured at 8 h post-treatment reached a mean concentration range of 0.7 µM, whereas ∼3-fold higher levels were measured in brain (2.3 µM) (Table 1). Simultaneously, mean siponimod concentrations within the 6 nM range were detected in CSF, i.e. 340-fold lower compared to brain. At 24 h post-last treatment, siponimod concentrations in plasma, brain, and CSF were reduced versus 8 h values by 90%, 50%, and 70%, respectively. At 72 h post-treatment, siponimod could no longer be detected in plasma and CSF but was still measurable in brains (∼35 nM range).
Concentrations of siponimod in plasma, brain, and CSF following 7 daily oral doses at 3 mg/kg/day to Han:wistar rats. Measurements were performed in samples collected at different time points (8, 24, 72, and 168 h) after the last treatment.

Limit of quantification (LOQ) for plasma: 0.0019 nM. A similar value was considered for brain and CSF. Values below LOQ were set to 0.
CSF: cerebrospinal fluid; DER: drug-exposure ratio.
Taken together, these results suggest siponimod's dose-proportional CNS penetration and efficacy on S1P1 receptors in rats, with specific kinetic profiles in plasma, brain tissues and CSF. The markedly lower concentrations of siponimod measured in CSF versus brain tissues suggest that siponimod measured in CNS tissues is mostly (>99.9%) bound to tissues. This is in line with previous studies proposing that drug levels measured in the CSF are surrogate measurements for brain unbound concentrations. 21
[14c]siponimod-related radioactivity distributes throughout CNS in rats
Rats were treated orally for 7 days with [14C]siponimod hemifumarate at 3 mg/kg/day (dose referring to base), and the amount of radioactivity (reflecting siponimod and/or its metabolites) was determined using QWBA at 8, 24, 72, and 168 h after the last treatment. Representative examples of whole-body autoradiographs focusing on the head region are shown in Figure 4(a). Concentration time courses of [14C]siponimod-related radioactivity measured in various brain regions are shown in Figure 4(b). The corresponding calculated tissue PK parameters are listed in Table 2.

QWBA analysis after repeated oral dosing with [14C]siponimod. Male Long Evans rats were treated orally for 7 days with [14C]siponimod hemifumarate at a dose of 3 mg/kg/day (dose referring to base; n = 1/time point): (a) Quantitative whole-body autoradiograms, focusing on the head region, collected at 8, 24, 72, and 168 h after the last oral dose are shown. The carcasses were cut longitudinally through the middle. The whitest area corresponds to the highest radioactivity concentration; (b) Tissue concentration over time courses of total radiolabeled components in blood and different brain regions. GM, gray matter; QWBA, Quantitative Whole Body Autoradiography; WM, white matter.
Pharmacokinetic parameters of total radiolabeled components after multiple oral doses of 3 mg/kg/day [14C]siponimod hemifumarate (dose referring to base) in long evans rats.

Normalized to blood value (i.e. Tissue/blood ratio).
AUClast: Area under the concentration-time curve from time zero to time of last measurable concentration; Cmax: maximum plasma concentration; LSC: liquid scintillation counting; NA: not applicable; NC: not calculated due to the limited data set; QWBA: quantitative whole-body autoradiography; Tmax: time taken to reach Cmax; Tlast: time of last measurable concentration; T½: elimination half-life.
Following 7 daily oral doses of 3 mg/kg/day [14C]siponimod hemifumarate, the related radioactivity was taken up into the brain extensively with areas under the concentration-time curves from time zero to the last measurable concentration normalized to blood AUClast (AUClast tissue/blood ratios) of 5.0–23.2, suggesting regional differences for the distribution of [14C]siponimod-related radioactivity in the CNS. Highest AUClast tissue/blood ratios were observed for spinal cord (white matter (23.2), the white matter of cerebellum (15.1), corpus callosum (12.9), and medulla oblongata (12.4). Interestingly, about 2-fold higher siponimod exposures could be observed in white versus gray matters of the brain and spinal cord (Table 2).
Siponimod penetrates CNS in NHPs
Two rhesus macaques received a single intravenous bolus injection of [123I]MS565 and were monitored over 3 days for brain SPECT imaging. A representative example of the [123I]MS565 SPECT monitoring is shown in Figure 5(a). Overall, [123I]MS565 displayed good brain penetration, with brain-tissue uptake (particularly marked in cortical and thalamic areas) increasing over 26–32 h post-injection and then slowly washing out up to 48 h. Quantitative analysis of these SPECT images resulted in a more precise kinetic of drug uptake (expressed as standard uptake value (SUV) by brain tissues) (Figure 5(b)) and revealed a peak CNS uptake within 18–24 h post-injection. At that time, the [123I]MS565 levels measured in plasma suggest that its elimination from plasma was nearly completed (>90%) and indicate a Brain/PlasmaDER of ∼6, as seen in mice and rats.
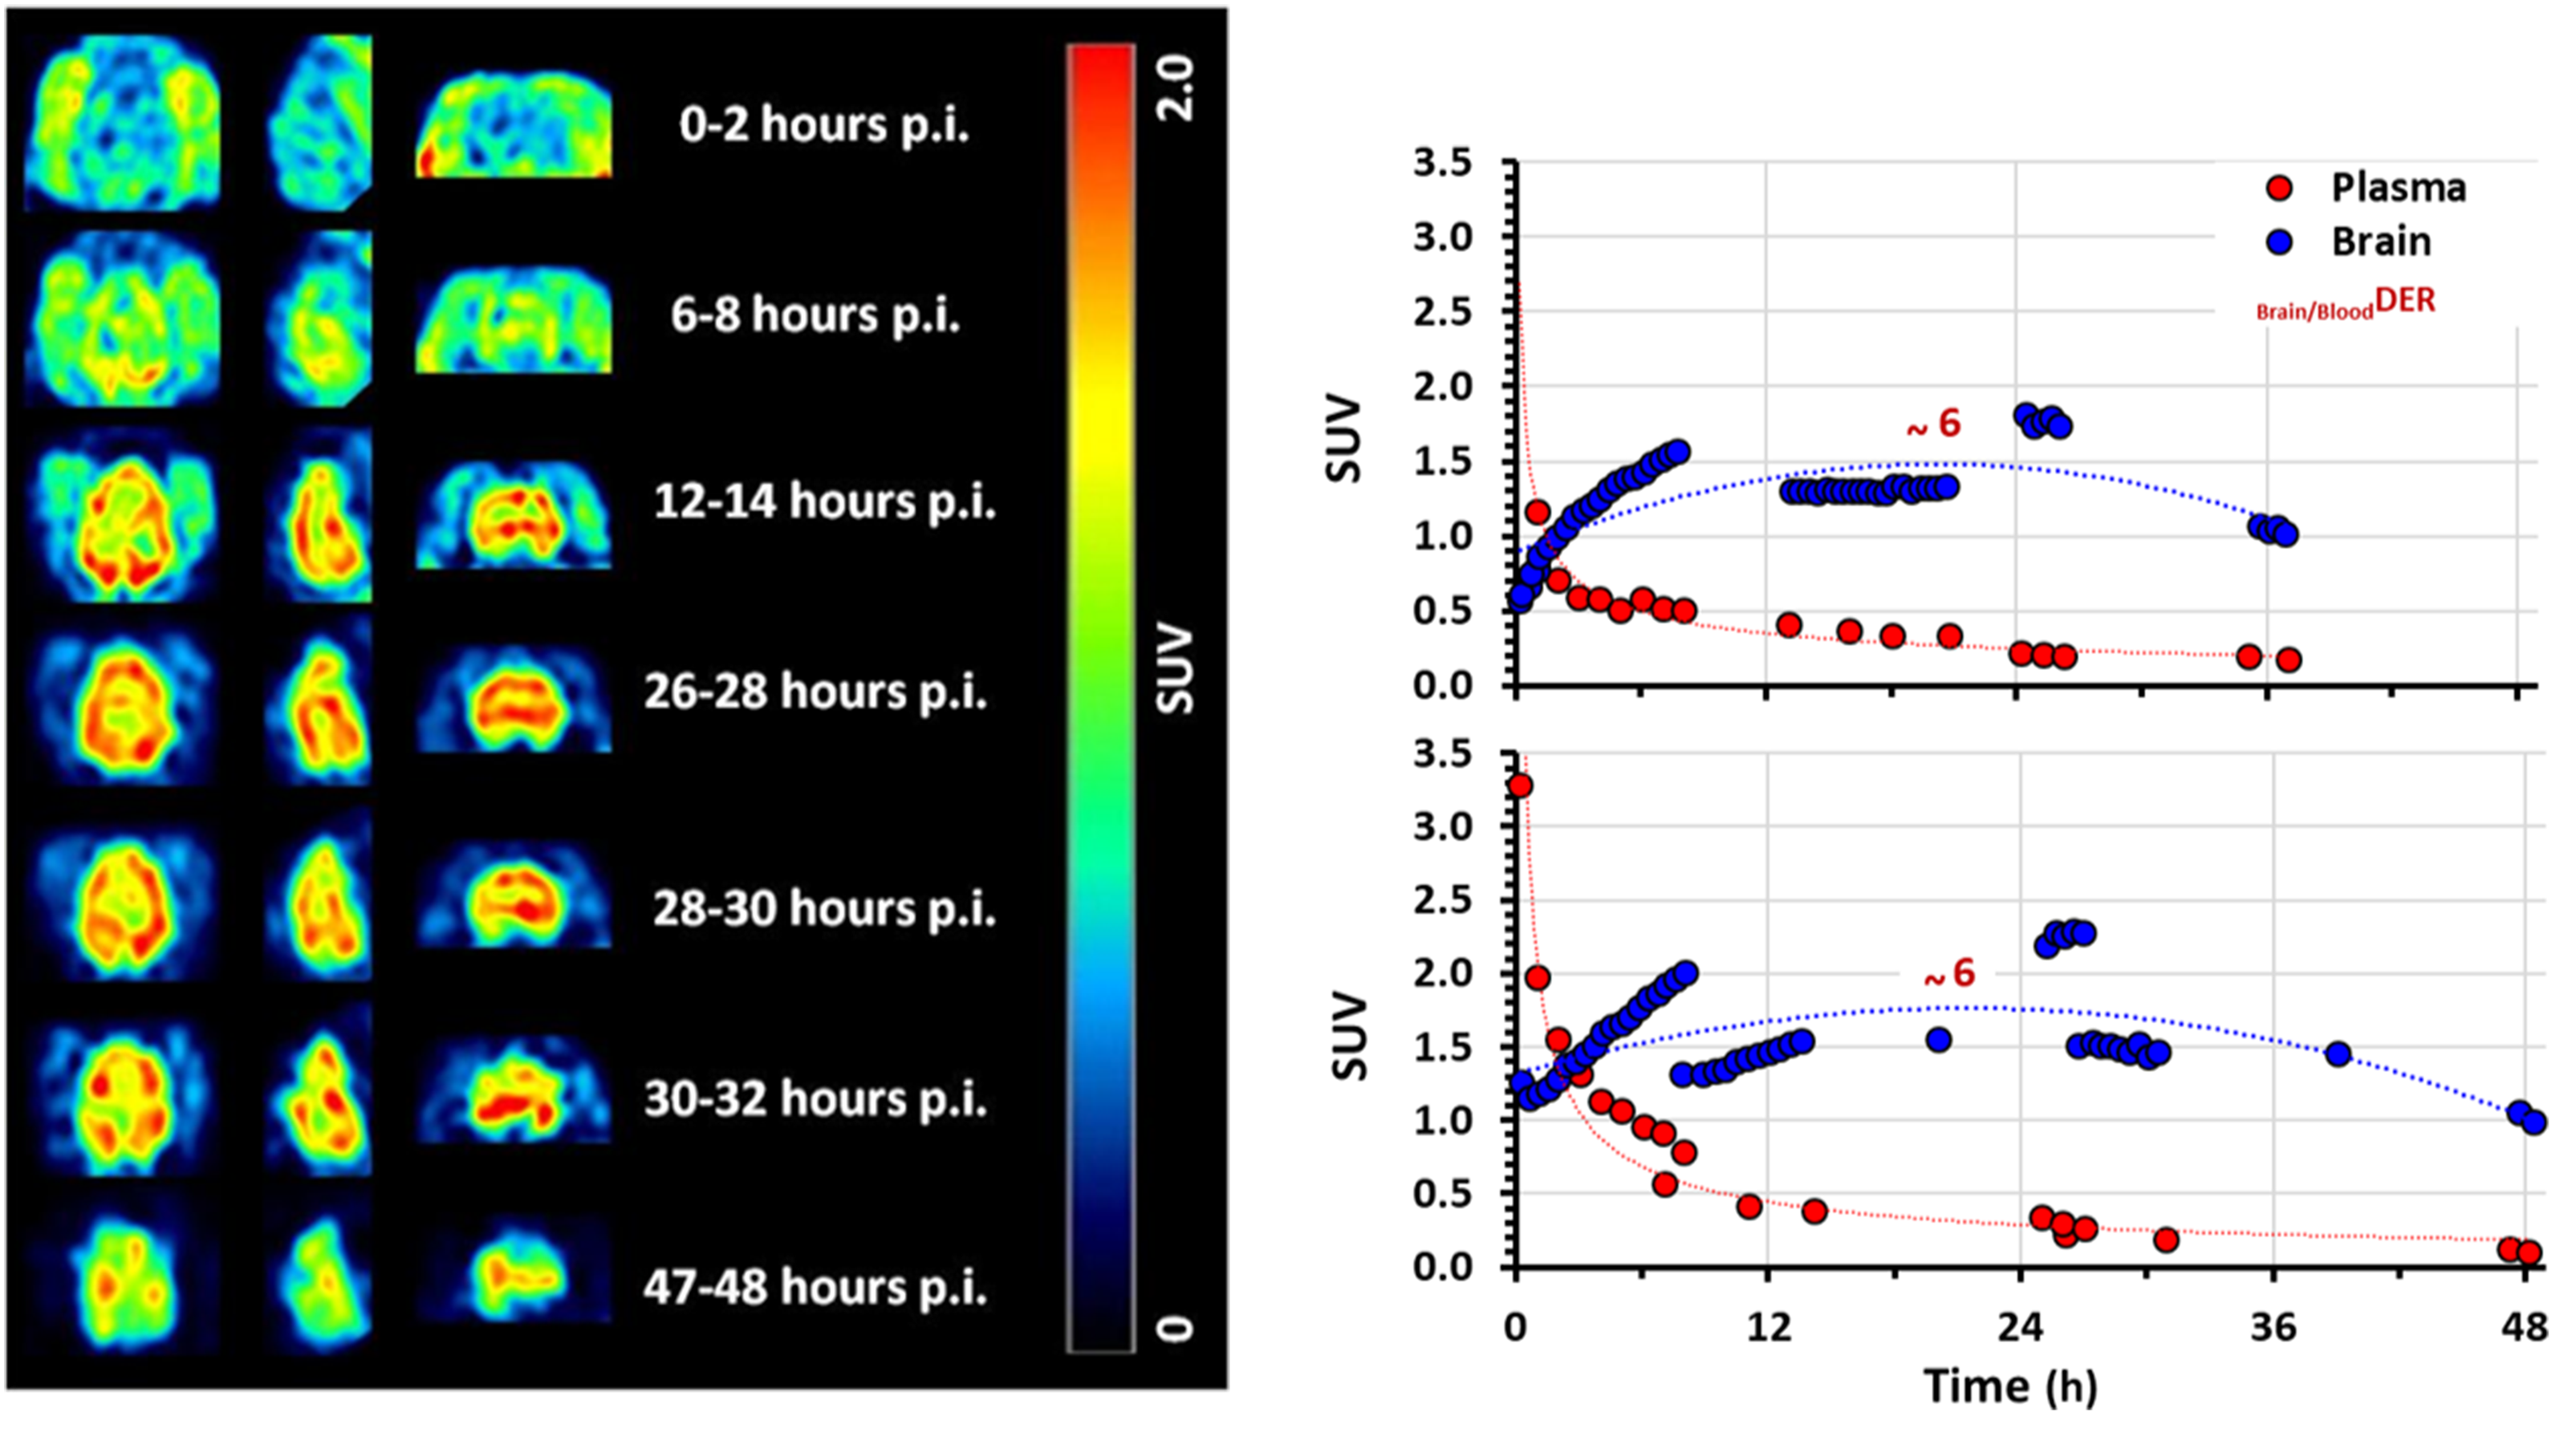
SPECT-imaging of the siponimod analog ([123I]MS565) in rhesus NHPs. In rhesus macaques (n = 2) that received one single intravenous bolus injection of 123I-radiolabeled analog of siponimod ([123I]MS565): (a) Representative examples of [123I]MS565 SPECT brain images over time (transverse, left; sagittal, middle; coronal, right). Increase in brain uptake is visible within 26–30 h post-injection, followed by a slow washout; (b) Decay-corrected time–activity curves (expressed as standard uptake value (SUV)) for the mean [123I]MS565 concentrations in both blood and brain tissues measured in both NHPs tested (RH8355 and RH8356). In both cases, washout of [123I]MS565 from the plasma started immediately upon injection and was nearly completed (>90%) within 24 h. In contrast, peak brain uptake occurred within 18–24 h post-injection, with a Brain/BloodDER of about 6 and followed by a slow decay. GM, gray matter; h, hour; MRI, magnetic resonance imaging; NHP, non-human primate; SPECT, Single Photon Emission Computed Tomography; SUV, standard uptake value.
To better analyze the distribution of [123I]MS565 within the different brain regions, SPECT and T1-weighted MRI images obtained over 7–48 h post-injection were merged (Figure 6(a)). This analysis suggested that a small fraction of [123I]MS565 reached the brain ventricles and that different uptake might exist between white and gray matter. The comparative dynamic uptake of [123I]MS565 for cortical gray matter and white matter is shown in Figure 6(b), together with a polynomial fit to the data from both animals. Hence, drug uptake (expressed as SUV) increased up to 18–20 h post-injection to reach up to ∼1.6 in gray matter versus 1.8 in white matter (0.011% vs 0.012% injected dose (ID)/mL, respectively), suggesting a 13% preference uptake for white matter. Washout of [123I]MS565 appeared faster in gray versus white matter, with SUV at 48 h post-injection reduced to ∼0.9 in gray matter and ∼1.25 in white matter (0.006% vs 0.008% ID/mL, respectively), suggesting a 39% preference residual uptake for white matter.
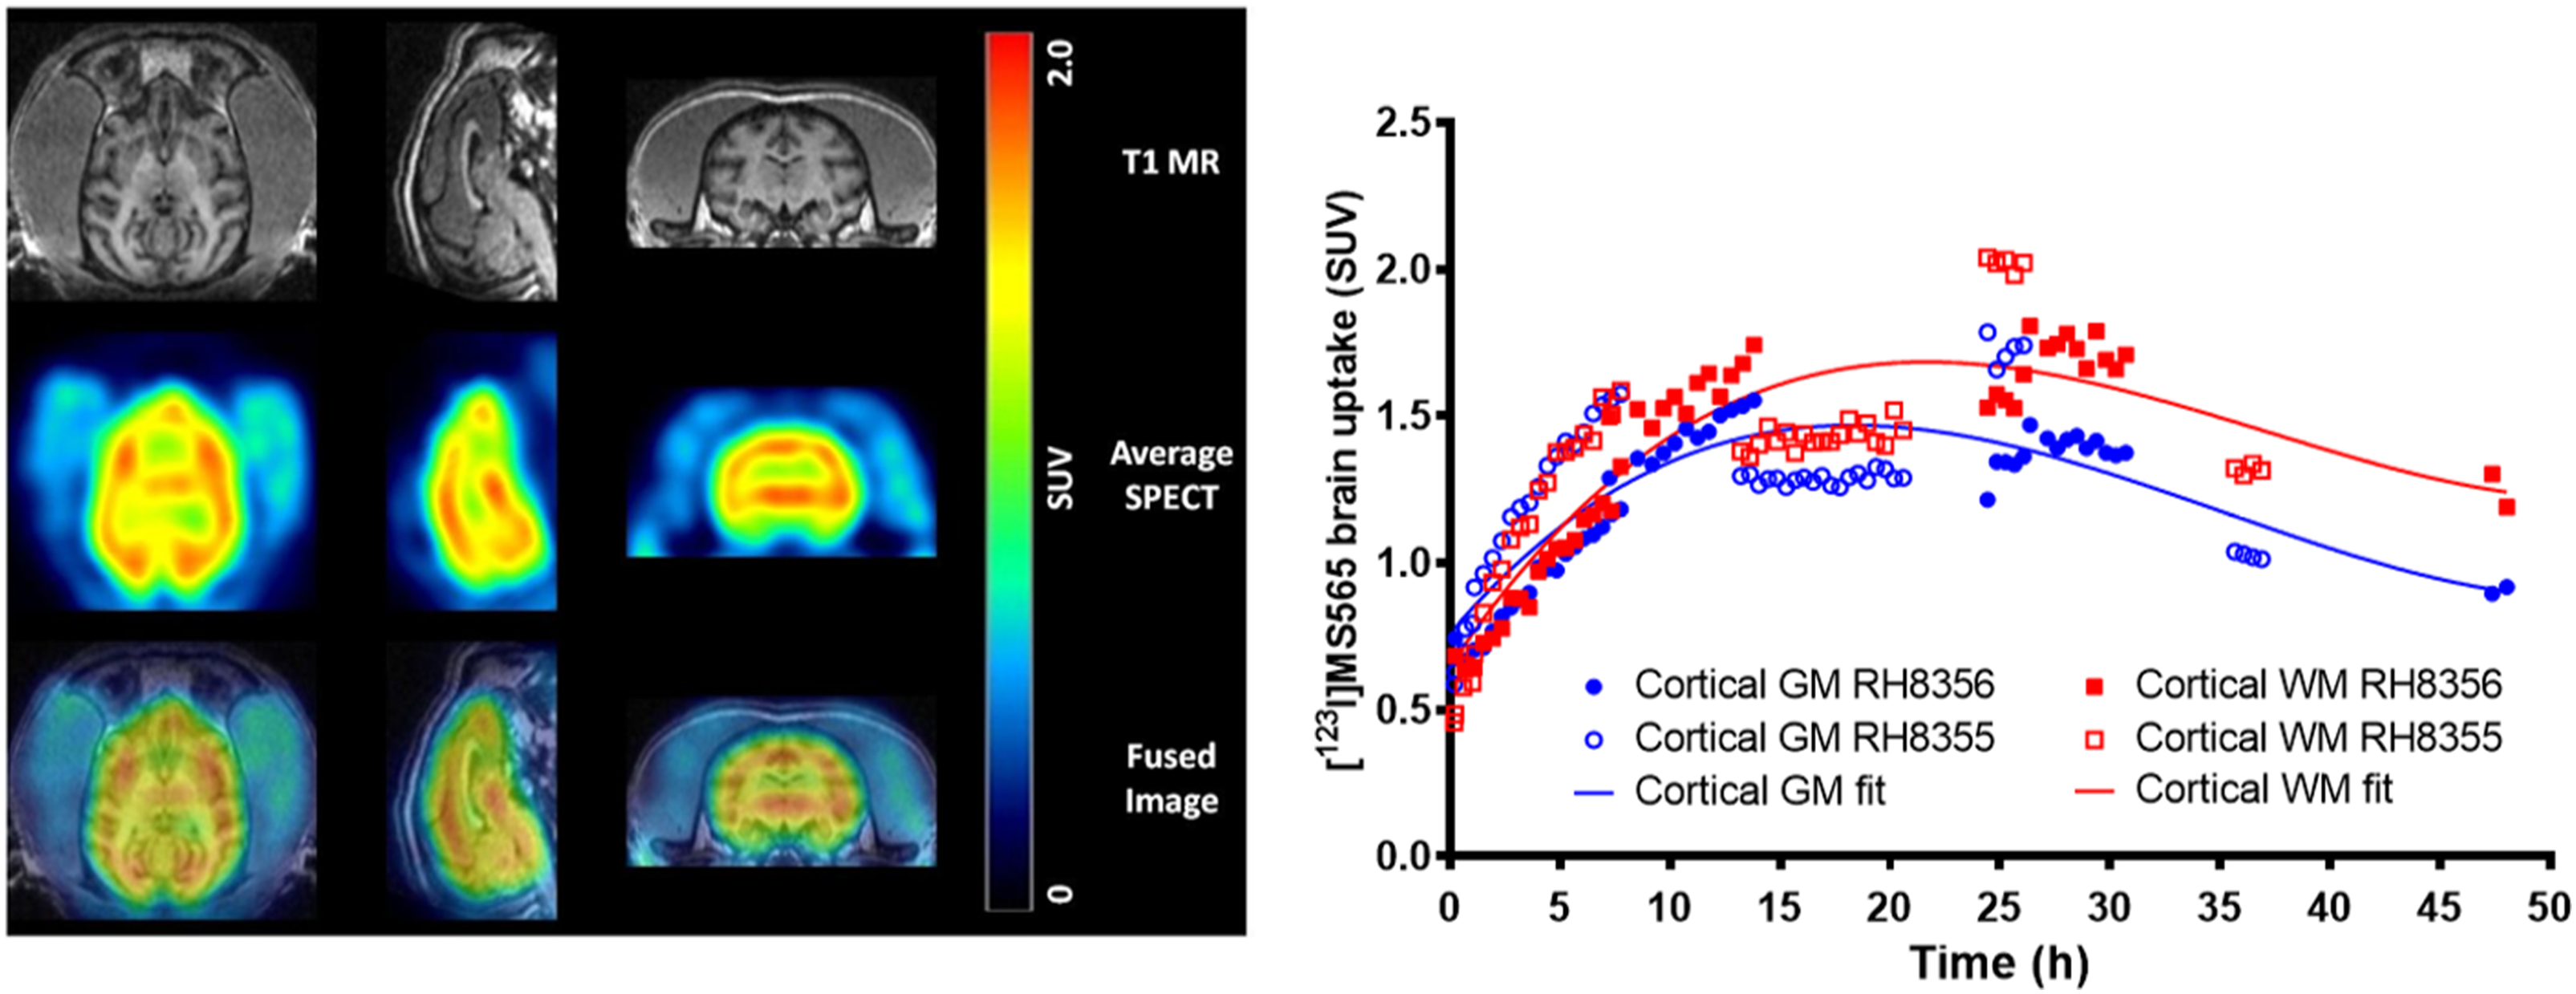
Uptake of [123I]MS565, an imaging siponimod analog in different brain regions. Rhesus macaques received a single intravenous bolus injection of [123I]MS565: (a) Representative example of an average SPECT image of NHP brain over 7–48 h post-injection fused with a T1-weighted MRI (MRI [top], [123I]MS565 SPECT brain average image [middle] and fused MRI-SPECT image [bottom]). Transverse images are left, sagittal images are middle, and coronal images are right; (b) Decay-corrected time–activity curves displaying an increase in the activity concentration of [123I]MS565 in the brain until ∼20 h after injection, followed by a faster washout in the gray matter (GM) versus white matter (WM). The solid line represents a polynomial fit. Closed symbols for NHP-RH8356 and open symbols for NHP-RH8355. GM, gray matter; MRI, magnetic resonance imaging; NHP, non-human primate; SUV, standard uptake value; WM, white matter.
Discussion
The aim of the present investigations was to generate preclinical insights concerning the CNS penetration, distribution, and activity of siponimod, thus, elucidating its direct pharmacological effects in the CNS to help explain its therapeutic benefit in SPMS. 3
The first compelling evidence on the central efficacy for S1P1 agonists, in addition to their inhibitory effects on lymphocyte trafficking, came from a study showing that fingolimod had lost therapeutic efficacy in an EAE model using conditional null mouse mutants lacking S1P1 receptors on astrocytes but not on lymphocytes. 22 Since then, observations accumulated supporting S1P1-dependent effects in the CNS for fingolimod, 23 as well as siponimod.4,6,14–16 The molecular events downstream of the S1P1 receptors remain to be fully understood as both S1P1 down-modulation and activation of signaling pathways involved in the regulation of astrocyte survival and proliferation have been described.16,24,25 Recently, siponimod was shown to induce, in human astroglial cells, an S1P1-dependent activation of the anti-oxidant/ anti-inflammatory/neuroprotective transcription factor Nrf2 in parallel to the blockade of the pro-inflammatory transcription factor NFκB. 26 Less is known about central S1P5-dependent effects on oligodendrocytes, although they were shown to be mainly pro-myelinating.6,15
Concerning CNS penetration of siponimod, previous preclinical studies in mice suggested that it could be achieved upon a single intravenous bolus application with, at ≤ 8 h post-dosing, a maximal blood exposure associated with a markedly higher (∼5 fold) drug levels in brain tissues. 17 The present study confirms these observations in healthy mice, rats and NHPs, strongly suggesting that the ability of siponimod to dose-dependently penetrate and distribute into the CNS compartment is preserved across species, with a Brain/BloodDER maintained within the range of 5–6, independently of the dose or regimen used.
In the mouse, siponimod treatments were applied via drug-loaded diet, as preliminary work indicated that it was a robust alternative to daily oral gavage for achieving efficacious siponimod blood exposures in chronic mouse disease models. 27 The present results clearly confirm that such a treatment can indeed achieve a dose-proportional increase in steady state siponimod blood levels and a dose-dependent pharmacological efficacy (reduction in circulating lymphocytes) with a maximal effect at a food-loading dose of 10 mg/kg. As expected, the same food-loading dose of 10 mg/kg was also found maximally efficacious in reducing the development EAE symptoms, further illustrating the relevance of EAE models as mechanistic tools for studying the anti-inflammatory/immunomodulatory effects of S1P modulators.10–13 Interestingly, for all siponimod doses tested in EAE mice, a Brain/BloodDER around 7 was measured, suggesting that the CNS penetration of siponimod is not subject to major changes during the development of the disease.
In the rat, a dose-proportional increase in siponimod blood levels could also be achieved via daily oral gavage with, as in mice, a brain/blood(DER) around 6 for all dose tested. Pharmacological efficacy in the CNS could be demonstrated by a dose-dependent reduction in S1P1 levels in brain tissues, in line with previous observations describing drug-induced S1P1 down-modulation in CNS-resident cells24,25,28 or brain tissues.29,30 For technical reasons, no benchmarking with other S1P receptors could be performed and follow up studies are therefore warranted. Available data however suggest that the S1P3, S1P4 and S1P5 receptors contrast vs S1P1 upon activation by fingolimod, with partial down-modulation for S1P3 29 and no down-modulation at all for S1P429,31 and S1P5.29,32 Such behaviors of S1P receptors in brain tissues are most likely not affected by the development of central inflammation, as suggested by studies showing that, although the S1P1 and S1P3 expressions are increased on astrocytes in MS and EAE lesions, they can be reduced by the administration of fingolimod.33,34 Confirmation would certainly be justified with the help of dedicated EAE studies. Concerning the distribution of siponimod throughout the rat CNS, it was assess via QWBA analysis which revealed a specific tissue distribution pattern of [14C]siponimod related radioactivity within the different CNS areas, with highest concentration of siponimod related radioactivity detected for the white matter of the cerebellum, corpus callosum, medulla oblongata and spinal cord, and twice as low levels in the olfactory bulb. These results, suggesting that the distribution of siponimod throughout the CNS is subject to marked regional selectivity, motivated follow up confirmatory studies in NHPs.
The clinical relevance of NHPs as a model to predict brain penetration and distribution of drugs in human has been well documented18,19 and SPECT imaging in NHPs was previously validated as a translational method to estimate brain penetration of fingolimod.35,36 Validation was performed using BZM055, a radiolabeled surrogate for fingolimod that demonstrated similar brain distribution patterns between NHPs and humans. The same approach was therefore followed for evaluating the brain penetration of siponimod in NHPs with [123I]MS565, previously validated as a reliable SPECT tracer for siponimod.17,20 SPECT results obtained in the present study indicate good brain penetration for siponimod in NHPs, with high levels versus other tissues surrounding the brain and with particularly high uptake in cortical and thalamic areas, a slight preference for white versus gray matter, and a quite residual appearance in CSF.
Taken together the present investigations demonstrate consistent brain penetration/ distribution for siponimod across species, which is suggestive of a high translational potential to human. Although this type of information is key to confirm that siponimod has the intrinsic properties to physically access CNS-resident cells expressing S1P1/S1P5 receptors, it is of semi-qualitative nature and, as such, does not by itself ascertain that local unbound siponimod levels would also reach the concentration range required for biological activity in humans. Additional quantitative imaging studies in humans, with evaluation of receptor occupancy would be an additional helpful next step to provide further evidence to that end.
Available pharmacological data, uncorrected for protein binding, indicate a potency for siponimod on S1P1/S1P5 receptors within the 1 nM range 5 and efficacy on cultured astrocytes or oligodendrocytes within the 10–100 nM range.14–16 Corrected values for the binding-to-brain tissues, as estimated for siponimod in the present study (>99.9%) and fully in line with >99.9% binding-to-plasma protein in human, 37 might project that unbound siponimod CNS levels within the 0.01–0.1 nM range could be needed for preclinical in vivo efficacy. Such a range was most likely reached in rats treated with siponimod at 3 and 1 mg/kg/day, as indicated by the drug levels measured in the CSF (∼6 and 0.2 nM, respectively), which can be considered as surrogate measurements for brain unbound drug concentrations. 21 Translation to humans is currently unclear as limited siponimod CSF information in human is at present available and would require dedicated studies using clinical imaging technologies. Of the 1651 patients enrolled in the EXPAND trial, 3 only nine (∼0.5%) accepted CSF sampling at end of treatment, five of whom could be confirmed as siponimod treated due to occurrence of siponimod (low nM range) in the CSF.
An intriguing observation from the present studies is that the Brain/BloodDER and Brain/PlasmaDER for siponimod were found to be ∼6 across the doses and species tested, suggesting persistence along evolution of the underlying mechanisms controlling siponimod's CNS penetration. Despite several investigations, no active transporter for siponimod has been identified as yet (unpublished in house observation), suggesting that its CNS penetration is driven by its high lipophilicity (logD7.4 = 2.6) 17 and passive membrane diffusion. In this case, the CNS penetration of siponimod is not expected to be markedly affected by the development of local inflammatory conditions, as supported by a Brain/BloodDER of ∼7 found in EAE mice. Although the consistency of Brain/BloodDER and Brain/PlasmaDER across doses and species for siponimod suggests a good translation to human, dedicated studies in healthy volunteers vs MS patients, using clinical imaging technologies, would be warranted to provide confirmation. Benchmarking to other S1P modulators would also clarify pharmacokinetic/pharmacodynamic relationships for different molecules from the same pharmacological class and the possible link between CNS penetration and central efficacy. Hence, available comparative data suggest that, although the CNS penetration for both fingolimod and its active phosphorylated metabolite are similar to siponimod in healthy rodents (with Brain/BloodDER ∼6), they increase by at least 3 fold during EAE development,38,39 in strong contrast to siponimod. For ozanimod, its CNS penetration is about twice as high vs siponimod and fingolimod in healthy rodents (CNS/BloodDER of 10–16) and the impact of EAE has not been described as yet. 40 Too high CNS levels might however be counterproductive for S1P modulators to achieve efficacy in the CNS compartment concomitantly to the periphery as recent observations suggest that S1P receptor-dependent central anti-inflammatory, neuroprotective, and/or pro-myelination effects are subject to a non-classical pharmacology, characterized by a loss of efficacy at supramaximal exposures (bell-shaped dose–response curves).41–44
Overall, these preclinical studies suggest a robust dose-proportional CNS penetration/distribution with central pharmacological efficacy for siponimod, with a high translational potential to human. The proportion between specific and unspecific binding to the CNS tissues remains to be established, as well as the pharmacokinetic profile of siponimod in the CNS versus blood. Follow-up preclinical and clinical studies will be helpful to identify the molecular mechanisms controlling siponimod CNS exposure and to fully understand how siponimod distributes within the CNS, in relation to its well-described pharmacodynamic effects (anti-inflammatory, neuroprotective, pro-myelination)6,14–16 at the level of CNS-resident cells.
Supplemental Material
sj-docx-1-mso-10.1177_20552173211049168 - Supplemental material for Siponimod (BAF312) penetrates, distributes, and acts in the central nervous system: Preclinical insights
Supplemental material, sj-docx-1-mso-10.1177_20552173211049168 for Siponimod (BAF312) penetrates, distributes, and acts in the central nervous system: Preclinical insights by Marc Bigaud, Bettina Rudolph, Emmanuelle Briard, Christian Beerli, Andreas Hofmann, Erwin Hermes, Florian Muellershausen, Anna Schubart and Anne Gardin in Multiple Sclerosis Journal – Experimental, Translational and Clinical
Footnotes
Acknowledgements
All authors met the International Committee of Medical Journal Editors (ICMJE) criteria for authorship for this manuscript, take responsibility for the integrity of the work as a whole, and have given final approval to the version to be published. All authors are responsible for intellectual content and data accuracy. We are grateful to Esther van de Kerkhof, Adriana Tavarez, Paul Maguire, Olivier Barret, Meike Lang, Lea Baumgartner, Pamela Ramseier, Sarah Tisserand, and Julien Perdoux for their expert technical support. We thank Swetha Sanugomula (Novartis Healthcare, Hyderabad, India) for providing medical writing support, which encompassed formatting of the manuscript content, referencing, tables and figures as per the journal guidelines, and incorporating the authors’ revisions and finalizing the draft for submission, all under the direction of the authors.
Declaration of conflicting interests
All authors are employees of Novartis and author(s) declared no potential conflicts of interest with respect to the research, authorship, and/or publication of this article
Funding
Novartis Pharma AG, Basel, Switzerland funded the study and medical writing support for the preparation of this manuscript.
Supplemental material
Supplemental material for this article is available online.
References
Supplementary Material
Please find the following supplemental material available below.
For Open Access articles published under a Creative Commons License, all supplemental material carries the same license as the article it is associated with.
For non-Open Access articles published, all supplemental material carries a non-exclusive license, and permission requests for re-use of supplemental material or any part of supplemental material shall be sent directly to the copyright owner as specified in the copyright notice associated with the article.