
Abstract
Background
Soluble triggering receptor expressed on myeloid cells-2 (sTREM-2) is a marker of macrophage and microglial activation and is increased in the cerebrospinal fluid (CSF) in multiple sclerosis (MS).
Objective
To determine the relationships among sTREM-2, T cell activation, neuroaxonal damage and clinical features of MS.
Methods
Enzyme-linked immunosorbent assays were used to measure the levels of sTREM-2, soluble CD27 (sCD27, a marker of T cell activation), neurofilament light chain (NfL) and phosphorylated neurofilament heavy chain (pNfH) in the CSF of 42 patients with MS (including nine with clinically isolated syndrome) and 15 patients with other neurological diseases (OND) and in the serum of 164 patients with MS, 87 patients with OND and 62 healthy controls.
Results
sTREM-2 was significantly elevated in the CSF (p = 0.012), but not in the serum, in MS compared to OND. In MS, CSF sTREM-2 correlated positively with CSF sCD27 (p = 0.005), CSF NfL (p = 0.0001), CSF pNfH (p = 0.0006), Expanded Disability Status Scale (EDSS) score (p = 0.0079) and MS Severity Score (MSSS) (p = 0.0006).
Conclusion
In MS the level of sTREM-2 in the CSF is related to measures of T cell activation (sCD27), neuroaxonal damage (NfL and pNfH), disability (EDSS) and disease severity (MSSS).
Keywords
Introduction
In conjunction with standard clinical cerebrospinal fluid analysis (CSF) and magnetic resonance imaging (MRI), measurement of biomarkers in multiple sclerosis (MS) could prove useful in diagnosis, management and prognostication. Investigation of the relationship between biomarkers and disease severity, as well as inter-biomarker correlations, could aid in the understanding of MS pathogenesis, provide insight into disease activity, and help to assess efficacy of clinical trial interventions.
MS is a chronic, inflammatory, demyelinating disease of the central nervous system (CNS). CNS injury via autoreactive immune cells is thought to lead to demyelination and axonal disruption. CNS demyelination in MS is associated with activated microglia 1 that contribute to disease pathogenesis. 2 Later in disease, microglial activation becomes associated with chronic neurodegeneration with neuroaxonal disruption.
As a specialized population of macrophage-like cells in the CNS, microglia are capable of orchestrating a potent inflammatory response. 3 Triggering receptor expressed on myeloid cells-2 (TREM-2) is a membrane-bound receptor predominantly expressed on newly differentiated and activated macrophages, including monocyte-derived dendritic cells, mast cells, osteoclasts, and microglia. 4 In the human brain, TREM-2 is expressed by macrophages 5 and microglia 6 but not by astrocytes or oligodendrocytes. 7 TREM-2 is involved in the phagocytosis of apoptotic neurons by microglia. 8 Furthermore, in experimental autoimmune encephalomyelitis, an animal model of MS, myeloid cells expressing TREM-2 are involved in the clearance of myelin debris and resolution of inflammation. 9 TREM-2 undergoes sequential proteolytic processing by ectodomain shedding which results in release of a soluble form (sTREM-2). 10 The level of sTREM-2 in the CSF is increased in MS and other inflammatory neurological diseases.5,11 sTREM-2 is now regarded as a biomarker of macrophage/microglial activation in the brain. 12
Multiple studies have shown critical roles for T cells and B cells in the pathogenesis of MS (reviewed by van Langelaar et al). 13 T cells activated via the T cell receptor and CD3 release soluble CD27 (sCD27). 14 CD27 and its soluble form, sCD27, are subsequently required for generation and maintenance of long term T cell memory and play a role in the activation and proliferation of B cells. 15 Although expressed by multiple cell types, sCD27 is only secreted in large quantities by activated T cells. 16 Elevated sCD27 levels in the CSF have been reported in MS and other inflammatory neurological diseases.16,17 As such, sCD27 has been proposed as a potential biomarker of direct T-cell-mediated inflammation in the CNS in MS. 16
In addition to CNS inflammation, neurodegeneration with axonal loss in the CNS is a key element of MS pathology. Accordingly, axonal components are of interest as potential biomarkers in MS. In particular, neurofilament light (NfL) and phosphorylated neurofilament heavy (pNfH), major cytoskeletal components of axons which play an important role in the growth and maintenance of large myelinated axons, have been widely studied in MS.18–21 NfL levels in the CSF of MS patients are associated with clinical 22 and radiological disease markers, 23 MS disease severity 24 and treatment response. 25 Serum NfL is increased in patients with MS compared to healthy controls 26 and correlates with Expanded Disability Status Scale (EDSS) score 27 and the presence of relapses. 28 Thus, NfL is an established biomarker of neuroaxonal damage in MS. CSF NfH correlates with relapses and with EDSS in patients with clinically isolated syndrome (CIS) and relapsing–remitting MS (RRMS) but not with EDSS score in patients with progressive MS. 22
The aim of the present study was to determine the relationships among markers of macrophage/microglial activation (sTREM-2), T cell activation (sCD27) and neuroaxonal damage (NfL and pNfH) and the clinical features of MS.
Materials and methods
Subjects
CSF was obtained with paired blood samples from nine patients with clinically isolated syndrome (CIS) and 33 patients with definite MS, including 10 with RRMS, 10 with secondary progressive MS (SPMS) and 13 with primary progressive MS (PPMS). CSF was also collected with paired blood samples from 15 patients with neurological diseases other than MS (other neurological diseases; OND) including 11 with CNS disease, 3 with a peripheral nervous system (PNS) disease and 1 with mixed CNS and PNS disease. Four OND patients had inflammatory diseases, 10 had non-inflammatory diseases and one patient’s inflammatory disease status was not determined.
Serum samples were obtained from 62 healthy controls (HC), and 141 patients with definite MS including 55 with RRMS, 44 with SPMS and 42 with PPMS. In addition, serum was obtained from 23 patients with CIS. Serum was also collected from 87 patients with OND including 69 (79.3%) with CNS disease, 16 (18.3%) with a peripheral nervous system (PNS) disease and 2 with mixed CNS and PNS disease. Eight OND patients had inflammatory diseases (9.1%) and 78 had non-inflammatory diseases (89.6%). One patient’s inflammatory disease status was not determined. Demographic details of patients and controls are displayed in Table 1.
Demographics and clinical characteristics of study populations.
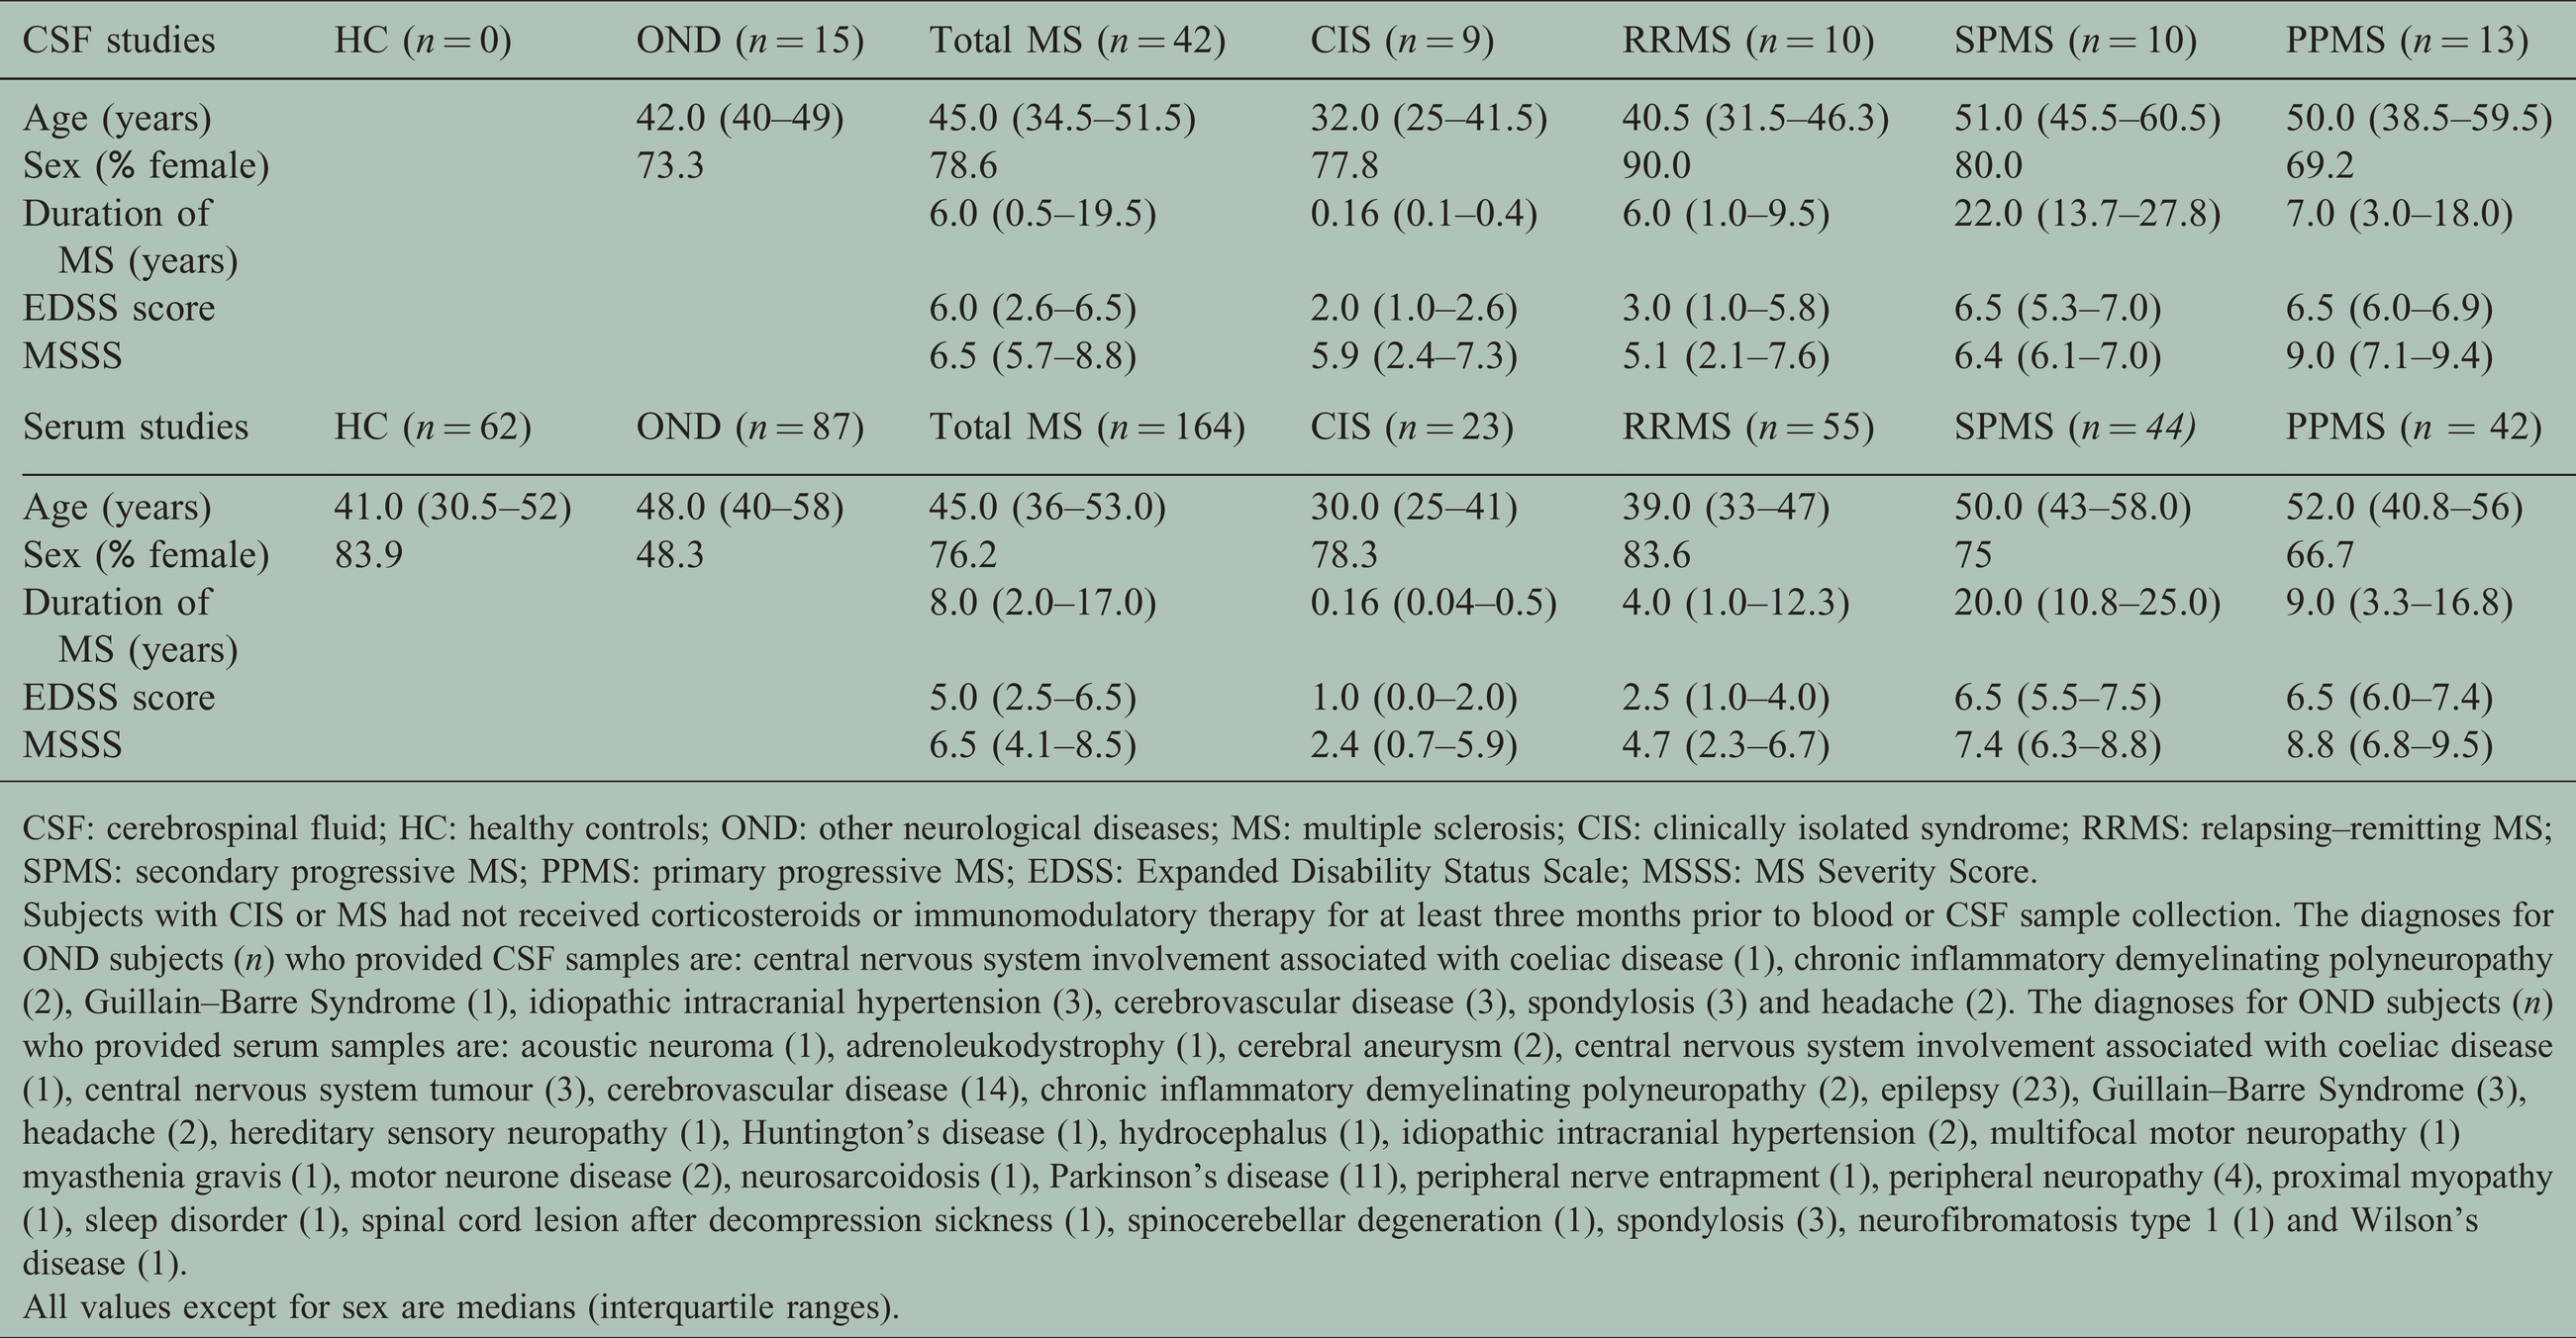
CSF: cerebrospinal fluid; HC: healthy controls; OND: other neurological diseases; MS: multiple sclerosis; CIS: clinically isolated syndrome; RRMS: relapsing–remitting MS; SPMS: secondary progressive MS; PPMS: primary progressive MS; EDSS: Expanded Disability Status Scale; MSSS: MS Severity Score.
Subjects with CIS or MS had not received corticosteroids or immunomodulatory therapy for at least three months prior to blood or CSF sample collection. The diagnoses for OND subjects (n) who provided CSF samples are: central nervous system involvement associated with coeliac disease (1), chronic inflammatory demyelinating polyneuropathy (2), Guillain–Barre Syndrome (1), idiopathic intracranial hypertension (3), cerebrovascular disease (3), spondylosis (3) and headache (2). The diagnoses for OND subjects (n) who provided serum samples are: acoustic neuroma (1), adrenoleukodystrophy (1), cerebral aneurysm (2), central nervous system involvement associated with coeliac disease (1), central nervous system tumour (3), cerebrovascular disease (14), chronic inflammatory demyelinating polyneuropathy (2), epilepsy (23), Guillain–Barre Syndrome (3), headache (2), hereditary sensory neuropathy (1), Huntington’s disease (1), hydrocephalus (1), idiopathic intracranial hypertension (2), multifocal motor neuropathy (1) myasthenia gravis (1), motor neurone disease (2), neurosarcoidosis (1), Parkinson’s disease (11), peripheral nerve entrapment (1), peripheral neuropathy (4), proximal myopathy (1), sleep disorder (1), spinal cord lesion after decompression sickness (1), spinocerebellar degeneration (1), spondylosis (3), neurofibromatosis type 1 (1) and Wilson’s disease (1).
All values except for sex are medians (interquartile ranges).
All patients with RRMS, SPMS and PPMS met the 2005 29 and/or the 2010 Revised McDonald Criteria for a diagnosis of MS. 30 The patients with CIS or MS had not received corticosteroids or immunomodulatory therapy for at least three months prior to blood or CSF sample collection. Detailed clinical information was collected on all patients including age, disease duration, EDSS 31 and the MS Severity Score (MSSS) 32 (Table 1). CIS patients were included in the total MS group in order to include patients in the early stages of MS. Informed consent was obtained from all participants and ethical approval was gained from The University of Queensland and the Royal Brisbane and Women’s Hospital (RBWH) Ethics committees.
Samples
Biochemical analyses were performed at The University of Queensland Centre for Clinical Research in Brisbane and the pathology laboratory at RBWH, Brisbane, Australia. Serum and CSF samples were centrifuged at 800 g, aliquoted and frozen at –80°C. Plasma samples were collected from the upper layer of Ficoll®-Paque density centrifugation gradients used to isolate peripheral blood mononuclear cells. These samples were also frozen at –80°C. Repetitive freeze-thawing of samples was avoided.
Commercially available enzyme-linked immunosorbent assays (ELISA) were used to measure soluble biomarkers in serum and CSF samples. Serum and CSF samples were assayed for sTREM-2 using human TREM-2 DuoSet® ELISA (Cat DY1825-05), and for sCD27 using human sCD27 DuoSet® ELISA (Cat. DY382-05). Both kits were obtained from R&D Systems (Minneapolis, Minnesota, USA). For assays of NfL and NfH, serum, plasma and CSF samples were supplemented with 200 μg/ml Heteroblock® (Omega Biologicals, Bozeman, MT, USA) before testing to counteract the effect of any heterophilic antibody present in test samples. Serum and CSF NfL was assayed using an Abbexa abx152468 ELISA, and serum pNfH was assayed using Abbexa abx352353 ELISA (Abbexa, Cambridge, UK). CSF pNfH concentrations were tested using an ELISA from Euroimmun (Euroimmun cat. EQ6562-9601, Lubeck, Germany) as the Abbexa pNfH assay used for serum assay was not sensitive enough to detect pNfH in CSF samples.
All ELISA were conducted according to the manufacturer’s instructions. For all assays sigmoidal four parameter logistic regression standard curves were created, and serum and CSF samples concentrations were extrapolated from these curves using GraphPad Prism 8.0.1.
CSF white cell count (WCC) and CSF immunoglobulin G (IgG) studies were determined by Pathology Queensland, RBWH. Three measures of intrathecal antibody production were determined; CSF IgG index (CSF IgG/CSF albumin)/(serum IgG/serum albumin); IgG(loc) 33 and IGGPROD. 34
Statistical analysis
Statistical analyses were performed using GraphPad Prism version 8.0.1 (GraphPad Software Inc, San Diego, CA, USA). Biomarker concentration data was found to be non-normally distributed using the Kolmogorov–Smirnov test; therefore data is presented as medians with interquartile ranges (IQR). CIS patients were included in the total MS group in order to include patients in the early stages of MS. The Mann–Whitney rank sum test was used for single comparisons between the total group of MS patients and HC, and between the total group of MS patients and OND patients. To compare data for MS subtypes with that of HC or OND patients, the Kruskal–Wallis non-parametric one-way ANOVA with Dunn’s multiple comparison test to correct for multiple comparisons was used. For correlations among biomarkers and for correlations between biomarkers and age, disease duration, EDSS score, MSSS and CSF WCC, either the Pearson (p) or the Spearman (s) rank correlation was used, according to the distribution of the data. For these correlations the total MS patient group included CIS, RRMS SPMS and PPMS patients. Tests with p ≤ 0.05 were considered statistically significant. Correlation p values were verified for significance using a false discovery rate (FDR) procedure (rate set as 0.05) for multiple correlations. 35
Results
Demographics
The study groups for CSF data were matched for age and sex distribution. For the serum data, the MS and HC study groups were matched for age and sex distribution; however, the subjects in the MS group were younger with a higher proportion of females than in the OND group.
CSF biomarker results
CSF biomarkers in MS compared to OND patients
The CSF biomarker results are presented in Table 2 and Figure 1(a) to (d). The CSF sTREM-2 in the total MS population was significantly higher than in OND [p = 0.012; Figure 1(a)]. A significant difference was also observed between CSF sTREM-2 of PPMS patients and OND patients (p = 0.0003, Table 2). The CSF sCD27 in the total MS population was significantly higher than in OND patients [p < 0.0001, Figure 1(b)]. A significant difference was also observed when CSF sCD27 levels of RRMS and PPMS subgroups were compared to that of OND patients (p = 0.0002 and 0.0007 respectively, Table 2). There were no significant differences between the CSF NfL or CSF pNfH when the total MS population or MS subgroups were compared to OND patients (Figure 1(c) and (d) and Table 2).
CSF biomarker concentrations.

CSF: cerebrospinal fluid; OND: other neurological diseases; MS: multiple sclerosis; CIS: clinically isolated syndrome; RRMS: relapsing–remitting MS; SPMS: secondary progressive MS; PPMS: primary progressive MS; sTREM-2: soluble triggering receptor expressed on myeloid cells-2; sCD27: soluble CD27; NfL: neurofilament light chain; pNfH: phosphorylated neurofilament heavy chain.
All concentrations are presented as medians (interquartile ranges). Mann–Whitney (mw) and Kruskal–Wallis (kw) ANOVA with Dunn’s correction for multiple comparisons p values are shown. Significant p values are shown in bold.

Concentrations (pg/ml) of (a, e) soluble triggering receptor expressed on myeloid cells-2 (sTREM-2), (b, f) soluble CD27 (sCD27), (c, g) neurofilament light chain (NfL) and (d, h) phosphorylated neurofilament heavy chain (pNfH) in (a–d) CSF and (e–h) serum of healthy controls (HC), patients with other neurological diseases (OND) and multiple sclerosis (MS) patients. The MS group includes patients with clinically isolated syndrome, relapsing–remitting MS, secondary progressive MS and primary progressive MS. Medians with interquartile ranges are shown. Mann–Whitney p values are shown in each panel for comparisons between groups.
Correlations among CSF biomarkers
The correlations among the CSF biomarkers are shown in Table 3 and Figure 2(a) to (d). CSF sTREM-2 in MS positively correlated with CSF sCD27 [p = 0.005, Figure 2(a)], CSF NfL [p = 0.0001, Figure 2(b)] and CSF pNfH [p = 0.0006, Figure 2(c)]. CSF sCD27 in MS patients positively correlated with CSF WCC [p = 0.036, Figure 2(d)]. CSF NfL positively correlated with CSF pNfH (p = 0.0024). All significant correlations among the CSF biomarkers in MS patients remained significant when corrected using a FDR procedure for multiple correlations.
Correlations among CSF biomarkers and correlations among serum biomarkers.

CSF: cerebrospinal fluid; OND: other neurological diseases; MS: multiple sclerosis; HC: healthy controls; sTREM-2: soluble triggering receptor expressed on myeloid cells-2; sCD27: soluble CD27; NfL: neurofilament light chain; pNfH: phosphorylated neurofilament heavy chain.
Pearson (p) or Spearman rank (s) correlation p values are shown, with corresponding rp or rs values for p values ≤0.05. Significant p values are shown in bold. The p values that remain significant after a false discovery rate (rate set as 0.05) correction for multiple correlations are denoted by an asterisk.

Correlations in total group of MS patients between CSF concentration of soluble triggering receptor expressed on myeloid cells-2 (sTREM-2) and (a) log CSF soluble CD27 (sCD27) concentration; (b) CSF neurofilament light chain (NfL) concentration; (c) CSF phosphorylated neurofilament heavy chain (pNfH) concentration; (e) Expanded Disability Status Scale (EDSS) score; and (f) MS Severity Score (MSSS); (d) Correlation between log CSF sCD27 concentration and CSF white cell count (WCC). Spearman rank (s) or Pearson (p) correlation p values are shown with the corresponding correlation co-efficient (rs or rp).
Correlations between CSF biomarkers and clinical characteristics
Correlations between CSF biomarkers and clinical characteristics are presented in Table 4 and Figure 2(e) to (f). CSF sTREM-2 in MS patients positively correlated with EDSS [p = 0.0079, Figure 2(e)] and MSSS [p = 0.0006, Figure 2(f)]. CSF NfL in MS patients positively correlated with age (p = 0.015), disease duration (p = 0.0307) and EDSS (p = 0.0090); however, when corrected for multiple correlations using a FDR procedure only the last remained significant (Table 4). CSF pNfH in MS patients did not correlate with age, disease duration or MSSS when corrected for multiple correlations; however, it did positively correlate with EDSS (p = 0.0174). In OND patients there were no significant correlations between CSF biomarkers and age.
Correlations of CSF and serum biomarker concentrations with age and clinical characteristics.

HC: healthy controls; OND: other neurological diseases; MS: multiple sclerosis; EDSS: Expanded Disability Status Scale; MSSS: MS Severity Score; CSF: cerebrospinal fluid; sTREM-2: soluble triggering receptor expressed on myeloid cells-2; sCD27: soluble CD27; NfL: neurofilament light chain; pNfH: phosphorylated neurofilament heavy chain.
Pearson (p) or Spearman Rank (s) correlation p values are shown, with corresponding rp or rs values for p values ≤0.05. Significant p values are shown in bold. The p values that remain significant after a false discovery rate (rate set as 0.05) correction for multiple correlations are denoted by an asterisk.
Correlations between CSF biomarkers and intrathecal IgG synthesis in MS
In MS, CSF sCD27 positively correlated with all 3 measures of intrathecal IgG: CSF IgG index (n = 38, ps = 0.0001, rs = 0.578), IgG(loc) (n = 32, ps = 0.0002, rs = 0.621) and IGGPROD (n = 32, ps < 0.0001, rs = 0.796). There were no significant correlations between any of the 3 measures of intrathecal IgG when compared to CSF sTREM-2 or CSF NfL. CSF pNfH correlated significantly with CSF IGGPROD (n = 33, ps = 0.0203, rs = 0.402) but not with CSF IgG index or IgG(loc).
Serum biomarker results
Serum biomarkers in MS, HC and OND patients
The serum biomarker results are presented in Table 5 and Figure 1(e) to (h). Serum sTREM-2 in MS patients was significantly higher than in HC (p = 0.0147) but not OND patients. There were no significant differences in serum sCD27 in MS patients when compared to HC or OND patients. In MS patients, serum NfL was significantly higher than in HC (p = 0.0001), but lower than in OND patients (p < 0.0001). Serum pNfH in MS patients was not significantly different from that in HC.
Serum biomarker results.
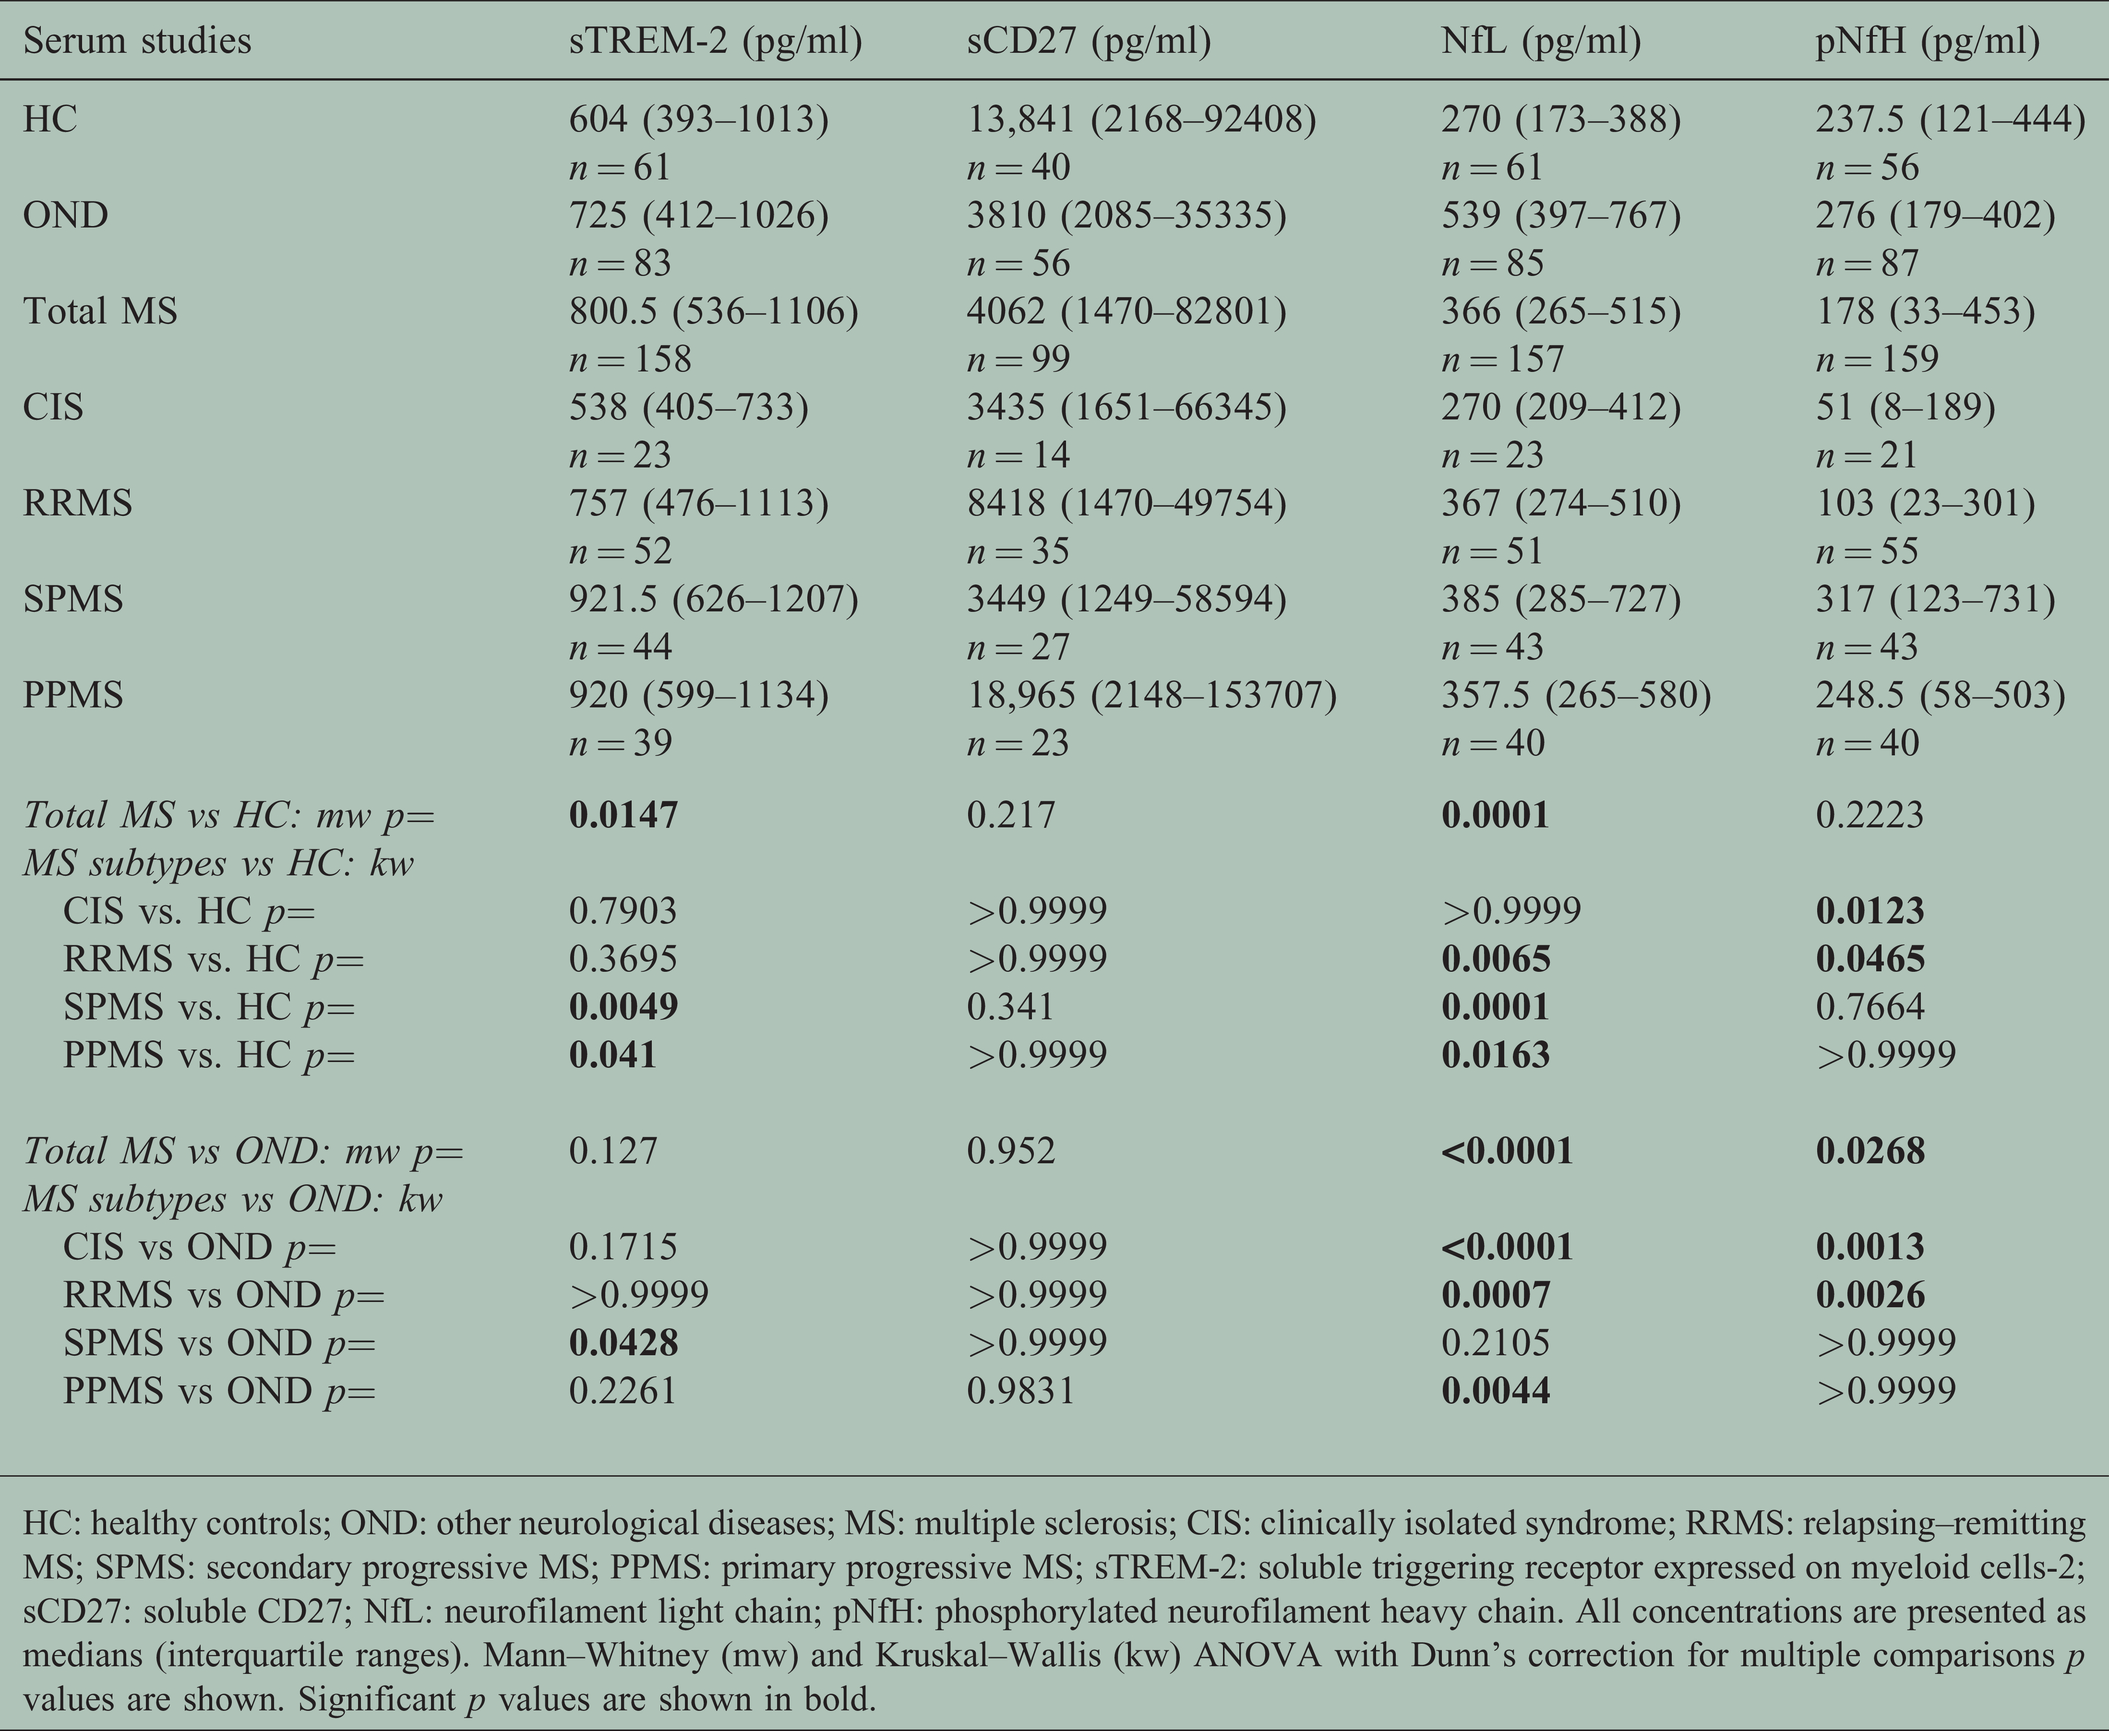
HC: healthy controls; OND: other neurological diseases; MS: multiple sclerosis; CIS: clinically isolated syndrome; RRMS: relapsing–remitting MS; SPMS: secondary progressive MS; PPMS: primary progressive MS; sTREM-2: soluble triggering receptor expressed on myeloid cells-2; sCD27: soluble CD27; NfL: neurofilament light chain; pNfH: phosphorylated neurofilament heavy chain. All concentrations are presented as medians (interquartile ranges). Mann–Whitney (mw) and Kruskal–Wallis (kw) ANOVA with Dunn’s correction for multiple comparisons p values are shown. Significant p values are shown in bold.
Correlations among serum biomarkers
The correlations among serum biomarkers are presented in Table 3. In MS patients, serum sTREM-2 correlated significantly with serum NfL (ps < 0.0001, rs = 0.428) and serum pNfH (p = 0 < 0.0001, rs = 0.318).
Correlations between serum biomarkers and clinical characteristics
Table 4 presents the correlations between serum biomarkers and clinical characteristics. Serum sTREM-2 in MS patients, OND patients and HC positively correlated with age (p < 0.0001, p = 0.0185 and p < 0.0001, respectively). Serum sTREM-2 levels in MS also positively correlated with disease duration (p < 0.0001). There were no significant correlations between MS patient serum sCD27 and age, disease duration, EDSS or MSSS. Serum NfL correlated positively with age in MS patients (p = 0.0023) and OND patients (p = 0.0073) but not in HC. Serum pNfH correlated positively with age in MS patients, OND patients and HC (p = 0.0007, 0.0055 and 0.0313 respectively). In MS patients, serum pNfH also correlated positively with disease duration (p = 0.0103) and EDSS (p = 0.0108).
Discussion
In this study, we investigated four soluble biomarkers of MS in healthy controls, MS patients and patients with OND. We examined CSF and serum levels of sTREM-2 as a marker for macrophage/microglial activation, sCD27 as a marker for T cell activation, and two markers of neuroaxonal degeneration, NfL and pNfH. We found that sTREM-2 was significantly elevated in the CSF in patients with MS compared to patients with OND. Our novel findings are that in MS, but not OND, CSF sTREM-2 correlated positively with CSF sCD27, CSF NfL and CSF pNfH. Moreover, in patients with MS, CSF sTREM-2 also correlated with EDSS score and MSSS which, to our knowledge, has not been reported previously. Interestingly, CSF sTREM-2 was highest in PPMS.
The level of sCD27 in the CSF was significantly higher in patients with MS than in patients with OND, as previously reported.16,17,36 The level of sCD27 in the CSF in MS significantly correlated with the CSF WCC, as previously reported. 17 Soluble CD27 closely correlates with the absolute number of CSF T cells and is therefore an excellent biological marker of intrathecal T cell activation. 16 The normalization of CSF sTREM-2 levels in MS after treatment with natalizumab, 11 which blocks T cell entry into the CNS, indicates that the correlation between CSF sTREM-2 and CSF sCD27 in MS in our study is due to the activation of macrophages/microglia by T cells rather than vice versa. T cells might activate macrophages and microglia directly through cytokine production or indirectly by inducing CNS tissue damage, which then activates macrophages and microglia.
In our study, CSF sTREM-2 correlated with EDSS and MSSS, which was not observed by Piccio and colleagues. 5 This might be due to differences in the disease course of the patients studied; unlike the study of Piccio et al, our study included patients with CIS and SPMS. Furthermore, there was a higher proportion of progressive MS subjects in our patient population; in our study 56% of MS patients had progressive disease compared to 29% in the study of Piccio and colleagues.
Interestingly, CSF sCD27 also positively correlated with the IgG index, as previously reported 17 and with other measures of intrathecal IgG production. This might be due to the helper T cell function of activated T cells and/or the antigen-presenting capacity of intrathecal B cells. In contrast to the finding of Romme Christensen 37 we found no correlation between CSF sCD27 and NfL in MS patients.
A key question is whether the macrophage/microglial activation reflected by sTREM-2 in the CSF causes the neuroaxonal injury reflected by NfL and pNfH or whether the macrophage/microglial activation is a response to the neuroaxonal injury. In human immunodeficiency virus-1 infection, CSF sTREM-2 correlates with CSF NfL, which has been interpreted as indicating that macrophage and microglial activation contribute to neuroaxonal injury. 38 On the other hand, elevated CSF sTREM-2 in early Alzheimer’s disease correlates with markers of neuronal degeneration and tau pathology and has been considered as probably reflecting microglial activation in response to neuronal degeneration. 39 In MS, the correlation we observed between CSF sTREM-2 and NfL might indicate that macrophage/microglial activation causes neuroaxonal injury; alternatively, macrophage/microglial activation might be a reparative response to neuroaxonal injury caused by other immune-mediated mechanisms. It has also been suggested that sTREM-2 in the CSF in MS might inhibit the anti-inflammatory function of membrane-bound TREM-2. 5
A novel observation in our study is that of higher levels of CSF sTREM-2 in PPMS compared to OND and all other subtypes of MS. Although there are few pathological studies comparing the inflammatory components of MS lesions in different subtypes of MS, one detailed analysis of global brain pathology in MS reported differences between MS subtypes in the normal-appearing white matter and the cortex. 40 This study showed that there was a mild, but diffuse inflammatory reaction in the normal-appearing white matter of patients with progressive forms of MS, which was significantly less pronounced in patients with acute and relapsing MS. Importantly, this diffuse inflammatory reaction consisted of perivascular cuffs of mononuclear cells with profound microglial activation and the formation of microglial nodules associated with T cell infiltration. Microglial nodules were significantly more frequent in the normal-appearing white matter of patients with progressive MS compared with patients with acute or relapsing disease. Therefore, microglial release of sTREM-2 in the CSF could be higher in PPMS compared to other MS subtypes owing to more pronounced microglial activation in the brain.
In contrast to the CSF findings and, as previously reported by Piccio and colleagues, 5 the serum level of sTREM-2 in MS patients was not significantly different from that in OND patients, although it was significantly higher than in healthy controls. Serum NfL was increased in patients with MS compared to healthy controls, as previously reported. 28 Serum sTREM-2 correlated positively with age in MS patients, healthy controls and OND patients. The positive correlations of serum sTREM-2 with serum NfL and serum pNfH that we observed in MS are likely to be largely influenced by the positive correlations of serum NfL and serum pNfH, like sTREM-2, with age. Similarly, the positive correlation between serum sTREM-2 and EDSS in MS can be explained by the stronger correlation of sTREM-2 and age and the close relationship between age and EDSS.
Our study has limitations. We did not have CSF samples from sufficient numbers of patients with the different subtypes of MS to allow comparisons among the subtypes. In order to measure NfL we used a commercially available ELISA and not the single-molecule array (Simoa) method, which is more sensitive than ELISA. 21 Different ELISAs use matched antibody pairs of differing specificities and fluctuate in terms of sensitivity to the measured analyte. We used the same assay to measure samples from each of the subject groups which enabled comparative analysis.
In conclusion, we found that in MS the level of sTREM-2 in the CSF is related to measures of T cell activation (sCD27), neuroaxonal damage (NfL and pNfH), disability (EDSS) and disease severity (MSSS). Our novel finding of correlations between CSF sTREM-2 and clinical disability and disease severity in MS suggests that measurement of CSF sTREM-2 might be useful in monitoring disease progression and response to therapy in clinical trial settings. An important goal of future studies should be to determine whether sTREM-2, or the macrophage/microglial activation it indicates, causes CNS damage or whether CNS damage leads to macrophage/microglial activation and increased production of sTREM-2.
Footnotes
Acknowledgements
We are grateful to Dr Stefan Blum, Kaye Hooper and Bernie Gazzard (deceased) for assistance in the collection of blood samples.
Conflict of Interests
The author(s) declared the following potential conflicts of interest with respect to the research, authorship, and/or publication of this article: ZAI, PAC, AS and MPP declare no conflicts of interest. PF is a former employee and stockholder of Atara Biotherapeutics Inc. BTA is an employee of and holds stock and related patents associated with Atara Biotherapeutics, Inc.
Funding
The author(s) disclosed receipt of the following financial support for the research, authorship, and/or publication of this article: This study was supported by research grants from Atara Biotherapeutics and MS Queensland.