
Abstract
Objective
The current diagnosis of intellectual disability (ID) in children relies on resource-intensive assessments by experts, limiting their use for widespread estimation. Eye-tracking offers a potential digital biomarker, but its application to the multifaceted cognitive profile of ID remains scarce. This study aimed to develop and validate a novel eye-tracking assessment combined with deep learning as an automated tool for estimating cognitive capacity of ID.
Methods
We developed three cognitive subtasks to elicit spatio-temporal gaze patterns related to three subindices including verbal comprehension (VCI), fluid reasoning (FRI), and working memory (WMI). With data collected from seven children with ID and nine typically developing (TD) children, we compared a logistic regression (LR) model using predefined gaze metrics and behavioral features with a convolutional neural network (CNN) trained directly on raw scanpath images to classify participants.
Results
The CNN model demonstrated superior performance, achieving a 0.93 F1-score in subject-level classification, while the feature-based LR model achieved a 0.76 F1-score. Notably, the CNN predictions derived from the working memory task significantly correlated with full-scale IQ as well as FRI and visuospatial (VSI) subscores, suggesting the model effectively captured higher-order reasoning and visuospatial processes.
Conclusions
This study demonstrates that deep learning analysis of spatio-temporal gaze patterns from a multidimensional cognitive task can serve as a robust digital biomarker, paving the way for accessible and objective tools for estimating cognitive capacity in children with neurodevelopmental disorders.
Keywords
Introduction
Intellectual Disability (ID) is a neurodevelopmental disorder characterized by significant limitations in intellectual functioning and adaptive behavior in the conceptual, social, and executive domains, with onset during the developmental period. 1 Generally, the global prevalence of ID is estimated to be approximately 1–2% of the populationn.2,3 The prevalence of ID increases with age throughout the developmental period, with a prevalence of 1.39% in ages 3-7, 1.79% in ages 8-12, and 2.35% in ages 13-17. 4 Children with ID typically present with deficits in attention, memory, executive function, and language, 5 leading to delays in emotional development that affect social interactions and self-regulation. 6 These developmental delays result in significant limitations in adaptive behaviors and cognitive functioning, 7 as their impaired ability to recognize situational cues and problem-solving impedes their capacity for strategic planning and goal-oriented behaviors. 8 A core characteristic of ID is deficits in executive function,9,10 a higher-order cognitive system that encompasses working memory, inhibitory control, cognitive flexibility, and planning. 11 These deficits lead to significant limitations in daily life 12 and negatively affect academic achievement.13,14
The pervasive consequences of ID necessitate early detection and therapeutic interventions 15 that allow for the continuous monitoring of behavioral and affective issues and facilitate access to essential social support. 16 In accordance with this necessity, there has been an increasing trend in utilizing diverse instructional technologies to address the educational and developmental challenges faced by individuals with special needs. 17 However, the current “gold standard” for diagnosis, the Wechsler Intelligence Scale for Children (WISC), presents significant practical barriers to comprehensive cognitive assessment. Although highly reliable, the WISC is a resource-intensive assessment tool that must be administered and interpreted by a qualified professional, making it both time-consuming and costly.15,16,18 These demanding requirements limit the feasibility of cognitive profiling, leaving a critical gap for more accessible tools, such as continuous monitoring applications. 19
To fill the current diagnostic gap, digital technologies are emerging as promising alternatives for identifying objective behavioral indicators for continuous monitoring.20–22 Previous studies have demonstrated that digital learning environments, such as those employing augmented reality or online project-based frameworks, can significantly influence academic achievement and cognitive monitoring.23,24 These technological advancements have led to significant attention being given to eye tracking due to its capacity to identify distinct differences in visual responses and gaze patterns in children with developmental disabilities.25,26 This potential has led to recent research on the use of eye tracking to classify developmental disorders.27,28 A significant portion of this research has centered on autism spectrum disorder (ASD), as the technology is particularly well-suited to objectively measure its characteristic of reduced attention to social stimuli. 29 For instance, virtual reality (VR) with machine learning (ML) achieved high classification accuracies of 86% and 92.9% for participants with ASD versus typically developing (TD) participants.30,31 The application of this methodology has also been extended to attention-deficit/hyperactivity disorder (ADHD), leveraging the findings that eye-movement characteristics can serve as biomarkers for attention-related cognitive processes7,32and achieve an 83% classification accuracy between ADHD and TD groups. 33
The application of eye-tracking methodology to ID has been more challenging, leading to limited research compared to ASD and ADHD. Cognitive and behavioral heterogeneity within the ID population presents a complex classification problem. Despite these difficulties, a notable study has demonstrated that gaze-based data can quantify differences in cognitive processes. 34 Using the Raven Progressive Matrices (RPM), a widely used non-verbal test to evaluate individual reasoning and problem solving,35,36 the study identified significant differences in gaze patterns between 15 adults with Down syndrome and 35 typically developing children who were matched for mental age. 34 Prior research on eye-tracking in individuals with ID has primarily focused on functions within a single cognitive domain, such as working memory or social attention, or on predicting specific abilities, such as problem-solving strategies.25,29,34 However, the diagnosis of ID necessitates a multidimensional approach that integrates information from various cognitive domains and adaptive behaviors.37,38 Indeed, the WISC, the gold standard for ID diagnosis, is structured to derive overall intelligence from several distinct indices, including verbal comprehension (VCI), fluid reasoning (FRI), working memory (WMI), visual-spatial (VSI), and processing speed (PSI), supporting this multidimensional view.39,40 Building upon previous RPM-based research that evaluates cognitive processes, the present study aims to enable the rapid estimation of these multidimensional cognitive profiles using objective gaze-based biomarkers.
To achieve this estimation, the present study developed a novel set of eye-tracking tasks structurally modeled on the RPM to create a multidimensional cognitive profile for ID classification. These tasks were primarily designed to elicit cognitive processes corresponding to three core WISC indices: VCI, FRI, and WMI. Furthermore, because gaze data inherently consist of spatiotemporal aspects, such as scanpaths, gaze location, and fixation durations, it was hypothesized that the remaining VSI and PSI would be implicitly encoded within the eye-gaze patterns generated during task performance. 41 To test this hypothesis and extract the encoded information, the collected gaze patterns were converted into image-based representations for a deep learning classification model. Specifically, a convolutional neural network (CNN) was utilized because this type of model excels at recognizing and hierarchically learning the spatial information contained within 2D images, such as gaze scanpaths or heat maps.42,43 Prior research has demonstrated the effectiveness of this approach by successfully extracting cognitive characteristics from gaze data to distinguish between individuals with ASD and TD.44,45 Therefore, the present study aims to validate a CNN-based approach for classifying ID using gaze-path images from custom-designed tasks. Moreover, we explored the potential of the model to quantify standardized intelligence scores (full-scale IQ and subscores) as an objective method for evaluating developmental characteristics. Finally, the performance of this image-based CNN approach is compared with that of models using traditional gaze metrics from previous RPM-based research.
This study was guided by the following objectives and hypotheses: The first objective was to design a digital cognitive assessment consisting of three distinct subtasks capable of measuring the cognitive functions of individuals with ID and detecting spatiotemporal gaze patterns. We hypothesized that the WISC-derived full-scale IQ (FSIQ) and its core sub-scores would significantly correlate with the gaze patterns recorded during these tasks. The second objective was to develop a deep-learning classification model from the collected gaze data and evaluate its potential to effectively discriminate between individuals with ID and TD. It was hypothesized that the CNN model would classify ID versus TD with superior performance compared to a traditional ML model using pre-calculated gaze metrics from prior RPM-based eye-tracking research on fluid reasoning. The third objective was to analyze the relationship between model predictions and actual intelligence scores. We hypothesized that the model’s overall output would significantly quantify the FSIQ and that the outputs derived from each specific subtask would correlate with their corresponding WISC subscores.
Methods
Participants
Participants demographics.
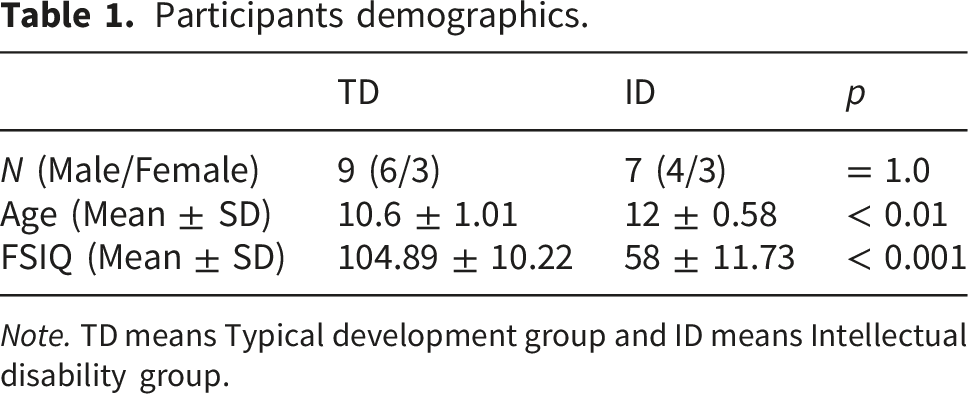
Note. TD means Typical development group and ID means Intellectual disability group.
This study was conducted with the approval of the Institutional Review Board (IRB) of the Catholic University of Korea, Seongsim Campus (IRB No. 1040395-202305-02). Prior to participation, all children, their parents or legal guardians, and an impartial witness (social workers) were provided with a detailed explanation of the study procedures according to the IRB-approved informed consent form, and written consent was obtained.
Experimental paradigm
This study aimed to objectively characterize and differentiate individual cognitive and executive functions in children at risk for ID by leveraging behavioral patterns observed from their gaze. To this end, we developed a novel experimental paradigm that effectively elicited a range of gaze movements, thereby facilitating the assessment of children’s cognitive capabilities. The paradigm consisted of three subtasks designed to correspond to the core indices of the K-WISC-V and target cognitive domains known to be impaired in individuals with ID.
Experimental task design principles
Three subtasks were designed to assess VCI, FRI, and WMI. This design was motivated by the established cognitive characteristics of ID, including language impairment, 46 deficits in reasoning and solving novel and unfamiliar problems, 47 and limitations in working memory capacity. 48 The remaining K-WISC-V indices, VSI and PSI, were not designed as stand-alone tasks. Instead, we hypothesized that these functions would be implicitly encoded within the spatiotemporal dynamics of gaze data collected across all three tasks. This integrated approach allowed for a comprehensive cognitive assessment while minimizing the total task duration and cognitive load on the participants.
All three subtasks shared a common visual format inspired by the RPM, a widely used tool designed to assess fluid reasoning. In the RPM, participants are required to select an appropriate figure from a set of options to complete a missing cell in a matrix. Recent studies have demonstrated that combining this structure with eye tracking is a powerful method for analyzing cognitive processes, distinguishing problem-solving strategies, and predicting performance.25,49 Building on this methodology, our paradigm was specifically designed to elicit and capture problem-solving gaze patterns. Each trial presented a problem matrix area (3 × 3 grid) and a response area (1 × 4 grid), as shown in Figure 1. This standardized structure was chosen to facilitate the observation of gaze patterns associated with problem-solving strategies.
25
Each subtask comprised 20 trials with progressively increasing difficulty levels. Eye-tracking-based tasks for evaluating intellectual ability.
Subtask descriptions
Although the RPM format is traditionally used for fluid reasoning (FRI), we adapted this matrix-based structure to create a comprehensive paradigm comprising three distinct subtasks. In this study, the FRI task was directly modeled after the RPM, which is a widely used tool for measuring fluid intelligence. 50 In each trial, participants were shown an 8-panel matrix with a missing panel in the bottom-right corner for 2 seconds. Subsequently, four answer choices appeared in the response area. Participants had 8 seconds to identify the underlying rule (e.g., symmetry, rotation, and progression) and select the correct missing panel. If no response was provided, the task proceeded automatically to the next trial. This task was selected because of its minimal reliance on linguistic knowledge, which makes it suitable for assessing children across a wide range of cognitive abilities, including those with ID. 36
In addition to the FRI task, novel tasks were developed in the same format to assess verbal comprehension (VCI) and working memory (WMI). The VCI task was designed to assess naming ability and vocabulary with stimuli selected based on the Korean Boston Naming Test (K-BNT). The K-BNT is a 60-item assessment that is culturally and linguistically adapted from the Boston Naming Test (BNT), 51 a foundational assessment that measures word retrieval from a series of line drawings. The K-BNT has been validated for evaluating language development in Korean children. 52 In each trial, a 3 × 3 problem matrix displayed nine images belonging to a single semantic category. After 2 seconds, four written words appeared in the response area. Participants had 8 seconds to select the word that correctly identified the objects depicted in the images. The trial advanced automatically after selection or if the 8-second time limit expired.
The WMI task was designed to assess visuospatial working memory, a key component of the working memory model responsible for encoding and maintaining integrated visual and spatial information.53,54 To specifically target the ability to process multiple pieces of information as a unified whole,55,56 our task utilized a presentation format that displayed color and location information simultaneously. Consistent with the preceding tasks, the task format consisted of a 3 × 3 problem matrix and a 1 × 4 response area. Each trial began with a 3-second presentation of randomly arranged colored squares in the problem matrix. Immediately following this, the grid was shown for 2 seconds, and several target squares were removed. Participants were then required to select the response option that correctly identified the color and location of the removed items within an 8-second time limit. This design required participants to integrally encode and store visuospatial information and then selectively retrieve and compare it with the response options to make a final choice. Trial difficulty was progressively increased by adjusting the number of presented colors and target items to be remembered. This calibration was informed by several findings showing that performance decreases with complexity and an increased number of stimuli,57,58 and that the working memory capacity for color is limited to approximately three items.59,60 It is also crucial to consider the finding that excessively difficult tasks can increase task-avoidant behaviors, particularly in children with developmental disabilities. 61 Therefore, to accommodate these cognitive characteristics while ensuring sustained engagement, the maximum difficulty was set to three presented colors and three target items to be remembered.
Experimental procedure and apparatus
To counterbalance potential order effects, the administration of the K-WISC-V and the eye-tracking paradigm was randomized across participants. The K-WISC-V for the child participants, administered by trained graduate students specializing in clinical psychology, required roughly 60 minutes. These administrators operated under the direct supervision of a licensed clinical psychologist (J.W.Y.), who performed the final evaluation. The eye-tracking session totaled approximately 30 minutes, which included 10 minutes for equipment setup and the 9-point calibration procedure. The three subtasks were then administered in a fixed order (VCI, FRI, and WMI), with approximate durations of 4 minutes for VCI, 4 minutes for FRI, and 5 minutes for WMI. Prior to the main experiment, the participants completed three practice trials for each subtask. Eye-tracking data were recorded using a Gazepoint GP3 system (Gazepoint, Vancouver, Canada) at a sampling rate of 150 Hz. Stimuli were presented on a 24-inch LCD monitor (1920 × 1080 resolution) with a viewing distance of approximately 60 cm. A chin rest was used to minimize head movements and maintain a consistent viewing distance.
Conventional eye-tracking metrics and logistic regression
Following the methodology of Liu et al., 25 three conventional gaze metrics were calculated from raw eye-tracking data. The proportional time on matrix (PTM) is the total fixation time on the 3 × 3 problem matrix divided by the total trial response time. Higher values indicate greater attention to the problem space. The rate of toggling (ROT) is the total number of gaze shifts between the problem matrix and response area, divided by the total trial response time. Higher values indicate more frequent comparisons between the matrix and response areas. The rate of latency to the first toggle (RLT) was the time elapsed before the first gaze shift from the problem matrix to the response area, divided by the total trial response time. Higher values may suggest that more time is spent on initial problem encoding and planning. In the original study, the ROT was calculated by dividing the total trial response time by the sum of toggles between the matrix and the response area, as this method was more suitable for expressing the strategy. However, in this study, based on the relevant research,62,63 the ROT was calculated by dividing the sum of the toggles by the total trial response time. In other words, a higher ROT value indicates more frequent gaze shifts. These three metrics were calculated for each of the three subtasks (VCI, FRI, and WMI), yielding nine eye-tracking features. To test the predictive utility of these metrics, two logistic regression (LR) classifiers were trained to distinguish between ID and TD groups. 64 The first model utilized only nine eye-tracking features, whereas the second used a combined set of eye-tracking and behavioral features (task accuracy and response time for each subtask). All features were normalized via standardization before model training.
Gaze path imaging and convolutional neural networks
To overcome the limitations of the conventional LR approach, such as its reliance on sophisticated feature engineering and the resulting loss of spatiotemporal gaze information, we employed a CNN. CNNs are deep learning architectures that are particularly effective in processing 2D image data, such as scanpath images, and identifying salient spatial patterns.
65
For our model, the gaze data from each of the 20 trials within the three subtasks were converted into a unique scanpath image. These images were subsequently processed using the CNN, which consisted of three parallel convolutional blocks, one for each subtask. Within each block, the scanpath image was passed through three successive convolutional layers, employing 16, 32, and 128 filters of size 3×3, respectively, each followed by a max-pooling layer to produce a latent vector. Subsequently, the three vectors were concatenated, and the resulting combined vector was fed into a dense layer comprising 256 neurons, followed by a dropout layer with a rate of 0.3. This process generates a binary classification of ID and TD using sigmoid activation. The overall architecture of our model is depicted in Figure 2, and the detailed hyperparameters are described in Supplementary Table 1. In this study, all models were implemented by a system equipped with an AMD Ryzen 5 5600 6-core processor, 32GB of RAM, and an NVIDIA GeForce RTX 2060 GPU. The CNN architecture using scanpaths from three subtasks.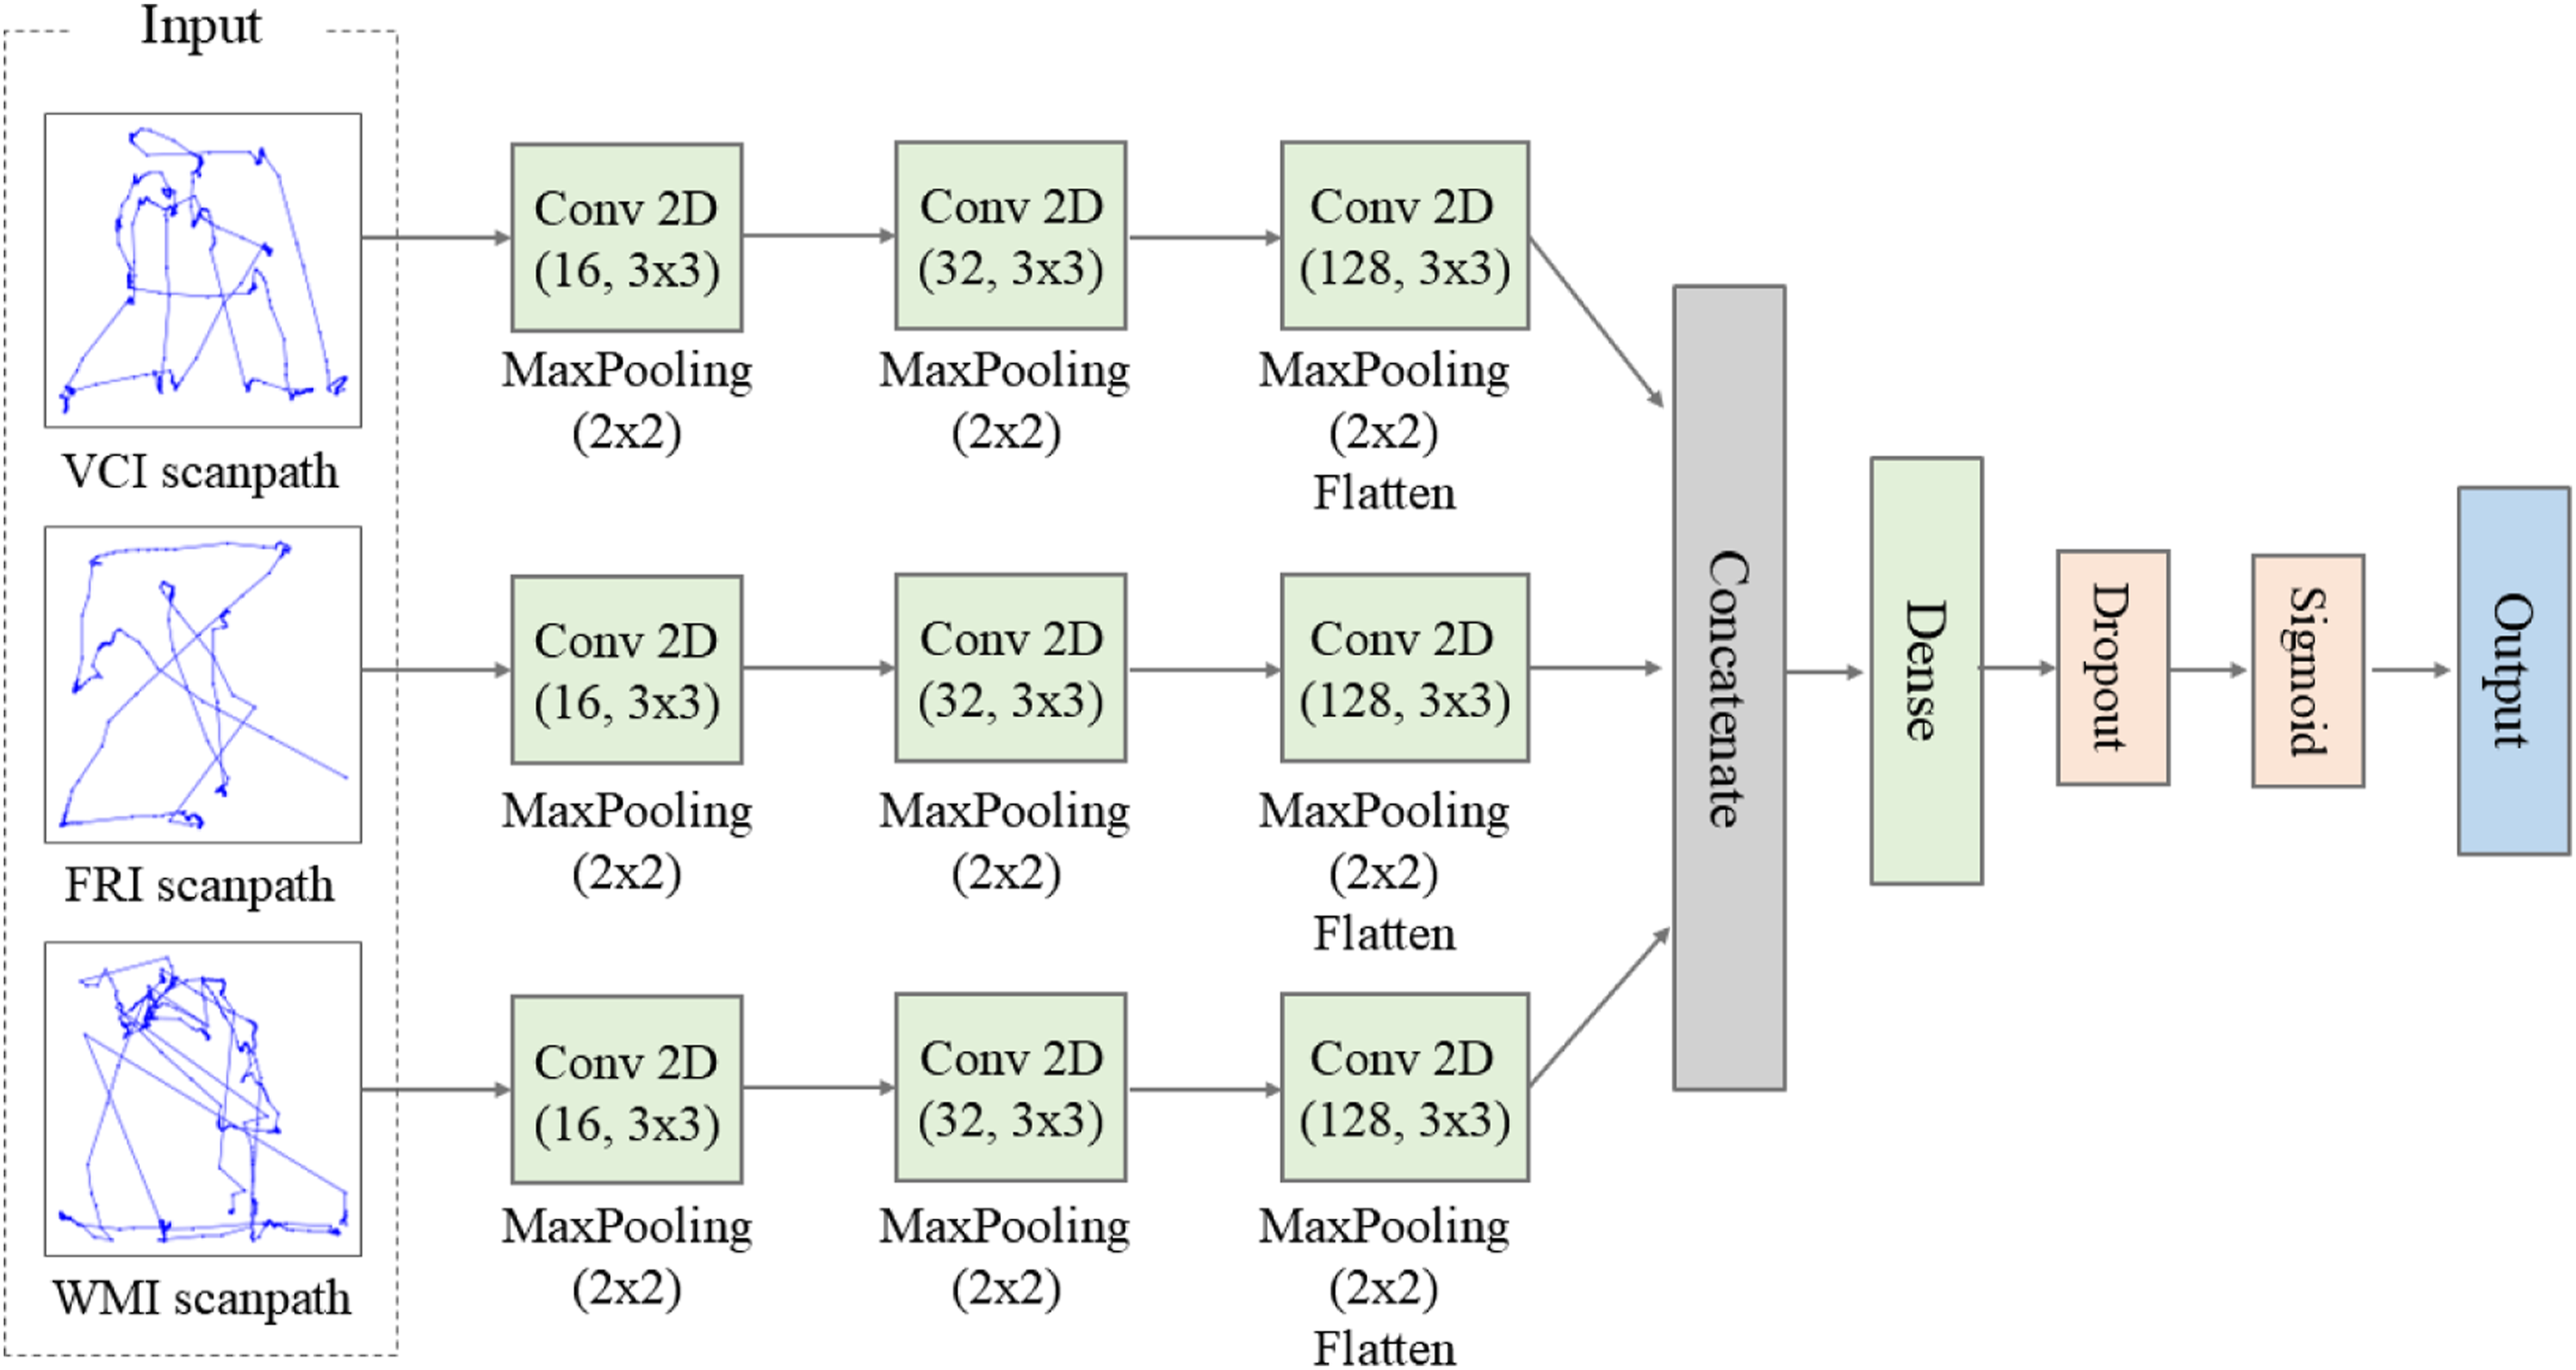
To prevent data leakage from the same participant into both training and validation sets, a Group K-Fold Cross-Validation (K=4) strategy was implemented, using participant ID as the grouping variable. The model was trained and validated on each fold, and the final performance was evaluated by averaging the results across all folds.
Statistical analysis and evaluation metrics
Prior to all statistical analyses, the normality of data distributions was first assessed using the Shapiro-Wilk test. For group comparisons, as all behavioral and eye-tracking metrics were not normally distributed, non-parametric Mann-Whitney U tests were primarily used. Furthermore, to control for the potential confounding effect of the significant age difference between the groups, a non-parametric analysis of covariance (ANCOVA) with age as a covariate was performed on all behavioral and eye-tracking metrics. Similarly, for correlation analyses, partial Spearman’s rank correlation coefficients were utilized to statistically adjust for the effect of age. To correct for multiple comparison problems, a false discovery rate (FDR) method was applied, and significance was determined based on a q-value of less than 0.05. The performance of the classification models was evaluated using accuracy, F1-score, sensitivity, precision, and specificity, averaged across the cross-validation folds.
Results
Behavioral performance
Correlation analyses between task performance accuracy and expert-evaluated FSIQ scores revealed positive correlations, particularly within WMI and FRI tasks (Figure 3). Specifically, the WMI task exhibited the strongest correlation with FSIQ (r = 0.705, q = .015), followed by the FRI task (r = 0.681, q = .015), whereas the correlation with the VCI task did not reach statistical significance (r = 0.549, q =.068). Furthermore, task accuracy correlated significantly with specific WISC-V subscores. The accuracy for the FRI task was correlated with its respective FRI subscore (r = 0.798, q = .003). The WMI task accuracy also exhibited a significant correlation with the FRI subscore (r = 0.870, q = 0.001) rather than the WMI subscore (r = 0.538, q = .127). Additionally, performance on both the FRI and WMI tasks showed positive correlations with the WISC-V VSI subscore (r = 0.799, q = .003 for FRI task; r = 0.795, q = .003 for the WMI task). Correlations with other subscores did not survive FDR correction. In contrast to the consistent positive correlations observed with accuracy, response time analyses did not reveal any significant correlations with the cognitive indices after FDR correction (Supplementary Table 2). Relation between task accuracy and WISC indices.
While accuracy in the WMI and FRI tasks correlated with cognitive abilities, a group comparison did not yield statistically significant differences after FDR correction. Although participants in the ID group demonstrated a trend of lower accuracy than those in the TD group across all three cognitive tasks, these differences were not statistically significant (Supplementary Figure 1a). The analysis of response times also revealed no statistically significant differences between the ID and TD groups in any of the three tasks (Supplementary Figure 1b).
Conventional eye tracking measures
Analyses of eye tracking measures (ROT, RLT, and PTM) established in the previous study
20
were conducted to explore their relationships with participants’ WISC-V scores. However, following rigorous FDR correction across the numerous hypotheses, none of the correlations reached the threshold for statistical significance (q < .05). Despite this, descriptive evaluation of the uncorrected coefficients showed task-dependent trends. Overall, the PTM metric generally exhibited positive correlations with the FSIQ and subscores (Figure 4). The most notable trend emerged within this metric during the FRI task, which exhibited a strong positive correlation with its corresponding FRI subscore (r = 0.702). Although this relationship did not survive the conservative FDR penalty, a distinct linear pattern remains visually apparent in the data. Conversely, the ROT metric demonstrated inconsistent directional patterns across tasks. Specifically, when correlated with FSIQ, VCI ROT showed a relatively flat or slightly positive trend, whereas FRI and WMI ROT exhibited negative correlations. Finally, the RLT metric exhibited the weakest correlation across all measures due to the high variance (Supplementary Table 3). Similarly, group comparisons did not yield statistically significant differences (Supplementary Figure 2). Relation between eye gaze based features and WISC indices.
Predictive modeling at the item-level using eye tracking data
To address the limitations of relying on isolated gaze metrics, we investigated whether a multidimensional modeling approach could better capture the underlying patterns for classifying the ID and TD groups. We compared two distinct approaches: a traditional feature-based LR classifier and a deep learning-based CNN. Our baseline LR model, trained using only nine eye tracking measures (ROT, RLT, and PTM from each of the three subtasks), demonstrated suboptimal performance at the item level (classifying each of the 20 experimental trials), achieving an average accuracy of 66.56% and an F1-score of 0.543 (Figure 5(a)). An analysis of the LR coefficients revealed that the feature with the largest absolute value was ROT from the WMI task, followed by PTM and ROT from the VCI task (Supplementary Figure 3a). Next, a second LR model was developed by adding behavioral features (task accuracy and response time), for a total of fifteen features. The accuracy was enhanced to 77.81%, and the F1-score increased to 0.719 (Figure 5(b)). While the top three predictive features remained consistent (WMI ROT, VCI PTM, and VCI ROT), the response time from the FRI task emerged as the fourth most influential feature (Supplementary Figure 3b). Performance of the Logistic Regression (LR) and CNN models.
To overcome the limitations of traditional feature-based methods, we employed CNNs to classify ID and TD groups directly from raw eye-tracking patterns across all trials. This approach involves transforming gaze sequences into image-like representations without manual feature engineering. The CNN model achieved significantly superior classification performance compared to the LR models, achieving an accuracy of 84.69% and an F1-score of 0.809.
Subject-level classification and correlation with WISC-V scores
To assess the practical applicability of these models for individual classification, we aggregated the item-level predictions to a subject-level decision. For each participant, the predicted probabilities from the 20 trials were averaged, and a classification threshold (0.5) was applied to this mean probability. The eye-tracking-only LR model achieved 68.75% accuracy and 0.545 F1-score. As seen in the confusion matrix (Figure 6(a)), this stemmed from limited ability to identify individuals with ID, correctly classifying only three out of seven (42.86% sensitivity) participants with ID, though it correctly identified eight out of nine TD individuals (88.89% specificity). The inclusion of behavioral features significantly improved sensitivity, correctly identifying five of seven participants with ID (Figure 6(b)). This resulted in a higher overall accuracy of 81.25% and an F1-score of 0.769. In contrast, the CNN model achieved the most robust subject-level classification performance, yielding an overall accuracy of 93.75% and an F1-score of 0.933. It achieved perfect 100% sensitivity (seven out of seven) while maintaining 88.89% specificity (eight out of nine) (Figure 6(c)). Crucially, this means no typical misclassifications in ID participants, with only one TD participant being misclassified as having an ID. Confusion Matrix based on Averaged Per-Item Probabilities.
A correlation analysis was then conducted to validate the model’s predictions against the participants’ WISC-V scores (Figure 7). For this analysis, the mean CNN-predicted probability of having an ID, averaged across all 60 experimental items, was used. The results revealed a significant negative correlation between the model’s predictions and the FSIQ (r = -0.568, q = .027). This negative relationship extended across all major cognitive domains. Particularly strong correlations were observed with the FRI (r = -0.740, q = .008) and the VSI (r = -0.669, q = .016). No significant correlations were observed with the VCI (r = -0.549, q=.057), WMI (r = -0.411, q = .160), or PSI (r = -0.247, q = .0.374). These findings suggest that the eye-gaze patterns extracted by the CNN serve as a robust indicator of an individual’s overall intellectual functioning, with a particular sensitivity to fluid reasoning and visuospatial processing. To further investigate the relative contribution of each task to overall predictive performance, separate correlation analyses were conducted for the VCI, FRI, and WMI subtasks. After FDR correction, none of the individual subtasks reached statistical significance at the q < .05 level. However, as illustrated Supplementary Figure 4, the WMI task consistently exhibited negative correlations that approached statistical significance not only with the FSIQ (r = -0.570, q = 0.080), but also with the VSI (r = -0.636, q = 0.054) and FRI (r = -0.644, q = 0.054). Spearman’s correlations between CNN predicted values and WISC indices with false discovery rate (FDR).
Explainable gaze patterns via class activation mapping
To explicitly demonstrate how the CNN model derives its multidimensional predictions and to ensure interpretability of gaze patterns, we conducted a gradient-weighted class activation map (Grad-CAM) analysis. Figure 8 illustrates the saliency maps of four representative cases, highlighting the specific spatio-temporal gaze features the model relied upon for classification. In TD cases that were correctly classified (Case 2), the model heavily focused on dense fixation areas primarily within the problem matrix and intersecting gaze trajectories between the problem matrix and the response options. The strong activation in these regions indicates that the CNN successfully learned the logical exploratory patterns characteristic of TD children. These visual explanations aligned with the behavioral metrics, characterized by a relatively larger PTM and smaller ROT in the WMI task, reflecting the cognitive process patterns of the TD group. Conversely, in correctly classified ID cases (Case 7), the saliency maps revealed activation over sparse and fragmented fixated areas, confirming that the model utilizes the lack of structured spatio-temporal exploration as a key discriminative feature for ID. In this case, a smaller PTM and a larger ROT in the WMI task were observed, reflecting an erratic and scattered visual search where the participant frequently shifted their gaze without sufficiently focusing on the problem matrix. Grad-CAM visualizations of CNN model predictions.
To further understand the sensitivity of the model, we analyzed a false-negative case (Case 3) where a high-IQ TD participant was misclassified as ID. Despite their high overall cognitive capacity, this participant produced an incorrect answer on the FRI task. The saliency map for this specific task visually captures a momentary lapse in sustained attention. It exhibits a distinct absence of prominent activation across both the problem matrix and response options. This diminished visual exploration indicates a failure to engage in the active visual encoding typically required for this task. Furthermore, in the WMI task, their gaze activation was diffuse, yielding a high ID prediction probability for this subtask. Consequently, the CNN detected the absence of systematic exploratory behavior and interpreted it as an ID characteristic, demonstrating that the model evaluates the actual cognitive effort exerted during the task. Finally, the false-positive case (Case 5) highlights the capability of the model for multidimensional estimation. Clinically diagnosed with borderline ID, this participant successfully solved all three subtasks. While their traditional discrete gaze metrics were uneven, they demonstrated active exploratory behaviors in the VCI task and systematic visual scanning in the WMI task. Notably, the participant exhibited a complete lack of toggling (ROT = 0) in the FRI task. This absence may reflect an intuitive resolution of the problem or the inherent limitations of rigid area of interest (AOI) definitions failing to capture boundary fixations. Unbound by predefined AOI constraints, the CNN successfully integrated these continuous multidimensional spatial patterns, predicting the participant as TD. This indicates that our model does not merely overfit to clinical labels; rather, it effectively estimates the underlying quality of the cognitive processes and the actual functional capacity demonstrated by the participant during the assessment.
Discussion
This study demonstrated that a novel eye-tracking-based cognitive assessment can successfully classify ID and quantify the underlying cognitive profiles of children. To achieve this, we developed three distinct subtasks structurally modeled on the RPM to elicit and capture the spatio-temporal patterns of eye gaze across core cognitive domains, including verbal comprehension, fluid reasoning, and working memory. A key contribution of this study is its multidimensional assessment design, mirroring the multi-index structure of the WISC-V. Previous eye-tracking studies involving ID have typically concentrated on isolated cognitive functions such as working memory, attentional control, or specific problem-solving strategies.13,25,34 However, the WISC-V, the clinical standard for ID diagnosis, derives its assessment from several distinct cognitive indices. 39 The WISC-V is composed of five primary indices: FRI, VCI, WMI, VSI, and PSI. As conventional RPM paradigms primarily target FRI, we designed two additional subtasks for VCI and WMI. We hypothesized that the remaining two indices, VSI and PSI, could be captured through these three subtasks because computer-based eye-tracking tests are inherently capable of capturing spatial patterns and processing speed. Accordingly, this study proposed a unified assessment that captures multiple cognitive characteristics while potentially minimizing test time and increasing engagement in children with ID.
This multidimensional approach is particularly significant, because prior eye-tracking research of neurodevelopmental disorders has largely concentrated on autism spectrum disorder (ASD), whereas its application to ID remains.27,66 Most ASD research has employed tasks that measure core symptoms, such as a lack of social attention or repetitive behaviors. 67 Specifically, distinct responses to faces versus nonsocial stimuli or emotional expressions can be readily captured by gaze patterns. 68 In contrast, such social-perceptual tasks are less suitable for assessing the core deficits of ID, which are characterized by broad impairments in intellectual and adaptive functioning. Therefore, by adapting the RPM, the gaze patterns captured during the tasks developed in our study provided a more direct and objective estimation of the specific cognitive processes relevant to ID.
The analysis of individual subtasks offers preliminary evidence for our multidimensional design hypothesis, demonstrating that the specific cognitive demands of our paradigms, particularly for FRI and WMI tasks, were adequately calibrated to capture FSIQ, as well as the FRI and VSI subscores. Specifically, the FRI task was directly adapted from the conventional RPM to assess fluid reasoning, where previous studies demonstrated significant results with FSIQ.25,34 Meanwhile, the WMI task was newly designed in this study to measure the visuospatial working memory by simultaneously presenting color and location information.54,56 Consequently, this paradigm imposes a high cognitive load by requiring the integration and maintenance of complex information. 69 Aligning with established literature for the FRI task and confirming our novel design hypothesis for the WMI task, behavioral accuracy from both paradigms yielded significant positive correlations with overall FSIQ (Figure 3). The effectiveness of the WMI paradigm lies in its sequential structure that requires participants to integrate color and spatial information, maintain that representation during a masked delay, and then actively retrieve it to select the correct answer from the response options (Figure 1(c)). This high cognitive load ensures that successful performance heavily relies on attentional control and information processing.70–72 Furthermore, the effectiveness of our paradigm extended beyond a single cognitive domain by successfully capturing specific WISC-V subindices. Notably, behavioral accuracy from both the FRI and WMI tasks correlated significantly with the FRI, reflecting the active reasoning required across these problem-solving processes. Because we also intended to capture VSI and PSI implicitly without separate tasks, we examined relationships with the VSI and PSI. We found that behavioral accuracy from the both tasks correlated significantly with VSI, confirming the inherent visuospatial demands of the task. However, although intended, it did not yield a significant correlation with the PSI. It is also worth noting that, despite its name, behavioral accuracy from the WMI task did not show a significant correlation with the WISC-V WMI. This discrepancy may be attributed to the composite nature of the WISC-V WMI, which integrates both auditory-verbal (e.g., digit span) and visual-sequential (e.g. picture span) tasks to assess a broad working memory construct. In contrast, our WMI task was focused on high-load integration of visuospatial features, which may explain its significant correlation with the VSI and FRI rather than the WMI.
However, in contrast to the behavioral results, translating these underlying cognitive processes into quantitative eye-tracking biomarkers using conventional metrics proved challenging. For instance, in the FRI task, the PTM metric yielded a notable correlation with the FRI subscore, suggesting that the RPM-based format effectively elicited fluid reasoning strategies as intended. However, in contrast to previous studies that reported significant results between PTM and FSIQ,25,34 our analysis failed to yield a significant correlation between any predefined gaze metrics and FSIQ after multiple comparison corrections. This discrepancy is likely attributable to participant characteristics. Unlike university students in previous RPM based study, 25 the children in our study may lack stable and consistent problem-solving strategies, resulting in higher individual variability in gaze patterns that obscured a detectable group-level effect. Indeed, even TD children struggled with high-difficulty items in the later stages of the task, leading them to adopt nonstrategic behaviors.
For the VCI task, the results were less consistent with those of the FRI and WMI tasks. Unlike the other paradigms, the VCI task failed to demonstrate significant correlations in both behavioral accuracy and gaze metrics with the FSIQ or the specific VCI subscore. This suggests that the VCI paradigm did not effectively capture vocabulary-specific processing as intended. This was likely because the words were drawn from the K-BNT, a formal neuropsychological test that includes items not commonly used in daily life. Therefore, the task outcome was likely more determined by a child’s prior vocabulary knowledge than by in-task visual search strategies. Collectively, these findings underscore a central challenge in conventional eye-tracking assessment: the need for task designs tailored to specific cognitive processes and populations makes the extraction of universal features difficult.
The challenge of relying on task-dependent predefined gaze metrics motivated our investigation into ML approaches for the automated estimation of cognitive capacity in children with ID. Our first approach utilizes an LR model trained with nine eye-tracking features (i.e. ROT, RLT, and PTM for each of the three subtasks). However, this model yielded modest performance, with an F1-score of 0.543 at the item level and 0.54 at the subject level (Figures 5(a) and 6(a)). Although adding behavioral features (accuracy and response time) improved the F1-score to 0.72 and 0.76, respectively (Figures 5(b) and 6(b)), behavioral metrics are insufficient for capturing the multifaceted nature of cognitive processes. While task accuracy was significantly correlated with not only the FSIQ, but also the FRI and VSI, its consistent positive patterns across all tasks suggests it may primarily reflect a general cognitive factor rather than providing the distinct signals needed for multivariate classification. Moreover, response time showed tasks-dependent instability and high variability. For instance, a longer response time could indicate cognitive impairment, but it could also reflect a strategic slowness. 73 Furthermore, pediatric populations naturally exhibit high variability in processing speed. 74 Therefore, this knowledge-based feature extraction approach, which relies on a few potentially noisy and task-dependent metrics, has inherent limitations, particularly in its difficulty in generalizing to novel tasks where the underlying structure and cognitive demands differ.
To overcome these limitations, we designed a CNN architecture that learns directly from the raw spatiotemporal patterns of the scanpath images from the three subtasks. This approach yielded higher performance, achieving an F1-score of 0.8086 at the item level and 0.93 F1-score at the subject level classification (Figures 5(c) and 6(c)). This improvement suggests that deep learning methods capable of automatically extracting complex visuospatial patterns are more effective in capturing the cognitive characteristics of children than models that rely on a few predefined metrics. Furthermore, the subject-level predictions of the CNN model demonstrated a significant correlation with the actual FSIQ scores, confirming that the estimated probabilities effectively align with established intellectual measures (Figure 7). This negative relationship extended across the FRI and the VSI subscores. To better understand the underlying drivers of this performance, we evaluated the relative contribution of each subtask to the predictive power of the model. While all three tasks were integrated into the CNN, the WMI task appeared to provide the most distinctive signals for identifying cognitive markers. As illustrated in Supplementary Figure 4, the average posterior probabilities from the WMI task consistently exhibited strong negative correlations that approached statistical significance with the FSIQ, VSI, and FRI. Although these probabilities did not show a significant correlation with the WMI subscore itself, the high cognitive load and sequential complexity of the WMI paradigm likely elicited the dense spatiotemporal gaze dynamics that the CNN utilized as an integrated proxy. In contrast, despite the relatively high correlations observed with conventional gaze metrics in the FRI task, the FRI task exhibited high individual variance in CNN prediction. This suggests that the WMI task was a more effective paradigm for the CNN model, providing the stable signals required for cognitive assessment.
The Grad-CAM analysis provides visual evidence of what these signals represent, particularly highlighting why the WMI task serves as such a robust cognitive marker. The high cognitive load and sequential complexity of the WMI paradigm elicit dense spatiotemporal gaze dynamics that reflect underlying processes such as attentional control, memory integration, and gaze organization. For a participant with a higher FSIQ (Figure 8(a)), the strong activation along dense and intersecting gaze trajectories reflects a systematic and efficient exploration strategy. This aligns with the finding that higher working memory capacity is associated with more structured gaze patterns. 70 Notably, the CNN translated these structured spatial trajectories into an overwhelmingly decisive TD prediction for the WMI subtask (probability of 0.003), far outperforming the predictions in the VCI and FRI tasks (0.377 and 0.162, respectively). Conversely, for a participant with a lower FSIQ score (Figure 8(b)), the model highly activated on unorganized and scattered patterns, which may stem from limitations in executive functions.61,65 Consistent with this visual interpretation, the model yielded a highly confident ID prediction for the WMI subtask (probability of 0.997), while VCI and FRI tasks remained relatively ambiguous (0.375 and 0.394, respectively). These disparities further highlight the importance of the WMI task for final CNN predictions, as it provides the most discriminative signals for identifying cognitive markers. Furthermore, the misclassified cases highlight broader implications for automated cognitive assessments. The false-negative instance (Figure 8(c)) implicates a critical clinical challenge: vulnerability to temporary disengagement. This underscores the necessity for future digital assessments to incorporate real-time engagement monitoring or adaptive difficulty calibration, preventing momentary lapses from skewing overall estimations. 60 Finally, the false-positive case (Figure 8(d)) emphasizes the methodological advantage of the CNN over conventional metric-dependent LR models. While traditional variables like ROT are constrained by rigid spatial boundaries and can be disproportionately skewed by idiosyncratic viewing habits, our deep learning approach implicitly evaluates the holistic quality of visual exploration, proving more resilient in capturing latent cognitive capacities that predefined metrics might overlook.
The findings of this study should be interpreted in the context of several limitations, primarily stemming from the small sample size. Given these limitations, the generalizability of the current findings to broader populations remains restricted, and the results should be considered as preliminary and exploratory. The inherent challenges in recruiting participants with ID and the resource-intensive nature of the WISC assessment made developing the hypothesized regression model unfeasible. Deep-learning models typically require large datasets to generalize effectively, particularly for a target that is as complex and heterogeneous as WISC-V. With a limited sample size, there is a risk of overfitting, and the model may capture sample-specific noise rather than patterns that can be generalized. Indeed, our preliminary analysis demonstrated that the posterior probabilities of the CNN model explained a limited portion of the variance in FSIQ scores (
An additional limitation was the significant age difference between the groups. However, the fact that the ID group was older than the TD group mitigates this concern, suggesting that the observed performance deficits are not attributable to age. To empirically address potential age-related effects, we first performed partial Spearman correlation analyses using age as a covariate. To further validate the independence of our findings from age-related variance, we conducted a supplementary validation analysis restricted to the largest age-homogeneous subgroup (N = 7, aged 12 years; 5 ID and 2 TD). As shown in Supplementary Figure 5, within this subgroup, CNN predictions demonstrated a significant correlation with FSIQ (r = -0.964, q < .001), VCI (r = -0.955, q = .003), FRI (r = -0.946, q = .003), VSI (r = -0.821, q = .029), and PSI (r = -0.857, q = .023). Although the correlation with WMI did not reach significance (r = -0.500, q = .253), these results confirm that the CNN predictions reflect underlying cognitive functioning rather than chronological age.
Furthermore, while the present study focused on the core cognitive characteristics of ID, the potential influence of comorbidities, such as ASD and ADHD, was not systematically delineated. Therefore, future research with a larger and more diverse sample is essential for validating and extending our findings and for establishing the broader generalizability of gaze-based cognitive assessment. This should include a wider range of ages, intellectual levels, and diverse clinical groups. Beyond simply increasing sample size, careful consideration should be given to the composition of the ID group itself. As ID encompasses a broad spectrum of etiologies, specific subgroups, such as children with Down syndrome or ASD, may exhibit distinct neurocognitive and oculomotor profiles. Therefore, targeted recruitment of etiologically homogeneous cohorts will reduce intra-group variability and enable the identification of gaze signatures specific to each subgroup. Furthermore, investigating the inter-group differences among these various etiologies could provide insights into condition-specific cognitive profiles. Conducting these focused investigations through large-scale clinical collaborations will ultimately enhance both the model performance and interpretability. Securing a larger and more varied dataset would provide the statistical power for significant methodological advancements. This would enable the current binary classification model to evolve into a more sophisticated system capable of differentiating between the subtypes of neurodevelopmental disorders. Critically, it would also allow the development of a regression model designed to predict both FSIQ and specific index scores from gaze data. Additionally, as the present findings suggest that the three subtasks contribute differentially to the estimation of composite cognitive scores, it is recommended that future studies should systematically investigate the relative weight assigned to each cognitive domain in predicting FSIQ. Furthermore, domain-specific response time, which showed task-dependent relationships with cognitive indices in the current study, should be integrated as a complementary feature alongside gaze-based measures. Such an approach would allow for a more fine-grained and interpretable cognitive profile, moving beyond a single composite score toward a multidimensional estimation framework that reflects the distinct contributions of each cognitive domain. As the model matures toward practical application, future studies should also evaluate its classification performance in terms of sensitivity and specificity. Although the present study frames gaze-based assessment as an estimation tool, a critical factor in determining the clinical utility of this approach lies in considering the implications of misclassification, including the potential consequences of overlooking children who require intervention.
The interpretability of the deep learning model poses an additional limitation. Although our CNN model achieved better performance than the conventional feature-engineering-based ML model, it was difficult to intuitively understand how the CNN arrived at a classification based on specific gaze pattern features because of its nature as a black-box model. Although post hoc methods for interpreting CNN models have recently been employed, they have their own constraints. For instance, even in the case of misclassification, the model often concentrated on specific regions in a pattern similar to that of the correct classification (Figure 8). This suggests that while heat maps are effective in visualizing where the model is focused, they do not provide a comprehensive explanation for why attention was directed toward a specific class, or what subtle features the model may have overlooked. These limitations likely stem from the inherent constraints of the methods. Grad-CAM, for instance, is known for its inability to process fine-grained elements at the image pixel level, 75 whereas SHapley Additive exPlanations (SHAP) operates under the assumption of feature independence, which leads to misinterpretations when variables are correlated. 76 Therefore, future research will require the selection of more inherently interpretable models and the application of more meticulous post-hoc analysis.
Conclusion
This study demonstrates the significant potential of applying deep learning to eye tracking data as a novel approach for the objective assessment of ID. By developing a novel multidimensional assessment model based on the RPM, we demonstrated that eye tracking can capture underlying cognitive characteristics, not just behavioral outputs. The high classification accuracy achieved by the CNN model trained on raw scanpath images validates the importance of analyzing holistic spatiotemporal gaze patterns. Ultimately, this study established a strong methodological foundation and highlighted the potential of this approach for the development of accessible and objective estimation tools for children with developmental disabilities.
Supplemental material
Supplemental material - A multidimensional eye-tracking assessment for estimating cognitive profiles in intellectual disability: A preliminary deep learning study
Supplemental material for A multidimensional eye-tracking assessment for estimating cognitive profiles in intellectual disability: A preliminary deep learning study by Kyeong-Bin Park, Jae-Won Yang, Seeun Kim, Dahyeon Sim and Dong-Hwa Jeong in Digital health.
Footnotes
Acknowledgements
The authors would like to express their sincere gratitude to all the children, participants, and legal guardians who participated in this study. We also thank the staff at Choonghyeon Social Welfare Center (Seoul, Korea) for their assistance with participant recruitment. We acknowledge MindHub Inc. for their collaboration and support in this research, which was performed as an industry-university joint project.
Ethical considerations
This study was conducted with the approval of the Institutional Review Board (IRB) of the Catholic University of Korea, Seongsim Campus (IRB No. 1040395-202305-02).
Consent to participate
Written informed consent was obtained from the parents or legal guardians of all participants included in the study.
Consent for publication
Not applicable as this manuscript does not contain any images or data that could identify individual participants.
Author contributions
Kyeong-Bin Park: Conceptualization, Data curation, Formal analysis, Investigation, Methodology, Software, Visualization, Writing – original draft. Jae-Won Yang: Conceptualization, Investigation, Methodology, Resources, Validation, Writing – review & editing. Seeun Kim: Software, Investigation, Writing – review & editing. Dahyeon Sim: Investigation, Validation, Writing – review & editing. Dong-Hwa Jeong: Conceptualization, Funding acquisition, Project administration, Supervision, Writing – review & editing.
Funding
The authors disclosed receipt of the following financial support for the research, authorship, and/or publication of this article: This work was supported by the National Research Foundation of Korea (NRF) grant funded by the Korea government (MSIT) (RS-2025-00532988, 70%). This work was also supported by the IITP (Institute of Information & Communications Technology Planning & Evaluation) - ICAN (ICT Challenge and Advanced Network of HRD) (IITP-2025-RS-2024-00438207, 30%) grant funded by the Korean government (Ministry of Science and ICT).
Declaration of conflicting interests
The authors declared the following potential conflicts of interest with respect to the research, authorship, and/or publication of this article: All authors are inventors on a Korean patent application (Application No. 10-20230184326) described in this manuscript. The rights to this pending patent have been licensed to Mindhub Inc.
Guarantor
Dong-Hwa Jeong takes full responsibility for the work and the conduct of the study, had access to the data, and controlled the decision to publish.
Supplemental material
Supplemental material for this article is available online.