
Abstract
Objectives
To develop and evaluate a hybrid, partially interpretable deep learning (DL) approach for multi-class skin cancer classification that improves robustness under varying acquisition conditions and delivers clinically meaningful explanations.
Methods
The proposed pipeline starts with preprocessing, including hair artefact removal using the Dull Razor method and anisotropic diffusion filtering for noise reduction while preserving lesion boundaries. Data augmentation is limited to the training set to prevent leakage. Class imbalance is addressed using class-weighted cross-entropy loss. EfficientNetB0 serves as the backbone CNN, and global feature embeddings are used to train a Random Forest (RF) classifier. Predictions are made by combining outputs from the deep model and the RF through probability-level fusion. The framework is evaluated on the HAM10000 dataset (7 classes) and a combined ISIC2019+DermNet dataset (8 classes). Performance metrics are compared against strong Vision Transformer (ViT) and transfer learning baselines. A proof-of-concept web application is developed for explainable decision making.
Results
The proposed model achieves 98.61% accuracy and 98.60% F1-score on the combined dataset. It reaches 95.02% accuracy and 95.06% F1-score on HAM10000 using lesion-wise 5-fold cross-validation. For melanoma-specific evaluations, it demonstrates high sensitivity and AUC, indicating strong performance on critical cases. Grad-CAM maps suggest that the network highlights potentially important diagnostic lesion areas.
Conclusion
The results indicate that partially interpretable architectures are a promising direction for robust skin cancer classification. The integration of Grad-CAM explanations and a web-based interface indicates that our framework may serve as a useful exploratory clinical decision-support tool.
1. Introduction
The average skin surface area is about 20 square feet, making it the largest biological tissue in the body. 1 The skin protects against potential damage from heat, injuries, and infections. It is the most superficial layer, forming a water-resistant barrier and containing special cells called melanocytes, which determine our skin tone. Factors such as mycoses, viruses, weakened immunity, bacterial infections, and genetic imbalances can all contribute to the deterioration of skin health.2,3 According to the World Health Organization (WHO), more than 1.8 billion people worldwide suffer from various skin diseases, and cancer diagnoses are expected to double over the next two decades. Furthermore, many skin diseases are infectious, putting others at risk in addition to the infected individual. 4
Skin cancer is a hazardous skin disease, causing nearly 15,000 deaths every year. 5 It is one of the top three deadliest cancers and has been a public health concern for quite some time. Skin cancer rates are considerably higher in Australia compared to many other parts of the world. 6 It first appears on the skin’s surface, visible to the naked eye. When natural sunlight or any other UV source reaches the skin cells, a mutation occurs in the DNA, affecting the cells’ healthy growth, eventually leading to skin cancer. Research has shown that people with lighter skin are more susceptible to skin cancer than those with darker skin, possibly due to better protection offered by pigmentation in the outer layers.7,8 Other risk factors could include smoking, alcohol consumption, a weakened immune system, family history of the disease, allergies, and infections.9,10 It has been observed that populations in regions with higher UV radiation, particularly at lower latitudes, have shown an increased incidence of skin cancer.11,12
The irregular growth of skin cells can be categorized as benign or malignant. Benign growths include Melanocytic Nevus (MN), Benign Keratosis (BK), Dermatofibroma (DF), and Vascular Lesions (VASC). These growths are generally non-problematic but should be monitored for irregular changes that could indicate melanoma. 13 Examples of benign growths are firm nodules like DFs and VASC, which include blood vessel abnormalities such as hemangiomas and birthmarks. Malignant tumors, such as melanoma, basal cell carcinoma (BCC), actinic keratosis (AK), and squamous cell carcinoma (SCC), are more aggressive and can spread to other tissues. SCC and BCC can lead to physical disfigurement if untreated, while AK can develop into SCC if not addressed.14,15 Melanoma, the most dangerous, often appears as irregular dark moles and can recur after removal. In 2012, there were 76,250 new melanoma cases in the USA, with 9,180 recorded deaths, and cases are projected to reach 500,000 by 2040.16,17
Diagnosing skin cancer involves a thorough examination by a dermatologist, who assesses any changes in skin color, size, shape, or texture of lesions or moles. Dermatoscopes aid in detailed lesion examination, and suspicious lesions may require tissue biopsy for pathological analysis.18,19 Dermatologists with 3 to 5 years of experience achieve over 60% accuracy in diagnosis, but expertise may vary, leading to delays in treatment delivery, particularly in developing regions. 20 Biopsies, essential for confirmation, can cause discomfort and delays in diagnosis, impacting patient recovery and causing anxiety. 21 Improved diagnostic procedures are crucial to expedite diagnosis and alleviate patient concerns. Studies have shown that early skin cancer identification can lower mortality rates by up to 90%, 22 underscoring the critical need for this treatment. Melanoma and other early-stage skin cancers have a roughly 93% five-year survival rate; this stands in stark contrast to a survival rate of as low as 27% in cases of malignant spread. 23 With an estimated 5.4 million cases of skin cancer detected in the US each year, 24 there is a growing need for early detection technologies. An escalating number of researchers25–28 are adopting computer-aided diagnosis systems to accurately analyze dermatological images by leveraging sophisticated computer vision and DL techniques. These technologies save lives by improving diagnosis speed and accuracy by accelerating interventions and personalized treatments.
Convolutional neural networks (CNNs) have greatly improved skin cancer classification, matching dermatologist performance on benchmark datasets. Pre-trained CNNs,29–31 such as ResNet, DenseNet, and EfficientNet, effectively extract features from dermoscopic images, enabling precise differentiation between melanoma and benign cases 32 Attention mechanisms and transformer architectures further enhance these capabilities. However, three critical barriers persist: (i) Class imbalance is a major issue; benign lesions outnumber malignant ones in datasets, creating biased decision boundaries and compromising early melanoma detection; (ii) Models trained on selective datasets often fail to perform well in diverse real-world conditions due to variations in imaging devices, lighting, skin tones, and lesion types; (iii) The opaque nature of DL models hinders clinician trust and interpretability, which are essential for diagnostic decisions.33–35
Many studies have explored solutions like oversampling for class imbalance,36,37 domain adaptation for generalization, and XAI for interpretability.38–41 However, few have developed a comprehensive system that is both computationally efficient and suitable for clinical use. Most research evaluates models on single-source datasets, leaving their real-world performance largely untested. There is a pressing need for DL models that tackle class imbalance, ensure interpretable predictions for dermatology, and maintain reliable performance across multiple datasets, all while being efficient for web deployment. The primary objective of this study is to develop a practical and trustworthy AI system for multi-class skin cancer classification to support healthcare professionals in their decision-making processes. Specifically, this study aims to: 1. Address the imbalance in benchmark datasets to accurately identify critical cases like melanoma, in addition to normal skin conditions. 2. Ensure the system performs reliably across various settings, maintaining accuracy despite differences in equipment, lighting, or patient characteristics. 3. Improve trust in the system by providing clear explanations that help professionals verify and use its predictions confidently. 4. Create a diagnostic tool for clinical environments to stimulate timely skin cancer screenings and support early intervention.
To achieve these goals, this study presents a structured approach comprising four key stages: data preparation, model development, evaluation, and deployment. The proposed methodology is illustrated in Figure 1. Dermoscopic images from the ISIC 2019 and HAM10000 datasets were collected to ensure a diverse representation of lesions. Images were resized and normalized, with the Dull Razor method used to remove hair artifacts and anisotropic diffusion filtering applied to enhance clarity while preserving lesion boundaries. Our approach features a hybrid model that combines EfficientNetB0 for feature extraction with a RF classifier for predictions. EfficientNetB0 captures hierarchical features with low computational demands. The RF component presents limited transparency in the embedding space, while Grad-CAM provides pixel-level interpretability for EfficientNetB0. We benchmarked our system against multiple transfer learning models, including CNNs and SENet. We also incorporated handcrafted methods such as ABCD analysis and the Grey Level Co-occurrence Matrix (GLCM) for enhanced feature representation. We assessed computational efficiency using FLOPs and inference speed to ensure real-time applicability. To build clinician trust, we integrated Grad-CAM-based interpretability that highlights predictive image regions. The system is available as a web application that allows professionals to upload dermoscopic images and receive quick predictions for informed clinical decision-making. However, our observation is preliminary and has not yet been validated by dermatologists. Key contributions of this study are as follows: • Proposed a hybrid skin cancer classification framework that fine-tunes deep convolutional representations from an EfficientNetB0 backbone with a RF classifier to enhance diagnostic accuracy. • Ensured computational efficiency for clinical use by evaluating inference speed and complexity, enabling real-time integration into healthcare workflows. • Improved clinical explainability with Grad-CAM visualizations, allowing healthcare professionals to easily understand and confirm model predictions for better decision-making. • Implemented a remote diagnostic solution with a user-friendly interface for real-time dermoscopic image upload and analysis, supporting timely interventions in clinical settings. Proposed methodology.

The remainder of this paper is structured as follows. Section 2 reviews related work. Section 3 details the materials, preprocessing pipeline, and hybrid model. Section 4 presents experimental results and statistical analyses. Section 5 discusses findings, limitations, and clinical implications. Finally, Section 6 concludes and outlines future research directions.
2. Related works
2.1. Transfer learning approaches
Skin cancer detection has been extensively studied using traditional ML and DL techniques. Monika et al. 42 and Javaid et al. 43 applied preprocessing and segmentation methods on ISIC datasets, achieving accuracies of 96.25% and 93.89%, respectively. However, both approaches lacked robust generalization to diverse clinical environments. To enhance classification performance, ensemble learning was explored by Kausar et al., 25 who achieved up to 98.6% accuracy using weighted majority voting. However, the approach faced complexity and issues with misclassifying the minority class. Similarly, Bechelli et al. 44 found that VGG16 surpassed ML models but required large datasets to avoid overfitting. Tahir et al. 45 proposed DSCCNet, outperforming baselines with 94.17% accuracy and 99.43% AUC across three datasets. However, it lacked real-world clinical validation. Jain et al. 46 benchmarked six TL models on HAM10000, with XceptionNet leading at 90.48% accuracy, though without fine-tuning optimization.
Explainability and mobile integration were addressed by Gururaj et al. 47 and Mridha et al., 48 who incorporated XAI and mobile apps, respectively. Yet, their models showed moderate performance or lacked large-scale clinical validation. Hybrid models combining ML and CNNs were explored by Thanka et al., 49 achieving 99.1% accuracy with XGBoost and VGG16. However, increased computational complexity limited real-time deployment potential. Recent studies used ViTs. Xin et al. 50 proposed SkinTrans using contrastive learning, achieving over 94% accuracy on HAM10000 and a clinical dataset. ViTfSCD by Yang et al. 51 and a multi-class ViT framework by Arshed et al. 52 reported similar performance (92–94%), outperforming TL baselines. Despite high accuracy, ViT-based methods remain resource-intensive and require balanced datasets, challenging their real-time clinical applicability. In summary, while transfer learning models show high classification potential, limitations such as dataset imbalance, overfitting, and computational demands continue to hinder practical deployment in diverse healthcare settings.
2.2. Hybrid approaches
Hybrid models combining DL and ML techniques have been proposed to enhance skin cancer classification. Keerthana et al. 53 integrated CNN and SVM for automated melanoma detection, achieving accuracies of 88.02% and 87.43%, though limited by moderate performance and lack of dataset diversity. Similarly, Bassel et al. 54 utilized stacked classifiers with ResNet50, Xception, and VGG16, attaining 90.9% accuracy on a small 1,000-image dataset, which restricted generalizability. Similarly, Farea et al. 55 introduced a hybrid framework combining public datasets and an Artificial Bee Colony (ABC) optimization strategy, achieving 93.04% accuracy and 93.12% F1-score. While effective, the model’s complexity and computational overhead raise deployment concerns. Likewise, Sella et al. 56 combined lesion segmentation with transfer learning and SVM, improving performance by 4%, but only targeted binary classification, limiting broader applicability. In another study, Panthakkan et al. 57 proposed X-R50, a fusion of Xception and ResNet50, achieving 97.8% accuracy on HAM10000. However, the sliding window mechanism increases computational cost. Tajjour et al. 58 combined CNN and MLP for seven-class classification, attaining 96% AUC, yet heavily relied on color space conversions, limiting adaptability across datasets. Lastly, Majji et al. 59 presented a Lion Cat Swarm Optimization-based Deep Neuro Fuzzy Network (LCSO-DNFN), yielding 93.10% accuracy but incurring significant complexity. Collectively, while hybrid approaches improve classification accuracy, they often suffer from computational overhead, over-reliance on dataset-specific preprocessing, and limited generalization to real-world clinical scenarios.
2.3. Explainable artificial intelligence (XAI) in skin cancer detection
Recent studies integrating XAI into skin cancer detection pipelines have demonstrated promising performance, but they also highlight challenges related to clinical translation. Grignaffini et al. 60 and Abdulredah et al. 61 achieved accuracies of 98.41% and 99.86% using techniques such as Grad-CAM, SHAP, and LRP alongside CNN and SWNet models. However, their reliance on handcrafted features and the use of homogeneous datasets limit their clinical robustness. Similarly, Halder et al. 62 and Dagnaw et al. 63 explored fuzzy ensembles and CAM-based interpretability with ViTs and CNNs but encountered challenges regarding poor generalization, scalability, and small datasets. Further, Shah et al. 64 and Ieracitano et al. 65 implemented optimization and hybrid XAI approaches (including Grad-CAM, LIME, and SHAP) and achieved up to 98.5% accuracy. However, their reliance on handcrafted features and dependence on annotated masks limited their transparency and scalability.
Abbas et al. 66 employed VGG16 with LRP for interpretability and reached an accuracy of 93.29%, although they faced concerns regarding privacy and dataset diversity. Hamim et al., 67 Cino et al., 68 and Gamage et al. 69 utilized Grad-CAM and test-time augmentation, achieving over 97% accuracy with models such as DenseNet121, EfficientNet-B6, and Xception. However, these models lacked validation across different devices and out-of-distribution scenarios. Munjal et al. 70 achieved 94.3% accuracy using ResNet50 with Grad-CAM and LIME in the SkinSage XAI project, but their study lacked a multi-center evaluation. While XAI enhances interpretability in skin cancer diagnosis, common limitations persist, including an overreliance on handcrafted or segmentation-dependent features, limited dataset diversity, and insufficient validation in real-world clinical settings. These factors restrict broad deployment of these technologies.
2.4. Research gap analysis
Traditional CNN methods often struggle with class imbalance, leading to poor sensitivity for critical minority classes like melanoma. To tackle this, we use class-weighted loss and data augmentation to enhance minority class representation during training, ensuring balanced learning and improved sensitivity without compromising specificity. Our hybrid model also addresses concerns regarding computational efficiency and interpretability. EfficientNetB0 is used for high-quality feature extraction with fewer parameters, making it suitable for real-time deployment while maintaining accuracy. Unlike heavier models like EfficientNetB7, it strikes a balance between accuracy and computational demand. Integrating RF offers transparency in the classifier stage through feature-space importance and tree voting, but it lacks pixel-level lesion localization. For spatial explanations, we use Grad-CAM with the EfficientNetB0 backbone. Previous hybrid methods, such as CNN + SVM, have scalability issues in high-dimensional feature spaces. In contrast, RF effectively manages high-dimensional data and maintains transparent decision boundaries, thereby building trust in model predictions. A major limitation in prior works is the use of single-source datasets, which restrict generalization. Our study addresses this limitation by testing the model on multiple benchmark datasets, including HAM10000, ISIC 2019, and DermNet, thereby ensuring robust performance across diverse conditions, demographics, and lesion types. Furthermore, while many approaches remain theoretical, our study bridges the gap by deploying the hybrid model in a user-friendly web application. This allows healthcare professionals to upload dermoscopic images and receive real-time, interpretable predictions, simplifying early detection and informed clinical decision-making.
3. Methodology
3.1. Data description
We used a total of eight classes of skin diseases, which were sourced from the ISIC 201971–74 and Dermnet
75
datasets. These classes include Melanoma (MEL), MN, BCC, AK, BK, DF, VASC, and SCC. The ISIC 2019 dataset consists of a collection of 25,331 JPEG images along with relevant metadata such as age, sex, and anatomic site. The dataset includes a total of 4,522 MEL images, 12,875 Melanocytic Nevi images, 867 AK images, 3,323 BCC images, 239 DF images, 253 Vascular lesion images, 628 SCC images, and 2,624 BK images. In addition, the Dermnet dataset contains more than 23,000 dermoscopic images, documenting 643 skin diseases, which are categorized into a two-level taxonomy. This dataset contains a selection of classes from ISIC 2019, including MEL, AK, BK, DF, and VASC. Combining the datasets resulted in 30,990 images distributed among eight target classes, as shown in Figure 2. Sample of a combined dataset of ISIC 2019 and Dermnet.
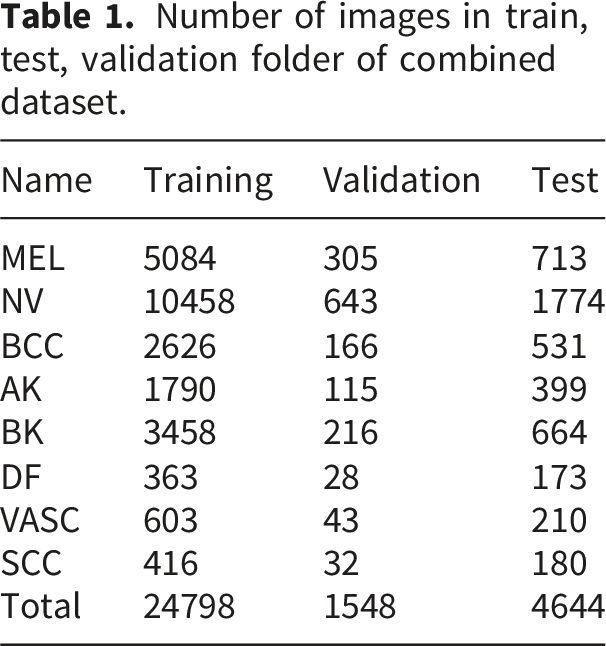
Figure 3 depicts our dataset’s varied distribution across different skin disease classes. The category ”NV” dominates with the highest count of 12,875, more than double the second-largest category, ”MEL,”. Following these, ”BK” and ”BCC” are mid-range categories with values of 4,338 and 3,323, respectively. The smaller categories—”AK,” ”VASC,” ”SCC,” and ”DF”—all have values under 2,500, with ”DF” being the smallest at 564. This disparity, particularly the large gap between ”NV” and the other categories, suggests a potential imbalance in the data. The dataset was divided into 80% training, 5% validation, and 15% testing set. Table 1 presents the number of images per set. Distribution of each skin cancer class. Number of images in train, test, validation folder of combined dataset.
We also used the HAM10000 dataset, which consists of 10,015 images showcasing seven different types of skin lesions: AKIEC, BCC, BKL, DF, MEL, NV, and VASC. With a diverse range of skin cancer subtypes, shown in Figure 4, the dataset allows accurate differentiation between different types of lesions. A significant portion of the lesions in the dataset have been confirmed through histopathological analysis. The dataset includes 327 AKIEC images, 514 BCC images, 1,099 BKL images, 115 DF images, 1,113 MEL images, 6,705 NV images, and 142 VASC images. Both datasets were partitioned into three subsets for experimentation, allocating 80% for training, 5% for validation, and 15% for testing purposes. Sample of HAM10000 dataset.
3.2. Data preprocessing
3.2.1. Resize and normalization
Initially, the images are resized to a standardized dimension of 224 x 224 pixels, employing bilinear interpolation for adjusting pixel values based on the weighted averages of neighboring pixels. This resizing operation ensures uniformity in the input size, facilitating subsequent processing steps. 76 After resizing, min-max normalization is applied to scale the pixel values to a range between 0 and 1. It preserves the relationships between pixel values by maintaining the original distribution’s structure, while ensuring no feature dominates due to larger value scales. This is especially important in DL models where the activation functions are sensitive to input ranges. 77 Normalizing the data also accelerates convergence during training and helps prevent vanishing or exploding gradients. 78
3.2.2. Dull razor
This method is implemented for hair removal, as shown in Figure 5. Hair artifacts in dermoscopic images can obstruct essential features of the skin lesion, such as its borders, colour patterns, and textures. The presence of hair can introduce noise and misleading information, resulting in incorrect feature extraction by the model.
79
Therefore, the dull razor method was chosen to effectively eliminate these artefacts while preserving the integrity of the lesion’s visual features. This method entails a series of operations: grayscale morphological operation, shape verification, replacement, and applying an adaptive median filter.
80
The grayscale morphological operation identifies hair pixels, utilizing morphological operations like erosion and dilation. Subsequently, shape verification is performed to discern whether the identified pixels represent thin or long structures. Undesirable hair pixels are then replaced using bilinear interpolation, ensuring a seamless transition between regions. Finally, an adaptive median filter is applied to smooth the replaced hair pixels, reducing irregularities introduced during the replacement process. Sample images after implementation of dull razor technique.
3.2.3. Anisotropic diffusion filter
Two anisotropic diffusion filters are employed in the preprocessing pipeline to enhance image quality and reduce noise. They were chosen because of their effectiveness in reducing the noise of homogeneous regions while preserving essential features, such as the edges of skin lesions.
81
Traditional smoothing techniques often blur the boundaries of skin lesions, which are key features for distinguishing between benign and malignant conditions.
82
The diffusion equation governing anisotropic diffusion filters is represented as Equation (1), where (I) is the image, (t) is time, (∇) denotes the gradient operator, and 
Combining the dull razor method and anisotropic diffusion filters ensures that dermoscopic images are free from artifacts like hair and enhanced for critical features like edges and textures. This preprocessing pipeline was selected to provide cleaner and more precise images for feature extraction, leading to improved model generalization and classification accuracy.
3.3. Data augmentation and imbalance handling
The augmentation process involved a variety of operations to diversify the dataset. Firstly, rotation was applied to images, allowing for different orientations to ensure the model can correctly classify lesions regardless of their positioning. Horizontal and vertical shifting and flipping were employed to learn features across various transformations. Random clipping was used to crop images randomly, focusing on different regions of interest to learn important patterns rather than relying on the whole image context. Brightness and contrast alteration were applied to adjust images’ overall intensity and contrast. This ensures that lighting conditions and contrast differences present in real-world medical images are well-represented during training. Shear operations were used to improve the model’s resilience to geometric transformations. Additionally, zoom operations were performed to magnify or shrink specific regions of the images. Sigmoid corrections were applied to adjust the image intensity distribution, making detecting important lesion details easier for the model. Finally, stretching operations were utilized to deform images non-uniformly.
3.4. Feature extraction and baseline DL models
This study employed two primary methods for feature extraction: ABCD analysis and GLCM. The ABCD method was selected because of its widespread use and effectiveness in dermatological practice. 84 This method evaluates four key diagnostic parameters: Asymmetry, Border irregularity, Color variation, and Diameter. These are well-established indicators critical for differentiating between benign and malignant lesions. Asymmetry captures the irregular shape of malignant lesions, while border irregularity identifies uneven edges often indicative of skin cancer. 85 Color variation is another critical marker, as malignant lesions typically exhibit multiple colors, unlike benign lesions, which tend to have uniform coloration. Finally, the diameter criterion, particularly lesions larger than 6 mm, is a common diagnostic measure for malignancy.
On the other hand, GLCM was selected to capture second-order statistical texture features. Texture is essential in distinguishing between different types of lesions, as malignant lesions may have rougher or more heterogeneous textures than benign ones. By focusing on texture, GLCM provides additional information that improves the model’s ability to differentiate lesions that may look similar in color and shape but differ significantly in texture.86,87 Key measures derived from GLCM include Energy, Entropy, Autocorrelation, Correlation, Homogeneity, and Contrast. Energy reflects the uniformity of texture patterns, with higher values indicating smoother textures typical of benign lesions. Entropy measures the randomness of the texture, which is often higher in malignant lesions. Other features, like Autocorrelation and Correlation, provide further insight into the regularity between neighboring pixel intensities. Homogeneity measures the similarity of pixel intensity distributions, helping to distinguish between benign lesions’ smooth texture and malignant ones’ more irregular texture. Contrast, which measures the intensity difference between a pixel and its neighbor, is beneficial for identifying rough or uneven textures that might indicate malignancy.
3.5. Baseline configurations
We benchmark our approach using several widely used deep learning backbones, fine-tuned for a single-head multi-class setting. Our baseline CNN combines convolutional and pooling layers to transform local textures into higher-level representations, which are mapped to lesion classes through fully connected layers and a softmax output. To include a resource-efficient design, we also evaluate SqueezeNet, which uses fire modules to efficiently reduce and then restore channel dimensionality with 1 × 1 and 3 × 3 convolutions, achieving competitive performance with fewer parameters. Additionally, we assess attention-augmented and deeper residual architectures. SENet enhances standard CNNs by introducing Squeeze-and-Excitation (SE) blocks, which generate channel-wise reweighting to emphasize informative feature maps. ResNet50 serves as a robust deep baseline, utilizing identity skip connections for stable optimization and effective feature learning for lesion classification. Lastly, EfficientNetB0 is included as an efficient backbone that balances accuracy and computational cost, employing compound scaling and depthwise separable convolutions to achieve high performance with a relatively small parameter count.
3.6. Transformer models
To provide a strong Transformer-based baseline, we adopt state-ofthe-art Multi-ViT and Cross-ViT architectures. In all experiments, they are fine-tuned on the training folds using the same data preprocessing, augmentation, and class-weighted loss strategy as the CNN-based models. The resulting performance provides a competitive Transformer-based reference against which the proposed EfficientNetB0+RF hybrid can be critically assessed.
Multi-ViT aaggregates multiple ViT branches through learnable attention-based weighting (Figure 6). Each input lesion image is first partitioned into non-overlapping patches and linearly projected into a sequence of patch embeddings. Fixed positional embeddings are then added to preserve spatial layout before the tokens are forwarded to K parallel ViT encoder branches. Every branch follows a standard pre-norm Transformer design and consists of stacked blocks comprising layer normalization, multi-head self-attention, and a feed-forward MLP. From each branch k ∈ {1, …, K}, we obtain a latent representation Multi-ViT architecture.
Cross-ViT explicitly models interactions between local and global lesion patterns (Figure 7). The input dermoscopic image is partitioned into patch tokens at two different scales: a small-patch branch (S branch) with patch size P
s
that captures fine-grained details, and a large-patch branch (L branch) with patch size P
ℓ
that focuses on global structure. In each branch, patches are linearly projected into a token sequence, augmented with a learnable (CLS) token and positional embeddings, and then processed by N stacked Transformer encoder blocks comprising multi-head self-attention and feed-forward layers. After intra-branch encoding, it introduces cross-attention modules that enable the CLS token of one branch to attend to the token sequence of the other branch. This bidirectional exchange allows the small-patch representation to be informed by global context and, conversely, the large-patch representation to be refined by high-resolution local cues. Let Cross-ViT architecture.
3.7. Proposed hybrid model
It is designed to combine the strong feature representation of a fine-tuned EfficientNetB0 backbone with the complementary decision behaviour of a tree-based classifier. Unlike the baseline configurations, where CNN and Transformer backbones are trained end-to-end with a single fully connected classification head, the hybrid approach decouples feature learning from final decision making. This deep+ML fusion aims to improve robustness under class imbalance and to provide an alternative inductive bias compared to purely deep architectures. Algorithm 1 presents the pseudocode of the proposed hybrid architecture. We first fine-tune EfficientNetB0 on the training folds using the class-weighted cross-entropy loss. Let C denote the number of classes and n
c
the number of training samples of class c. We define a class weight w
c
based on the inverse class frequency,

Equation (2) ensures that minority classes receive larger weights, and Equation (3) penalises their misclassification more heavily, following recent recommendations for imbalance-aware DL. After fine-tuning, we remove the final fully connected layer and use EfficientNetB0 purely as a feature extractor. For each input image x, we obtain a fixed-length embedding
Each training image x
i
is mapped to its deep feature vector 

3.8. Training parameters
Detailed configuration of training hyperparameters with explored ranges and final selected values.

To mitigate the impact of class imbalance without introducing synthetic images, we adopt a class-weighted cross-entropy loss. Let y ∈ {1, …, C} denote the true class label for an input image and 
3.9. XAI integration
To address the interpretability challenges inherent in DL-based skin cancer classification, we integrated Grad-CAM into our proposed hybrid pipeline. It generates attention heatmaps that visually highlight regions within dermoscopic images that contribute most significantly to the model’s predictions, providing clinicians with insight into the model’s decision-making process. Grad-CAM was applied to the EfficientNetB0 backbone by utilizing the gradients of the predicted class score y
c
with respect to the feature maps A
k
from the last convolutional layer. Specifically, the importance weights 

The attention map generated by Grad-CAM was upsampled and overlaid on the original dermoscopic image to identify the regions that influence the model’s predictions. This method was applied to samples from the ISIC 2019 + DermNet dataset and the HAM10000 dataset to ensure interpretability across various imaging sources and lesion types. Attention maps were created for both correctly and incorrectly classified samples for qualitative assessment. Grad-CAM was explicitly applied to the EfficientNetB0 component of the hybrid model since RF lacks spatial interpretability. Accordingly, the reported maps should be interpreted as qualitative explanations of the CNN backbone features used by the hybrid decision, rather than as direct explanations of the RF component. The predicted class used to generate the heatmap ensured alignment with the model’s final decision while utilizing EfficientNetB0’s feature representations. This approach adds minimal computational overhead, maintaining real-time performance during inference and web deployment. Clinically, the visual explanations help dermatologists understand which lesion regions influenced predictions, aiding in cross-validation before making clinical decisions. Grad-CAM visualizations also enable practitioners to evaluate lesion boundaries, heterogeneity, and color variations, aligning with diagnostic practices. Integrated into the web application, these overlays enable clinicians to interactively view and interpret model explanations within their diagnostic workflows, thereby enhancing the connection between high-performing AI systems and practical clinical applications.
4. Experimental results
4.1. System implementation
The implemented frameworks underwent thorough testing and evaluation under specific software and hardware configurations. The operating system employed was Windows 10 Pro, while the Jupyter Notebook was the primary interpreter for code execution. The system operated on a 12th Gen Intel(R) Core (TM) i7-12700K processor running at 3.61 GHz, coupled with 32.0 GB of installed RAM. Operating on a 64-bit architecture with an x64-based processor, the system was equipped with an NVIDIA® GeForce RTX 3060 Ti Twin Edge featuring 8GB DDR6X memory for graphics processing.
4.2. Evaluation metrics
Key metrics such as accuracy, precision, recall, and F1 score are computed using a MA approach for multiclass classification. This method averages the metric values calculated independently for each class, providing a balanced evaluation regardless of class size or prevalence. Accuracy assesses the classifier’s overall accuracy by averaging the accuracy across all classes, as shown in Equation (4). Precision calculates the average positive predictive value for each class Equation (5), while recall focuses on the true positive rate for each class Equation (6). Finally, the F1 score combines precision and recall using the harmonic mean to offer a balanced evaluation of the classifier’s performance Equation (7). Here, N represents the total number of classes, TP
i
is the number of true positives for class (i), TN
i
is the number of true negatives for class (i), FP
i
is the number of false positives for class (i), and FN
i
is the number of false negatives for class (i).


For a robust and unbiased evaluation, we adopted a lesion-wise stratified 5-fold cross-validation protocol. All images belonging to the same lesion were assigned to the same fold to prevent information leakage across training and validation sets. The folds were constructed in a stratified manner so that the class distribution in each fold closely matched the overall dataset distribution.88,89 For each cross-validation run, four folds were used for training and the remaining fold was held out exclusively for validation. All geometric and photometric augmentations, as well as the class-weighted cross-entropy loss, were applied only to the training images of each run. The validation folds were neither augmented nor re-weighted and were always evaluated using the original, unmodified images. This protocol ensures that no augmented or re-weighted samples leak into the validation process and that the reported performance faithfully reflects generalization to unseen data.
4.3. Performance comparison
Cross-validation results for experimental classifiers on combined dataset.

Cross-validation results with standard deviations for each metric on the HAM10000 dataset.


Model performance comparison across evaluation metrics (with Std) on experimental datasets.
Comparison of different optimizers for the proposed hybrid EfficientNetB0+RF model on HAM10000 and the combined dataset. Values are reported as mean ± standard deviation over 5-fold cross-validation.

Paired t-test results for model comparison on the combined dataset.

Paired t-test results for model comparison on HAM10000 dataset.

Model complexity and training efficiency on the experimental datasets.

EfficientNetB0 balances efficiency and performance well, containing 5.3 million parameters and 0.39 GFLOPs. Figure 9 shows competitive training times (3.1 hours for Combined, 1.3 hours for HAM10000) and a low inference delay (3.4 ms/image), confirming its status as a top choice in skin cancer classification applications. Adding an RF head to EfficientNetB0 increases parameters slightly to 5.4 million and FLOPs to 0.41G, along with a minor rise in training and inference time. However, the minimal increase (+0.3 ms/img) is justified by the significant performance improvement shown in Table 11. Radar comparison of model complexity and efficiency across experimental models.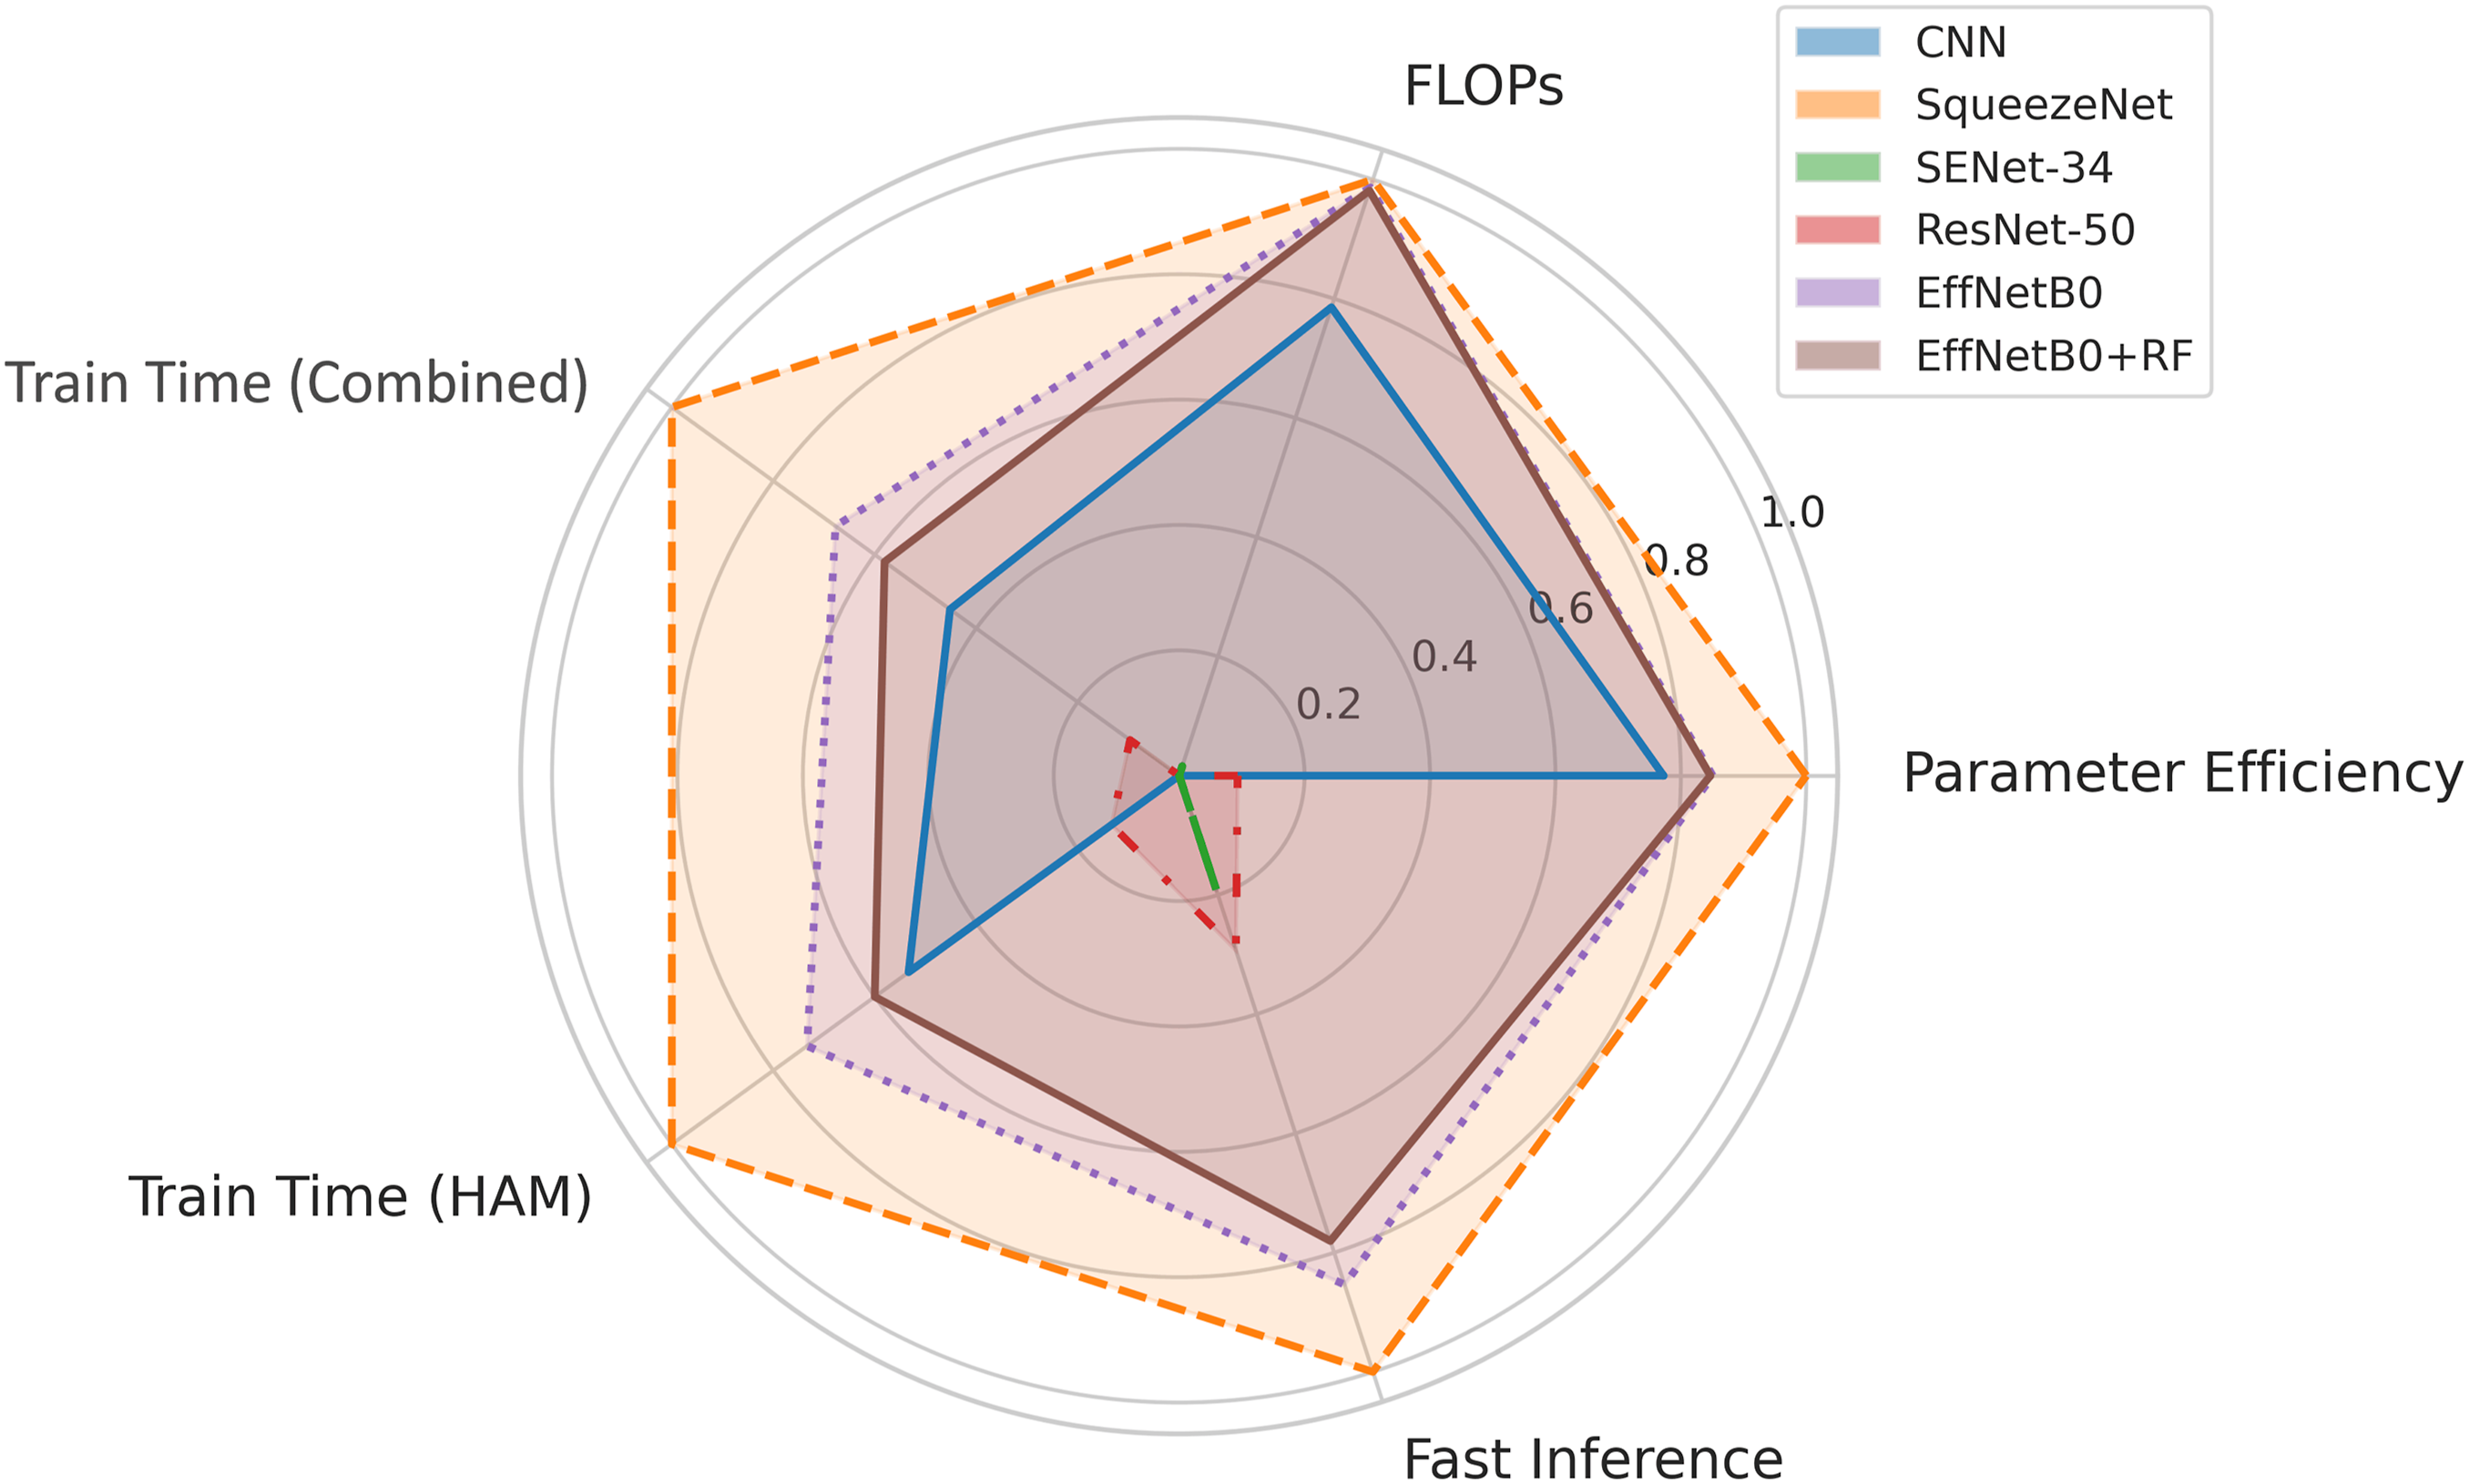
Comparison of different ML classifiers on EfficientNetB0 feature extractor.

XGBoost outperforms both LR and SVM. It leverages sequential decision trees to correct errors and adaptively manage feature importance, showing consistent classification scores in both datasets. As shown in Figure 10, EffNetB0 + RF delivers the best results with superior recall (98.78% on Combined, 94.85% on HAM10000). RF trains multiple decision trees on diverse data, modeling complex patterns while reducing overfitting. Its performance is particularly valuable in medical applications where accurately identifying positive cases is crucial. Overhead component effectiveness analysis of hybrid models with EfficientNetB0 feature extractor.
Incremental effect of individual preprocessing steps and the RF head on EfficientNetB0.


Effect of preprocessing on the proposed model.
Cross-dataset generalization analysis.

Robustness of the EfficientNetB0+RF model under different noise and transformation conditions.

Per-class performance of MultiViT and CrossViT on HAM10000 and the combined dataset. Values are reported as MA metrics over 5-fold cross-validation.

Note. Lower scores for less frequent classes such as DF and VASC are consistent with their higher intra-class variability and more ambiguous lesion boundaries, which also contributes to noisier and less localised Grad-CAM maps for these categories.
On the combined dataset, both model deliver very strong performance, with MA F1 values of 97.7% and 98.0%, respectively, and weighted F1 values exceeding 98%. Again, the relative advantage alternates across classes: MultiViT slightly outperforms CrossViT for some categories, while CrossViT attains marginally higher F1 for AK, DF, VASC and SCC. However, small performance drops remain visible for more ambiguous classes. The melanoma-only metrics provide a more clinically focused perspective. For HAM10000, MultiViT achieves a sensitivity of 93.5% and F1 of 93.7%, whereas CrossViT improves sensitivity slightly to 94.1% and F1 to 94.3%, with corresponding AUC values of 0.974 and 0.977, respectively. These results confirm that both ViT variants are capable of detecting melanoma with high sensitivity and discrimination, but also highlight that even strong models can misclassify a non-negligible fraction of cases.
4.4. Performance validation
The confusion matrix for the hybrid model (Figure 12) indicates excellent performance on the combined dataset, particularly for conditions such as NV and MEL, with 1737 and 689 correct predictions, respectively. BCC and BK also demonstrate high accuracy, with 508 and 639 correct classifications. Despite fewer examples, the DF and VASC classes show impressive predictive accuracy, highlighting the model’s capability across various skin conditions. However, the model does have some weaknesses, particularly in distinguishing between conditions with similar dermatological features, such as AK and SCC. While misclassifications are relatively low, they occur, such as MEL being confused with NV and SCC, or AK being confused with BCC and SCC. Confusion matrices of EfficientNetB0+RF on (a) Combined and (b) HAM10000 datasets.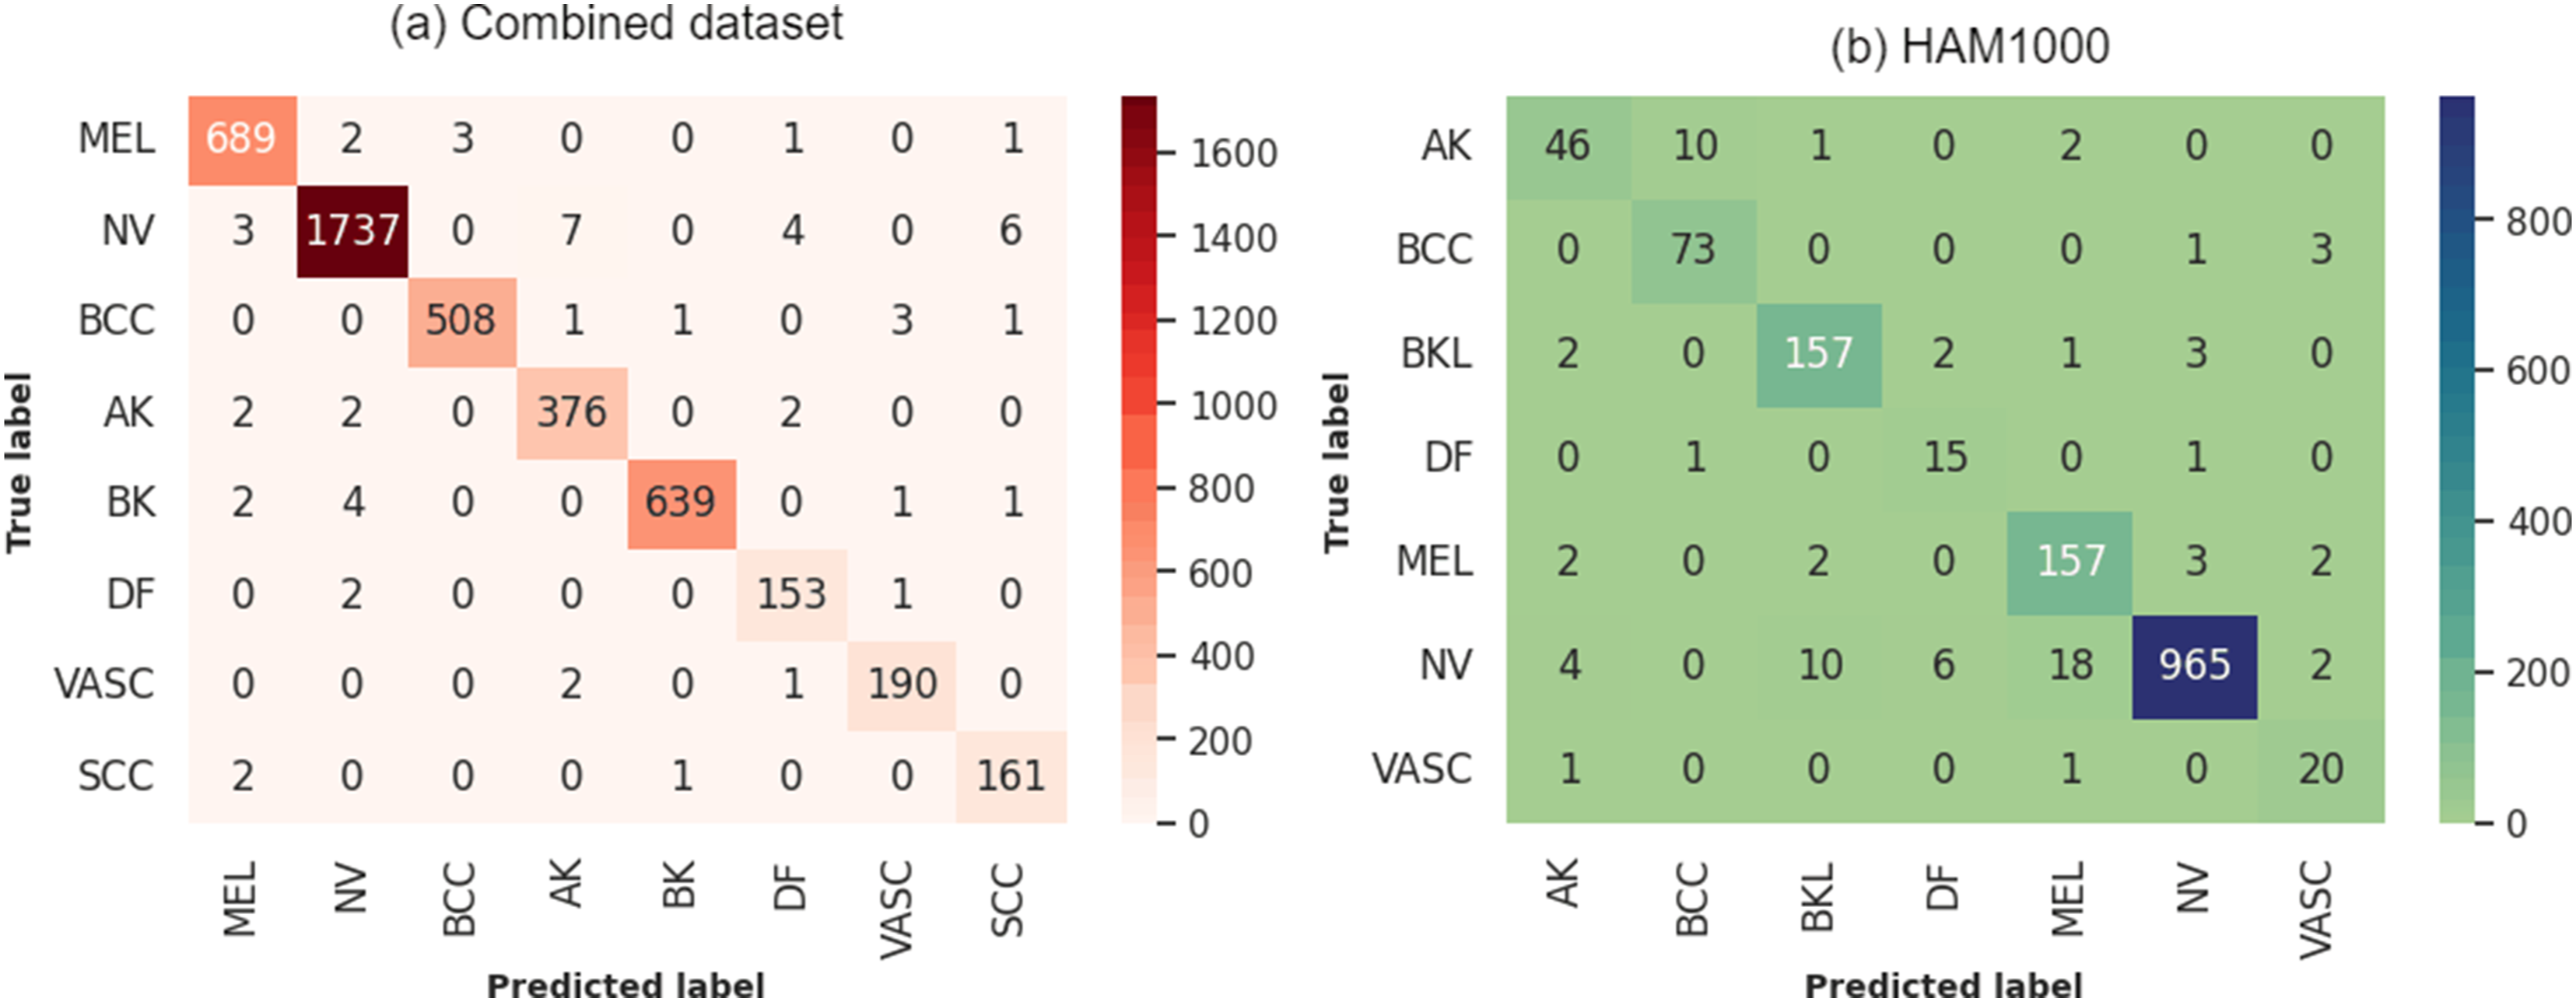
On HAM10000, the model exhibits its highest error rates with AK at 22.03% and DF at 16.67%, indicating significant challenges in correctly classifying these less prevalent types. VASC also shows a relatively high error rate of 9.09%, suggesting difficulties in distinguishing these from other classes. On the other hand, the model performs much better with common skin lesions such as NV, BK, and BCC, with error rates of 3.98%, 3.68%, and 5.19% respectively. These findings indicate that the model is highly effective in identifying lesions that occur more frequently in the dataset.
Figure 13 illustrates the hybrid model’s accuracy and loss over 50 epochs. The training and validation accuracy curves gradually increase and then level off, indicating that the model effectively learns the patterns from the training data. The close alignment of the training and validation accuracy curves across all folds suggests that the model generalizes well to new data. Similarly, the loss curves steadily decrease and stabilize, reflecting consistent learning progress. The minimal difference between the training and validation loss further supports the absence of overfitting. Any slight fluctuations in the validation loss can be attributed to variations in data characteristics across different folds rather than model instability. Learning curve of EfficientNetB0+RF for combined dataset.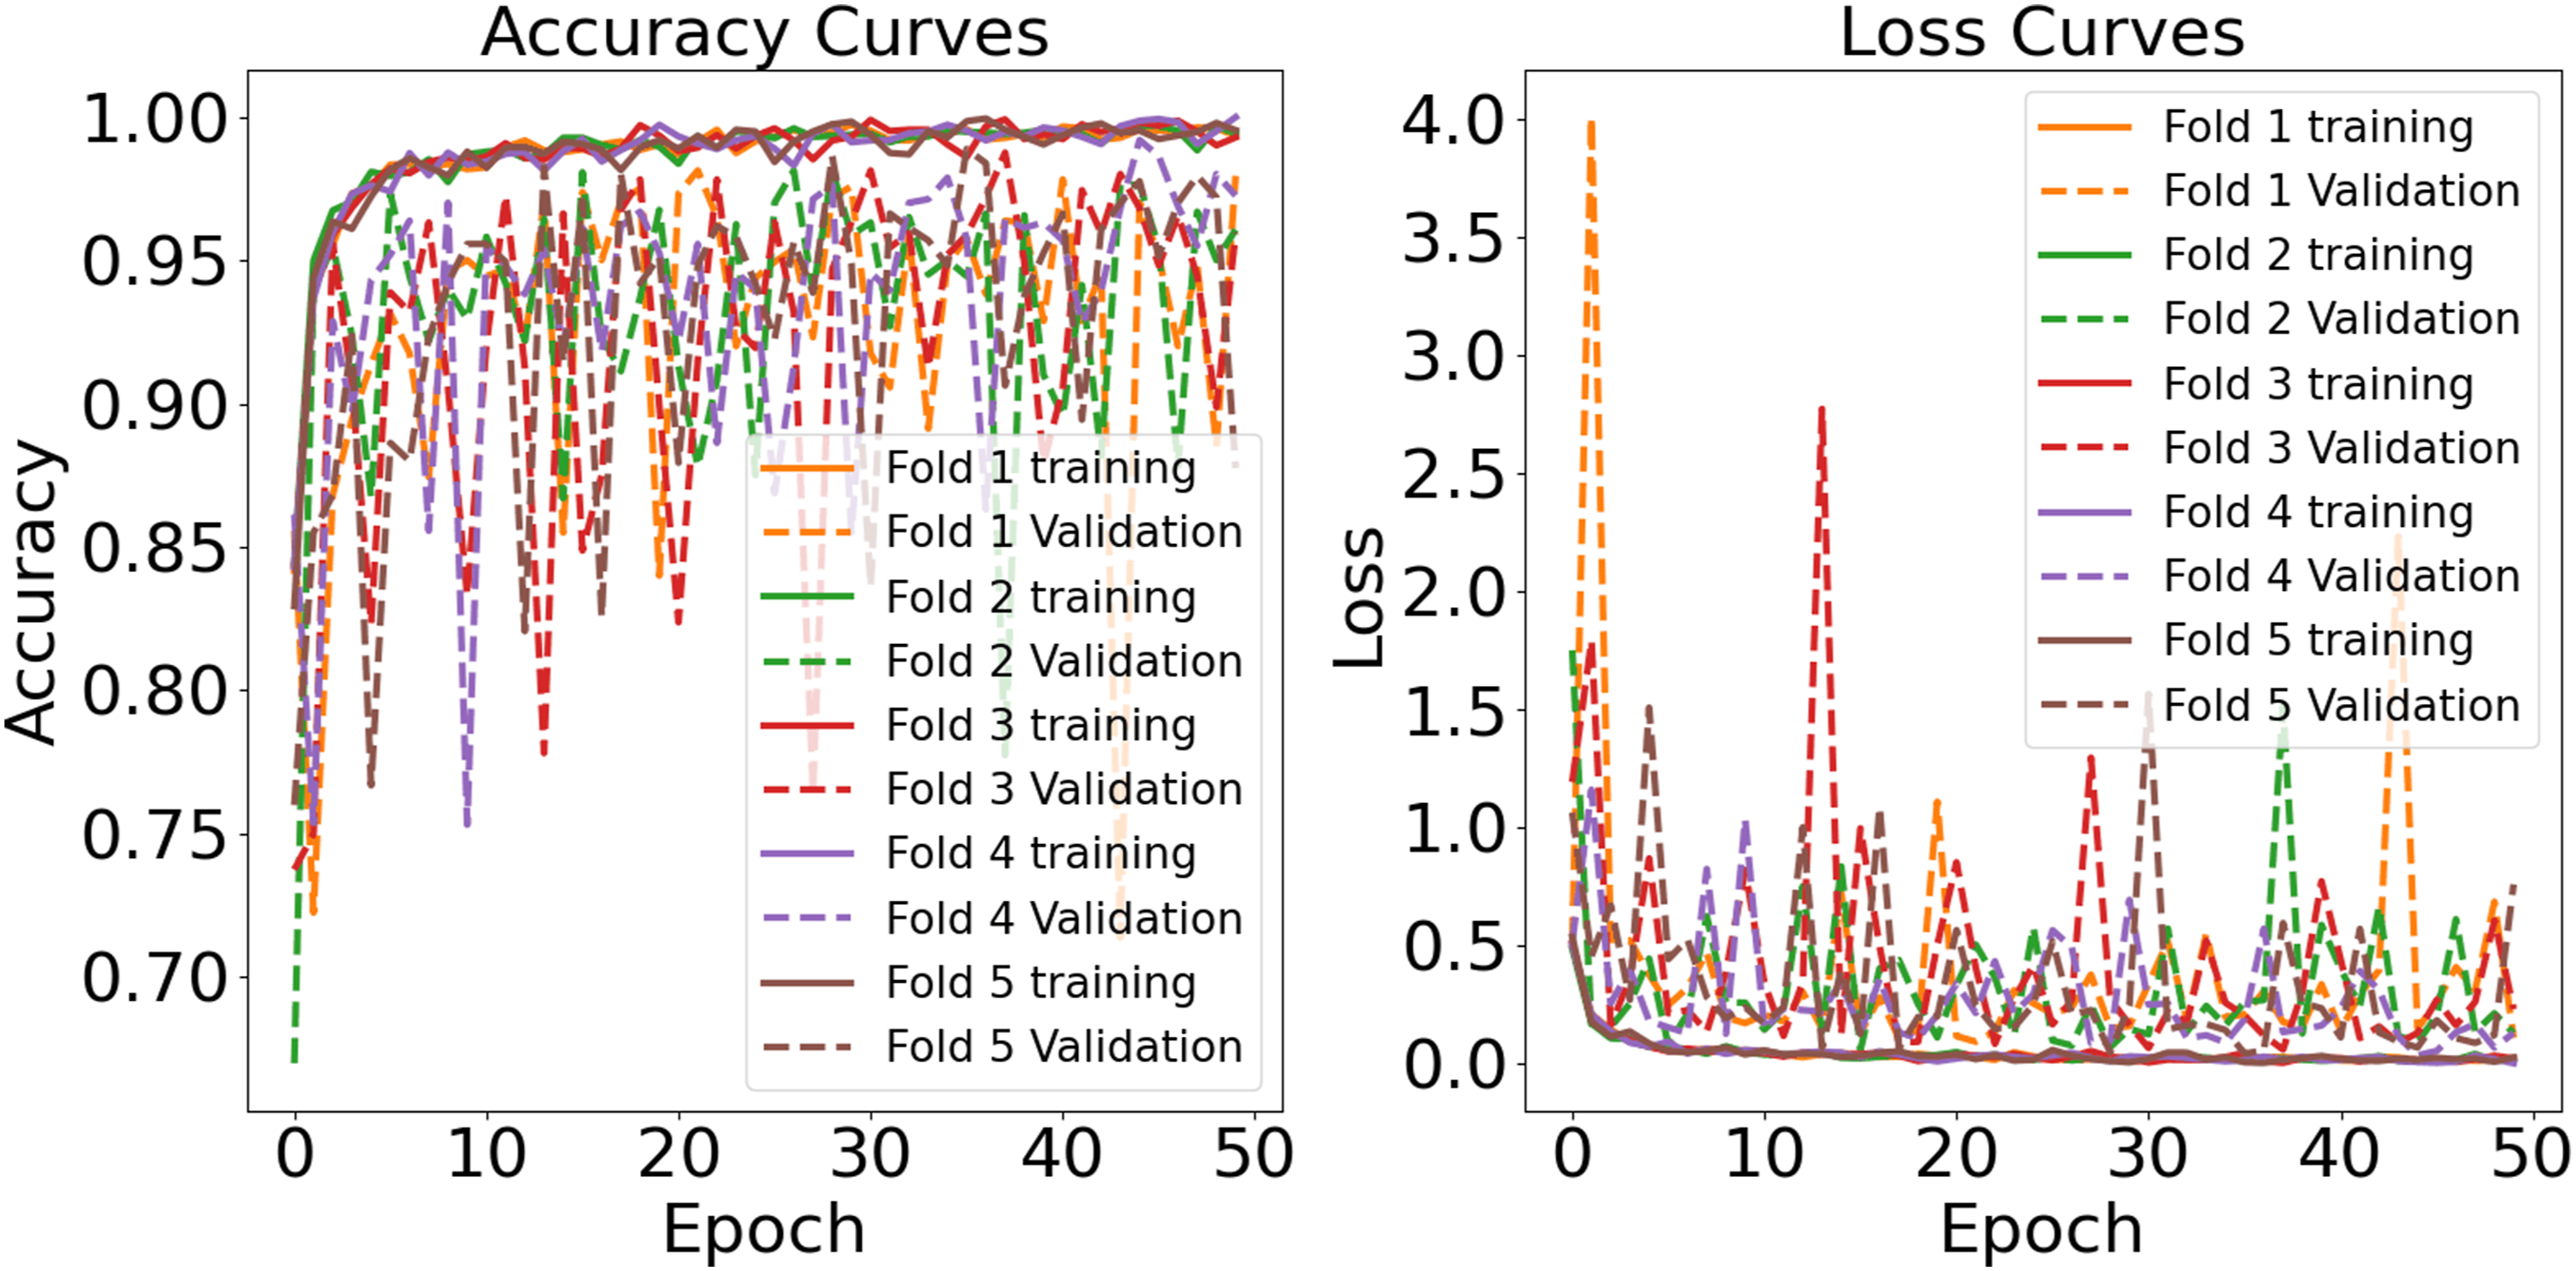
The learning curves for the hybrid model trained on the HAM10000 dataset (Figure 14) demonstrate effective generalization capabilities. The training accuracy for all five folds steadily increases from initial values around 0.70-0.75 to surpass 0.96 by the 50th epoch, indicating that the model optimizes well with the training data. Validation accuracy, while more variable, shows a similar upward trend, starting at approximately 0.80 and reaching up to 0.96 in some folds. Correspondingly, training loss decreases sharply in early epochs and levels below 0.5, demonstrating accurate predictions, while validation loss, despite being more erratic, generally trends downward, stabilizing significantly post the 30th epoch. Occasional spikes in validation loss highlight areas for potential model tuning to enhance stability and performance. Both curves suggest that the model is learning effectively without substantial overfitting, and is promising for real-world applications. Learning curve of EfficientNetB0+RF for HAM10000 dataset.
The ROC-AUC analysis of the EfficientNetB0+RF model shows strong classification performance on both datasets. In the Combined dataset (Figure 15(a)), the model achieves AUC scores between 0.97 and 0.99 across all classes, with lesion types such as MEL, BCC, and BK reaching an impressive AUC of 0.99. Even the lowest class, VASC, maintains a high AUC of 0.97, indicating solid prediction quality. In the HAM10000 dataset (Figure 15(b)), the model also shows high performance, with all classes scoring between 0.97 and 0.99. BCC and VASC classes hit 0.99, while BKL at 0.97 exceeds acceptable benchmarks. The ROC curves are steep and concentrated in the top-left area, indicating high sensitivity and specificity for all categories. The model handles various lesion types and dataset differences with minimal variance in AUC scores. This suggests that the RF classifier on EfficientNetB0 captures subtle inter-class differences effectively, without overfitting. Its reliable performance across larger and more standardized datasets supports its robustness in dermatological classification tasks. ROC AUC curves of EfficientNetB0+RF for (a) Combined dataset (b) HAM10000 datasets.
4.5. Explainability analysis
We conducted an in-depth qualitative and exploratory analysis using Grad-CAM on the experimental datasets. Figures 16 and 17 present Grad-CAM overlays for each class in the HAM10000 and combined datasets, respectively. For correctly classified samples, the highlighted regions often appear lesion-centric and frequently coincide with visually salient attributes that clinicians consider relevant (e.g., border irregularity, color variation, and asymmetry). For example, in MEL predictions, the heatmaps tend to emphasize darker, irregular margins and heterogeneous pigmentation, which are commonly associated with malignancy. Similarly, in BCC, attention maps sometimes accentuate nodular structures and translucent peripheral zones, consistent with reported clinical appearances. In benign cases such as NV and DF, the overlays often concentrate around uniformly pigmented central regions while placing less emphasis on surrounding skin, suggesting that the model can rely on localized cues for non-malignant lesions. Notably, for AK and SCC, the heatmaps occasionally capture subtle texture changes and localized erythema-like regions, which may reflect fine-grained patterns needed to separate pre-malignant from malignant conditions, although these cues are visually variable. Grad-CAM visualizations for each lesion type in the HAM10000 dataset. Grad-CAM visualizations for each lesion type in the combined dataset.

We also examined misclassified samples (Figure 18). In these cases, Grad-CAM suggests that the model still frequently attends to lesion-adjacent regions, but class-level visual overlap may contribute to confusion. For instance, an AK sample misclassified as DF shows diffuse erythema and surface granularity; the heatmap highlights texture-like areas that could plausibly resemble DF-related appearance. A BCC sample misclassified as VASC highlights central hemorrhagic regions, suggesting that vascular-like pigmentation may have influenced the decision. For MEL misclassified as SCC, the heatmap focuses on irregular pigmentation typical of MEL, while hyperkeratotic structures might have biased the prediction toward SCC. NV misclassified as SCC also shows attention near darker peripheral structures that can be interpreted as suspicious cues. For VASC misclassified as MEL, the model appears to prioritize darker-pigment regions, suggesting that color intensity may at times dominate over structural cues. Finally, for BKL misclassified as DF, the highlighted, uniform pigmented zones reflect the ongoing difficulty in distinguishing pigmented benign keratoses from DF in borderline presentations. Inaccurate Grad-CAM visualizations for each lesion type.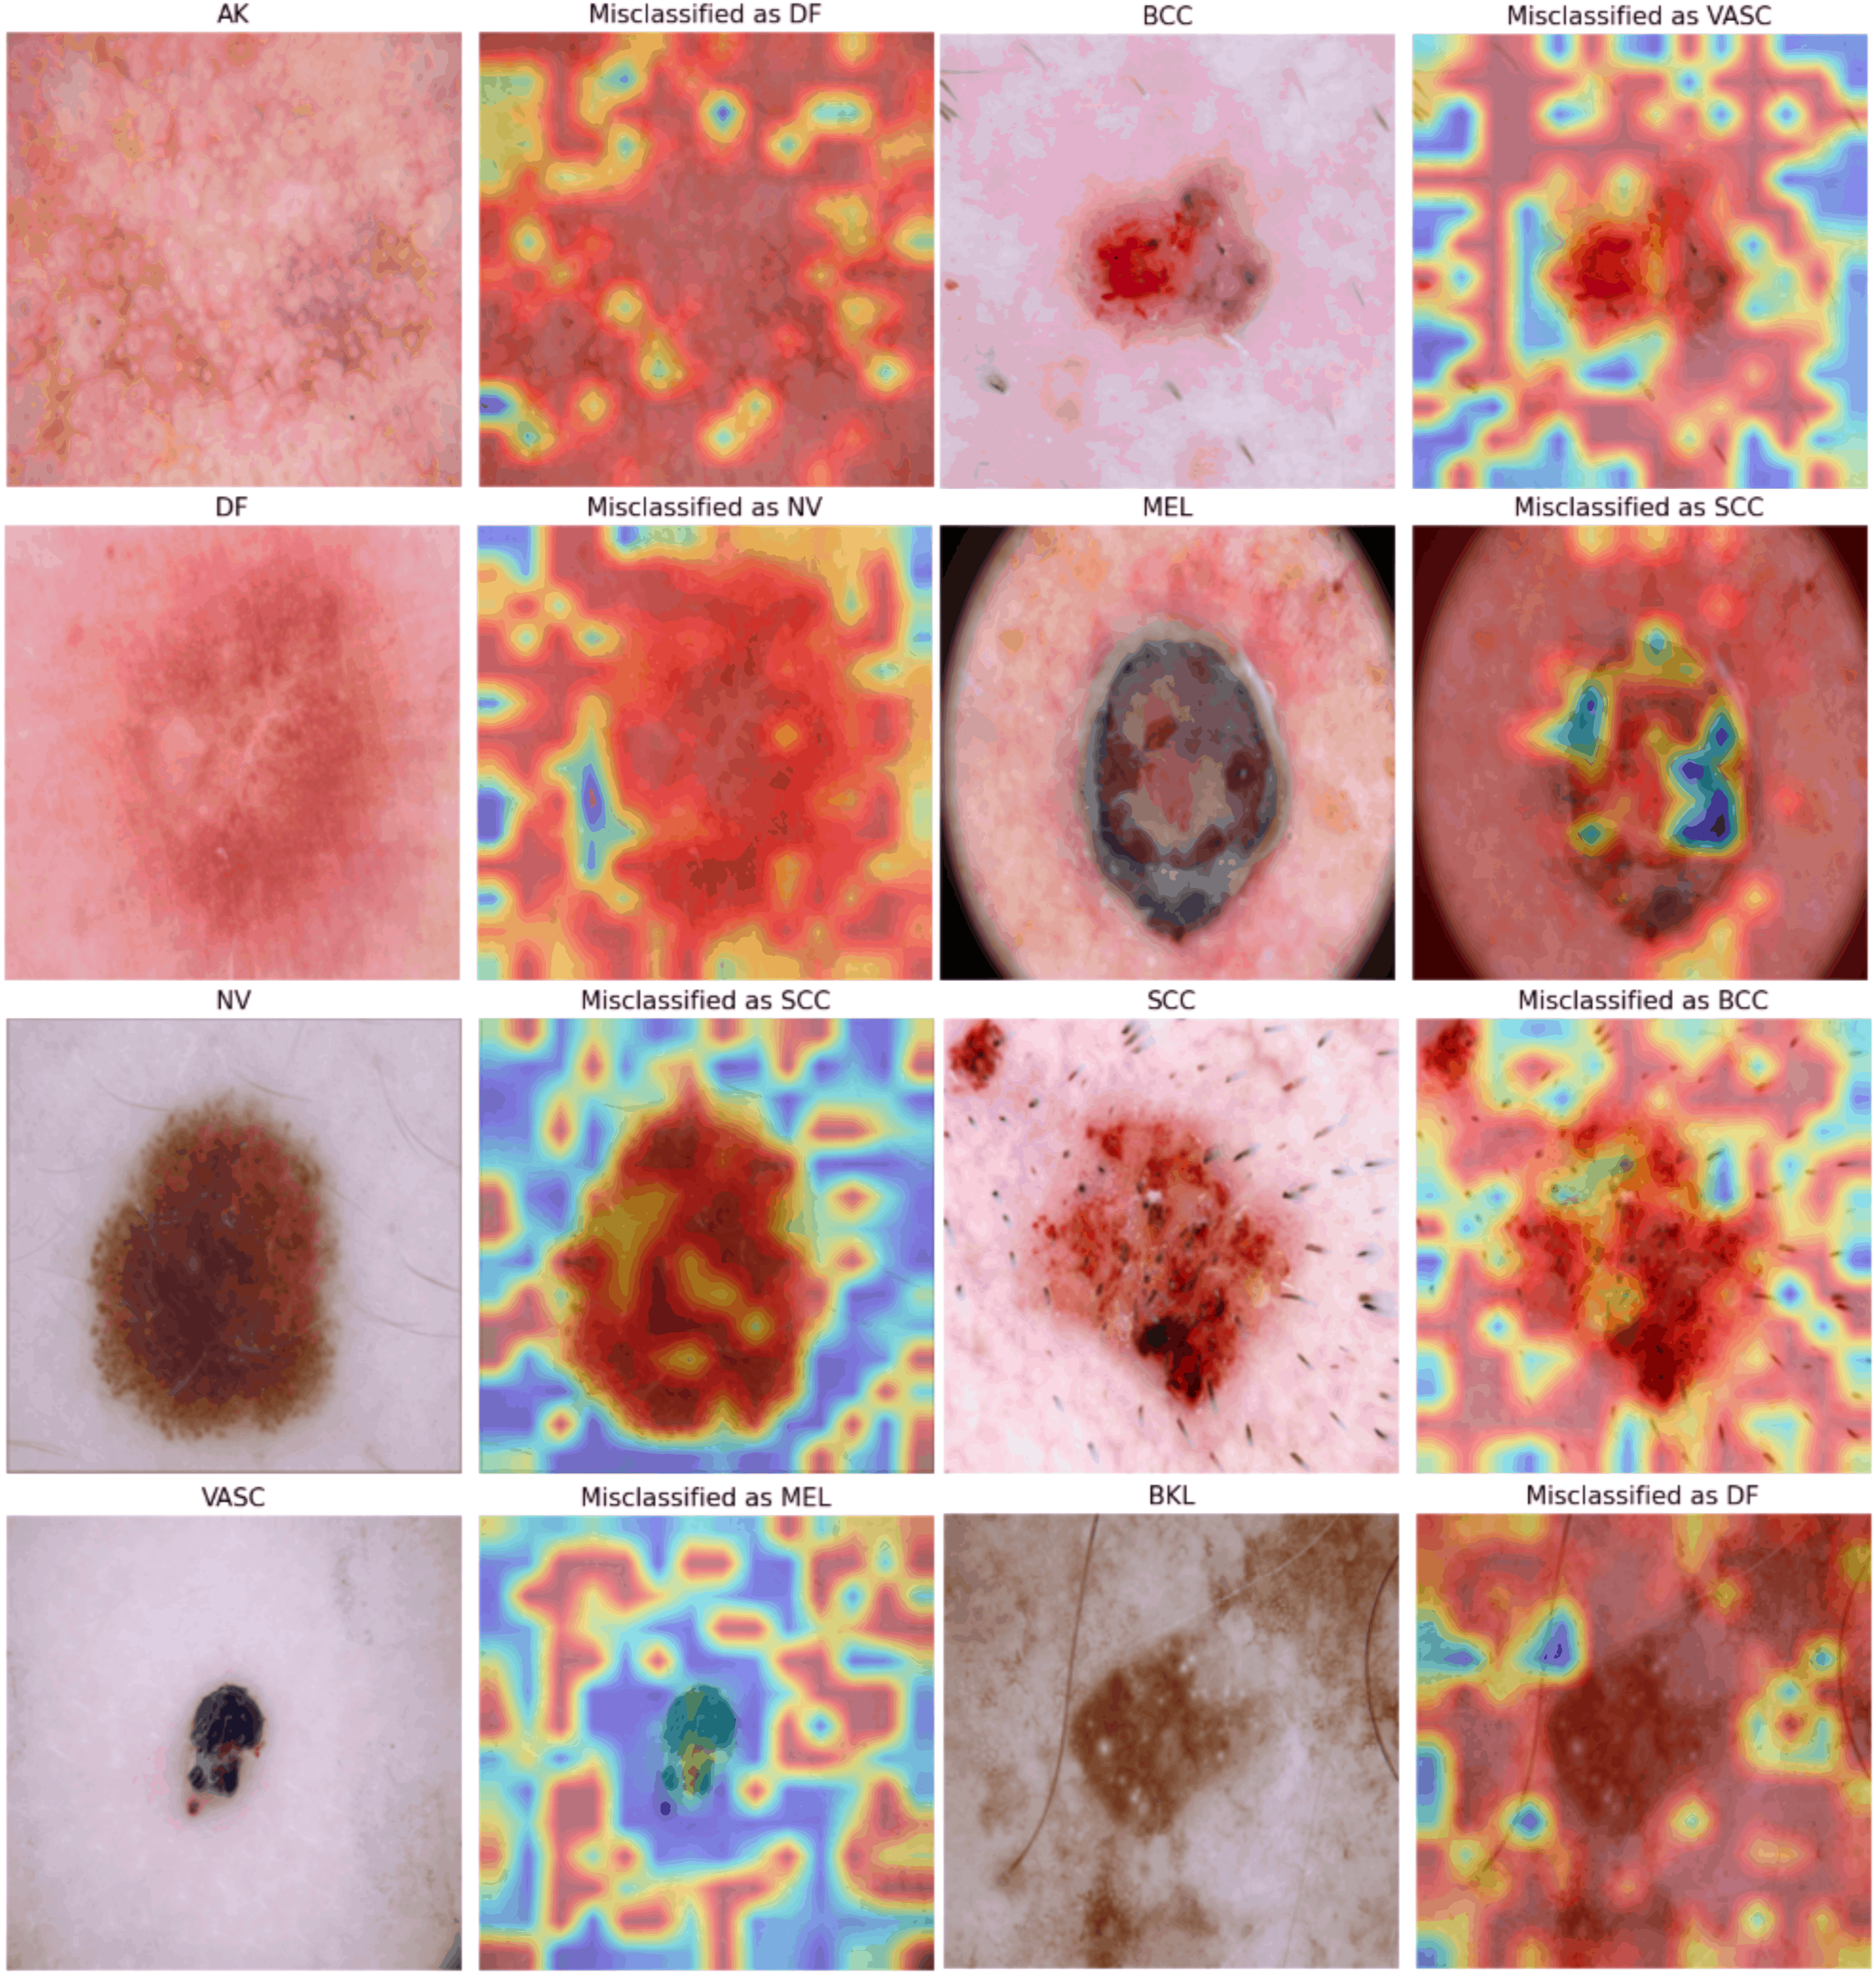
Class-wise Grad-CAM interpretability summary on the combined datasets. Grad-CAM focus was assessed for correctly classified samples, quantifying the percentage of cases where the attention maps primarily highlighted lesion-centric regions versus non-lesion or artifact regions, and whether the focus aligned with clinically relevant features.

We further observed that Grad-CAM visualizations can be less stable for underrepresented or visually diverse categories such as SCC, BKL, VASC, and DF. In these cases, saliency maps may appear noisier, less spatially concentrated, and harder to interpret clinically. This behavior is plausibly influenced by limited training samples, higher intra-class appearance variation, and ambiguous lesion boundaries, which can hinder the emergence of consistent class-specific activation patterns. Future work will explore whether targeted augmentation, class-aware regularization, higher-resolution feature extraction, or complementary explanation methods can yield more reliable and clinically interpretable visual evidence for these challenging categories.
It is crucial to recognize the known limitations of Grad-CAM, including coarse spatial resolution due to downsampling in convolutional backbones, sensitivity to layer selection, and the fact that saliency maps provide correlational rather than causal explanations. Nevertheless, the frequent overlap between highlighted regions and lesion-relevant structures in many test cases supports a plausible interpretation that the model often relies on meaningful image cues rather than spurious background signals. In practical settings, these overlays are best viewed as assistive visual summaries that can help clinicians quickly assess which regions may have influenced a prediction, without replacing clinical judgment or prospective validation in real workflows.
4.6. Web application
The application is built on the Flask framework and uses a hybrid model for classification. As shown in Figure 19, it has a user-friendly interface that allows users to upload dermoscopic images and receive fast, reliable classifications. The application is designed to seamlessly integrate into clinical workflows, providing professionals with accurate and interpretable classifications of skin lesions. By automating the initial classification process, the application allows clinicians to focus their time on more complex cases, improving overall efficiency in busy environments. Table 15 reports the average time per image over 500 test samples for the end-to-end web application. The average inference time per image rose from 47.3 ms to 54.8 ms in the standalone pipeline and from 65.4 ms to 74.6 ms in the full web application workflow, with increases of about 15.9% and 14.0%, respectively. This increase is acceptable given the added benefit of Grad-CAM, which allows clinicians to visualize heatmaps of lesions in real-time without significantly obstructing decision-making. The system keeps inference times under 100 ms per image, ensuring efficient patient throughput and smooth integration into teledermatology or in-clinic screenings. Explainable web application interface. Inference time analysis with and without Grad-CAM integration.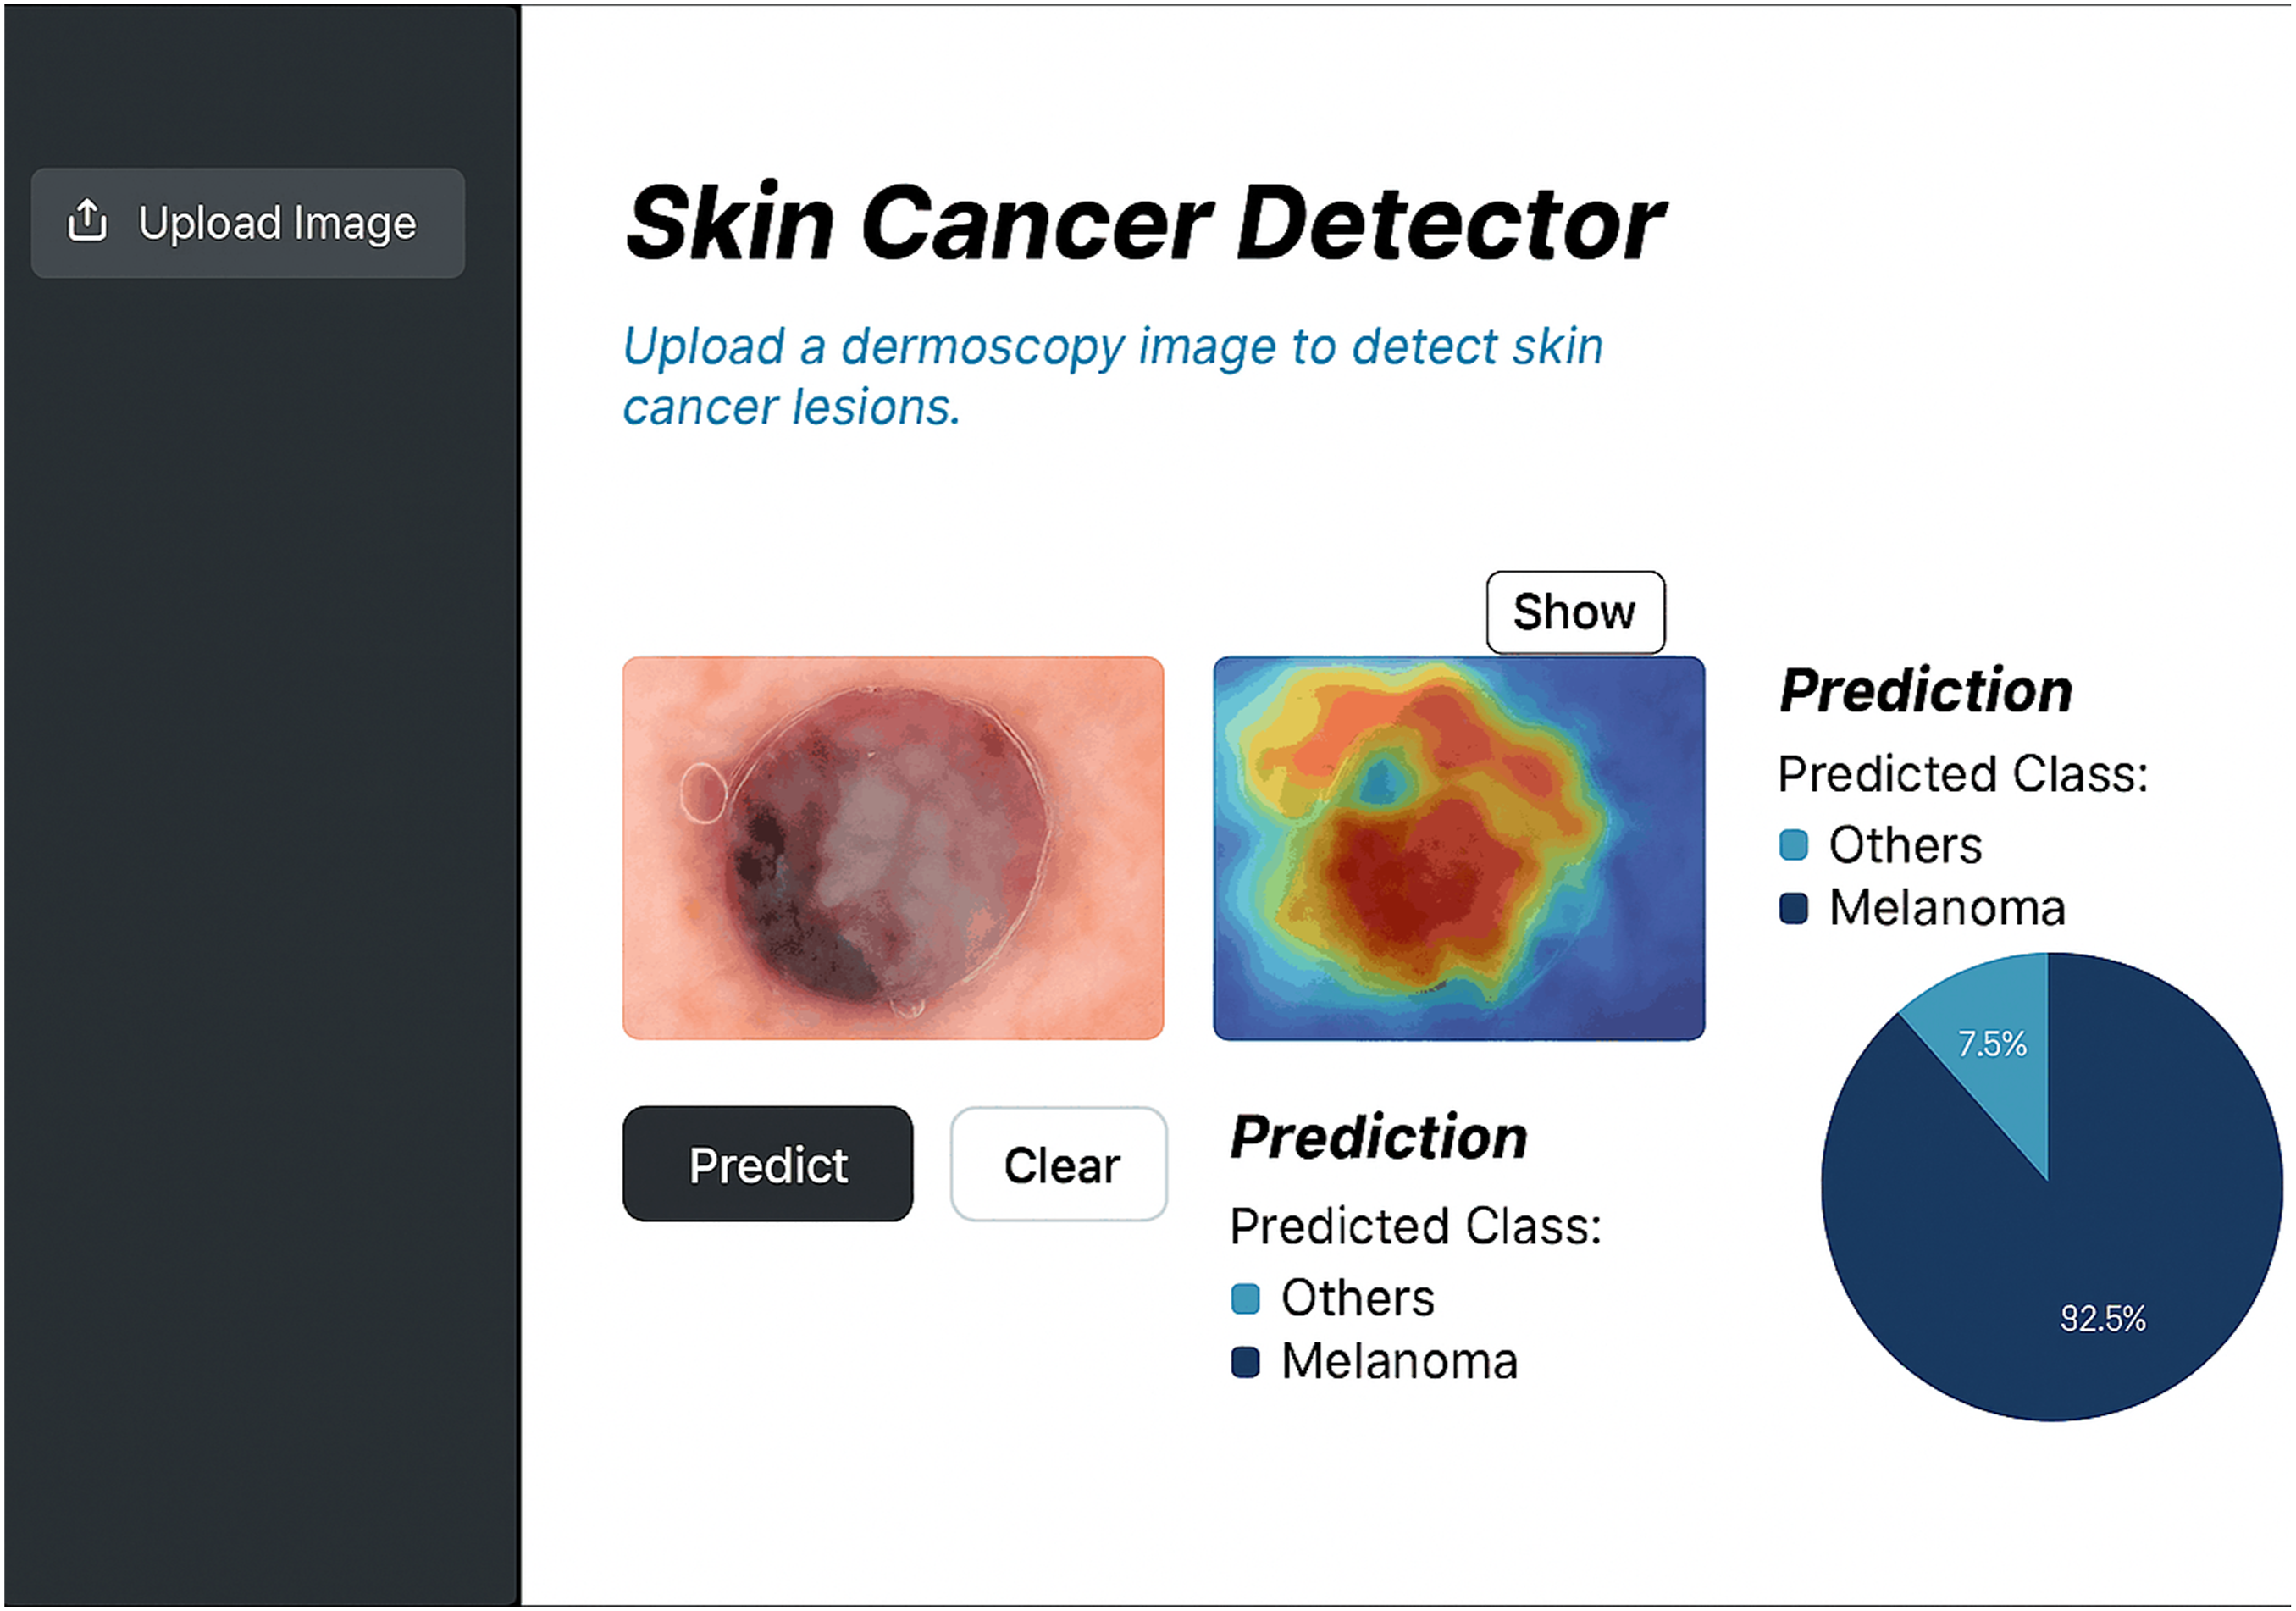

The application is crucial in improving early detection rates for skin cancer. It provides fast and accurate identification of suspicious lesions, which helps in timely intervention, especially for aggressive cancers like melanoma. The tool’s immediate feedback reduces the time between assessment and treatment, ultimately improving patient outcomes. The application is designed for use in various healthcare settings, from large hospitals to smaller clinics, and can be accessed remotely by patients for preliminary assessments. This broadens access to diagnostic resources, especially in regions with limited availability of dermatology specialists, and promotes proactive healthcare practices. Additionally, the web application serves as an educational and research tool. It can be used by students, researchers, and educators to study and analyze skin cancer classification techniques, making it a versatile resource that supports both clinical practice and academic inquiry.
4.7. SOTA comparison
Comparative analysis with prior research works.

SWNet 61 achieved top performance with 99.86% accuracy and 99.95% F1-score on large-scale datasets (ISIC19/20). SM-ViT 69 followed with 98.37% accuracy and 99.11% F1-score. CNN-PSO-ML 64 and DenseNet121 67 also had high accuracies of 98.5% and 98.0%, respectively, with F1-scores over 97%. EfficientNet variants 68 achieved 97.58% accuracy across eight categories. TIxAI 65 recorded a lower accuracy of 90.1% on ISIC-2017 but contributed to quantitative trustworthiness in XAI evaluation. Fuzzy Rank-Based Ensembles 62 and ResNet50 in SkinSage XAI 70 reached 94.94% and 94.3% accuracy, balancing multi-class classification and interpretability. None of the previous studies have implemented a web-based tool. Our application bridges the gap between research and real-world clinical practice. Its ease of use and the interpretability provided by RF make it especially valuable for healthcare professionals seeking quick and reliable decisions in clinical workflows.
Our hybrid approach has a key strength in handling class imbalance. Models like DenseNet169 and VGG16 often perform well on the majority classes but struggle to generalize to minority classes, such as melanoma. To address this issue, we have included RF in our model, which leverages ensemble learning and bootstrapping to improve the model’s ability to balance predictions across all classes. This is evident in the consistently high F1-scores on both the ISIC 2019 and HAM10000 datasets, indicating that our model performs well on both majority and minority classes, unlike other state-of-the-art methods that show a drop in F1-scores for minority classes. Additionally, RF’s feature importance rankings contribute to better interpretability, providing a distinct advantage over more complex models like InceptionResNetV2 55 and Xception, 46 which, despite their strong performance, operate more like black-box models, making their decisions harder to interpret in a clinical setting.
It is also essential to consider the trade-offs in terms of computational complexity. Models like InceptionResNetV2 55 and Xception 46 have larger parameter sizes and require significantly longer training and inference times compared to our hybrid model. EfficientNetB0’s compound scaling ensures high performance with fewer parameters and reduced computational overhead, making it more efficient for real-world clinical use, where quick and reliable results are needed. For example, InceptionResNetV2 55 achieved 94.65-95.35% accuracy on the ISIC-2019 and PH2 datasets but at the cost of increased computational complexity and longer training times. In contrast, EfficientNetB0 + RF achieves comparable or superior accuracy with fewer resources, making it more suitable for environments with limited computational power.
Recent approaches such as ViTs50–52 have shown promise in image classification tasks. While they have not been extensively tested on the same datasets, they offer potential scaling and attention mechanisms strengths. However, they come with trade-offs, such as higher computational cost and longer inference times, 90 which may limit their practicality in clinical settings where real-time results are needed. Our model, by contrast, strikes a balance between accuracy, generalization, and computational efficiency, making it an optimal choice for both large hospitals and smaller environments.
5. Discussion
This study demonstrates that hybrid models can outperform traditional transfer learning approaches in the task of skin cancer classification. The proposed EfficientNetB0+RF hybrid model achieved superior performance compared to standalone EfficientNetB0 and other transfer learning models across multiple datasets, including HAM10000 and the combined ISIC 2019 + DermNet datasets. The success of this hybrid architecture can be attributed to several key factors. Firstly, EfficientNetB0 effectively balances model size and accuracy, capturing hierarchical feature representations with fewer parameters, thereby reducing computational overhead while maintaining high predictive performance. The integration of the RF component enhances decision stability at the classifier stage, while spatial interpretability is provided via Grad-CAM from the EfficientNetB0 backbone. This combination allows the model to generalize well to unseen and challenging cases, a capability reflected in its robust performance across diverse datasets. These methods mitigated the effects of class imbalance and data scarcity, ensuring that the model could learn from a more representative set of lesion variations.
A major contribution of this study is the integration of XAI to provide lesion-focused visual explanations that illustrate which image regions may be influencing each prediction. Rather than definitively validating the decision process, these overlays suggest that the model often relies on diagnostically relevant cues instead of obvious background regions. The Grad-CAM visualizations also provide an exploratory way to examine failure modes: in some misclassified cases, the highlighted regions appear less well aligned with the lesion, indicating possible sensitivity to artifacts or visually ambiguous patterns. Such observations can help prioritize refinements in preprocessing and data augmentation. It may also support a human-in-the-loop workflow by improving transparency during review. Through the web application, clinicians can inspect heatmaps alongside predictions during inference and use them as supporting context when judging whether the model’s output aligns with clinical expectations. This can promote more cautious use and ease responsible deployment. In addition, the model’s efficiency and the web-based interface make the system more feasible for smaller clinics and low-resource settings, allowing practical image upload and rapid screening support without requiring advanced computing infrastructure. A major contribution of this study is the integration of XAI to provide lesion-focused visual explanations that illustrate which image regions may be influencing each prediction. Rather than definitively validating the decision process, these overlays suggest that the model often relies on diagnostically relevant cues instead of obvious background regions. The Grad-CAM visualizations also provide an exploratory way to examine failure modes: in some misclassified cases, the highlighted regions appear less well aligned with the lesion, indicating possible sensitivity to artifacts or visually ambiguous patterns. Such observations can help prioritize refinements in preprocessing and data augmentation. It may also support a human-in-the-loop workflow by improving transparency during review. Through the web application, clinicians can inspect heatmaps alongside predictions during inference and use them as supporting context when judging whether the model’s output aligns with clinical expectations. This can promote more cautious use and ease responsible deployment. In addition, the model’s efficiency and the web-based interface make the system more feasible for smaller clinics and low-resource settings, allowing practical image upload and rapid screening support without requiring advanced computing infrastructure.
Despite the promising results, several limitations must be acknowledged. One challenge is the absence of grid search or Bayesian optimization. Future studies could explore these strategies to refine model parameters further. Class imbalance, while partially addressed using class-weighted loss, remains a persistent challenge. Its loss may not fully capture the variability present in real-world lesion presentations and could introduce oversampling artifacts. Future research could explore cost-sensitive learning, focal loss, or advanced oversampling techniques to further mitigate class imbalance impacts. Furthermore, while the hybrid model demonstrated high accuracy in classification tasks, its applicability to other computer vision tasks such as object detection, semantic segmentation, or multimodal medical analysis has not yet been explored. Extending this hybrid approach to these domains may reveal similar benefits in performance and interpretability. Finally, the effectiveness of transfer learning diminishes in highly specialized domains where available datasets are limited in diversity and size. To mitigate overfitting risks, future studies should consider domain-specific data augmentation to expand training datasets while maintaining clinical relevance.
The datasets used in this study exhibit potential sources of bias. Most images correspond to relatively limited ranges of skin tone and acquisition conditions, and are predominantly collected from a small number of centres and devices. As a result, the model may implicitly learn dataset-specific characteristics and might not generalize equally well to underrepresented populations, imaging devices, or geographical regions. Future work will therefore focus on curating and integrating more diverse, multi-ethnic skin lesion datasets, including images acquired with different dermoscopy systems to systematically assess and mitigate demographic and device-related bias. The present evaluation is restricted to internal cross-validation and does not include external or multi-centre validation. All experiments are conducted on publicly available datasets and a single institutional collection, without testing on independent cohorts from different hospitals or dermoscopy systems.
The reported performance should be interpreted as evidence of promise rather than definitive proof of clinical robustness. As a next step, we plan to conduct external validation on independent multi-centre datasets and, ultimately, design prospective clinical studies that evaluate the system as a decision-support tool within real-world dermatology workflows. The RF head of the hybrid model remains a black box in terms of its internal decision boundaries. Although the Grad-CAM maps provide useful qualitative insights into which regions of the lesion drive the convolutional feature extractor, they do not fully capture the contribution of the RF component. Future work will explore hybrid interpretability strategies that combine saliency-based methods for the convolutional backbone with feature-attribution techniques for tree-based models, with the goal of delivering end-to-end explanations that are both faithful to the hybrid pipeline and verifiable by dermatology experts.
6. Conclusion
Our proposed model shows strong performance and fair generalization across various datasets by effectively preprocessing data and addressing class imbalance. A web application has been developed for real-time lesion classification, minimizing workflow disruption. Grad-CAM visualizations provide a preliminary view of which regions may be influencing predictions, and can be used to explore model behavior during review. Key limitations include a bias in datasets favoring lighter skin tones, which may affect generalizability to diverse populations. Future work will aim to expand and diversify training datasets, using controlled synthetic data. Integrating multi-modal information, such as clinical metadata and histopathology, could improve diagnostic accuracy. Overall, this research presents an interpretable and scalable solution that merges high diagnostic accuracy with practical application in data-driven skin cancer diagnosis.
Footnotes
Acknowledgements
The authors extend their appreciation to the Princess Nourah bint Abdulrahman University Researchers Supporting Project number (PNURSP2026R513), Princess Nourah bint Abdulrahman University, Riyadh, Saudi Arabia.
Ethical considerations
Ethical approval was not required as this study data is open sourced, and the original research have already conducted.
Author contributions
Conceptualization, A.A.S., S.M.M.R.S., F.A., A.B.M., M.I.H.B., S.K., R.H., K.G.K.; Methodology, S.M.M.R.S., A.A.S., A.B.M., M.I.H.B., F.A., S.K.; Software, A.A.S., R.H., K.G.K.; Validation, T.J.A., M.I.H.B., S.M.M.R.S., K.G.K.; Formal analysis, T.J.A., F.A., A.B.M., M.I.H.B., S.K., R.H.; Investigation, A.A.S., S.M.M.R.S., F.A., A.B.M., K.G.K.; Resources, A.B.M., M.I.H.B., S.K., S.M.M.R.S., T.J.A.; Data curation, S.K., A.A.S., F.A., A.B.M.; Writing—original draft, A.A.S., S.M.M.R.S. F.A., A.B.M., M.I.H.B., S.K.; Writing—review & editing, A.A.S., S.M.M.R.S., R.H., T.J.A., K.G.K., M.A.M.; Visualization, S.M.M.R.S., F.A., A.B.M., M.I.H.B., S.K.; Supervision, T.J.A. and M.A.M.; Funding acquisition, M.A.M. All authors have read and agreed to the published version of the manuscript.
Funding
This study did not receive any financial support from public, commercial, or not-for-profit funding agencies.
Declaration of conflicting interests
The authors declare that the research was conducted in the absence of any commercial or financial relationships that could be construed as a potential conflict of interest.
Data Availability Statement
The datasets used and/or analysed during the current study are available from the corresponding author on reasonable request.