
Abstract
Objective
Cardiovascular disease constitutes the primary cause of mortality in long-term breast cancer (BC) survivors, yet predictive tools for cardiovascular-specific survival (CSS) in those with a second primary cancer (SPC) remain limited. This study aims to develop a machine learning (ML) model predicting CSS in BC patients with SPC (BC-SPC).
Methods
Patients with BC-SPC diagnosed between 2010 and 2021 were identified from the surveillance, epidemiology, and end results (SEER) database. After screening variables through Least absolute shrinkage and selection operator (LASSO) regression, five predictive models were constructed respectively: extreme gradient boosting (XGBoost), Cox proportional hazards model, random survival forest (RSF), DeepSurv, and support vector machine (SVM). Model performance was assessed using the concordance index (C-index), area under the receiver operating characteristic curve (AUC), calibration curves and decision curve analysis (DCA). Performing SHapley Additive exPlanations (SHAP) analysis and visualization for the optimal model.
Results
A total of 22,814 BC-SPC patients were included. Among these, 565 cardiovascular disease-specific deaths occurred, with cumulative incidence rates of 1.29%, 3.06%, and 4.30% at 5, 8, and 10 years, respectively. RSF demonstrated optimal performance, with a C-index of 0.749 in training set and 0.752 in validation set. Time-dependent AUCs at 5, 8, and 10 years were 0.774, 0.761, and 0.766 for the training set, and 0.752, 0.769, and 0.760 for the validation set, respectively. DCA indicated favorable net benefit across relevant thresholds. SHAP analysis revealed that age, radiation, marital status, chemotherapy, surgery, race, and sex are the key drivers in descending order of importance. Based on RSF risk scores, significant differences in CSS were observed among the groups (log-rank p < 0.001). A Shiny-based web tool was developed for personalized prediction.
Conclusion
The RSF model with SHAP interpretation offers an accurate, user-friendly tool for individualized CSS prediction in BC- SPC and supports precision risk management.
Keywords
Introduction
Breast cancer (BC)is one of the most common malignancies among women worldwide. Advances in diagnostic and treatment have significantly extended patient survival. However, this progress has also led to long-term complications and the risk of second primary cancers (SPCs) as critical determinants of prognosis.1,2 Cohort studies have shown that the incidence of SPCs among BC survivors is markedly higher than in the general population, with pathogenesis involving a combination of genetic susceptibility, treatment-related toxicity, and environmental exposures. 3 For instance, breast cancer survivors carrying BRCA1 and BRCA2 pathogenic variants are at high risk of SPCs 4 ; radiotherapy and chemotherapy, by inducing DNA damage or immunosuppression, may increase the incidence of SPCs such as lung cancer and hematologic malignancies. 5 At the same time, comprehensive breast cancer treatments—including anthracycline-based chemotherapy, radiotherapy, and targeted therapies—while improving survival rates, can also induce cardiotoxicity, leading to myocardial injury and metabolic disturbances, thereby raising the risk of cardiovascular disease (CVD) mortality, which has become the leading cause of non–cancer mortality among BC survivors. 6 Therefore, proactive prevention and management of cardiovascular complications have become essential components of clinical care.
However, dynamic interactions between clinical baseline characteristics and treatment-induced toxicities constitute a multifaceted risk network. This complexity not only influences the occurrence of SPCs but also exacerbates the development and adverse outcomes of CVD. Consequently, SPC risk and cardiovascular complications in breast cancer patients become intertwined, greatly increasing the complexity of clinical decision-making and prognostic assessment. Their combined effects pose a dual threat to long-term patient health.7,8 However, existing research has predominantly focused on SPC or CVD risk in isolation, lacking systematic investigation of cardiovascular mortality risk in BC patients with SPC (BC-SPC). Particularly, no dynamic prediction model integrating clinical characteristics and treatment parameters has yet been established.9,10
Traditional statistical methods exhibit significant limitations in handling high-dimensional data, nonlinear relationships, and complex variable interactions, making it difficult to comprehensively dissect the multifaceted risk factors influencing cardiovascular outcomes. In recent years, machine learning (ML) has been widely adopted in cancer risk prediction and prognostic assessment due to its superior data processing and modeling capabilities. 11 Predictive models built on algorithms such as random survival forest (RSF), extreme gradient boosting (XGBoost), and support vector machine (SVM) have been successfully applied to BC recurrence risk evaluation, multi-omics data integration, and neoadjuvant chemotherapy efficacy prediction. Compared with traditional approaches, these ML algorithms demonstrate unique advantages in feature selection, precise dynamic risk stratification, and model generalizability.12,13
Therefore, this study utilized a prospective cohort from the U.S. Surveillance, Epidemiology, and End Results (SEER) database to systematically develop and compare the predictive performance of Cox regression model and four survival ML models (RSF, SVM, XGBoost, and DeepSurv) for cardiovascular-specific survival (CSS) in BC-SPC patients. Further, SHapley Additive exPlanations (SHAP) interpretability analysis was adopted to quantify the contribution of risk factors in the optimal model, and an interactive web-based prediction tool was developed to support clinical translation for personalized risk assessment and dynamic health management.
Patients and methods
Data source
Data was accessed and extracted from the SEER database using SEER*Stat (version 8.4.3), in accordance with the SEER Data Access Policy and the SEER Research Data Use Agreement. Currently, this database covers approximately 48% of the U.S. population and aggregates information from 21 population-based cancer registries nationwide. 14 We extracted records of breast cancer patients with second primary cancers diagnosed between 2010 and 2021. As SEER is a publicly available anonymized database and this study strictly adhered to its published research guidelines, no additional ethical approval was required, and the requirement for informed consent was waived.
Study variables
Study variables included: (1) demographic characteristics (sex, marital status, race, age); (2) tumor characteristics (grade, laterality, histology, TNM stage according to the AJCC 7th edition); (3) hormone receptor status (human epidermal growth factor receptor 2 [HER2], progesterone receptor [PR], estrogen receptor [ER]); (4) treatment modalities (surgery, radiotherapy, chemotherapy); (5) outcome measures (cardiovascular-specific death status, survival time). Treatment information was extracted from SEER “first course of therapy” fields. Definition of SPC was defined strictly adhering to the SEER Multiple Primary and Histology Coding Rules. Patients were included only if they had a first primary malignancy of BC followed by a distinct second primary malignancy (Sequence Number=02). The index date was the diagnosis of the SPC. Follow-up for all patients began at this time point and continued until CVD-specific death, censoring, or the end of study period. Figure 1 shows the study design timeline.

Study design timeline. BC, breast cancer; SPC, second primary cancer.
Inclusion criteria were:(1) pathologically confirmed primary invasive breast cancer diagnosed during 2010–2021;(2) age ≥18 years at diagnosis; (3) survival time ≥12 months post-diagnosis. Exclusion criteria comprised:(1) ≥ 3 primary malignancies; (2)single primary breast cancer;(3) non-histologically confirmed diagnosis;(4) Stage IV;(5) unevaluable histologic grade;(6) undergoing prophylactic contralateral mastectomy;(7) missing key variables.
Statistical methods
Statistical analyses, modeling, and evaluations were performed using R software (version 4.4.2). Patients with BC-SPC were randomly stratified into training and validation sets in a 7:3 ratio. Categorical variables were compared using the χ2 test or Fisher's exact test, with a two-sided p < 0.05 considered statistically significant.
Based on the training cohort, predictors were selected via LASSO regression, and a prognostic nomogram was constructed using multivariable Cox proportional hazards modeling. The remaining four models (RSF, SVM, XGBoost, and DeepSurv) underwent hyperparameter tuning in the training set via grid search combined with 10-fold cross-validation to identify the optimal parameters.
The performances of the five models were evaluated in both the training and validation sets. The following metrics were used: the concordance index (C-index) and time-dependent areas under the receiver operating characteristic curves (AUCs) at 5-, 8-, and 10-year intervals to assess each model's discriminative ability. Calibration curves were used to evaluate the agreement between predicted and observed outcomes. Decision curve analysis (DCA) was performed to calculate the clinical net benefit of each model. The workflow for model development and validation is shown in Figure 2.
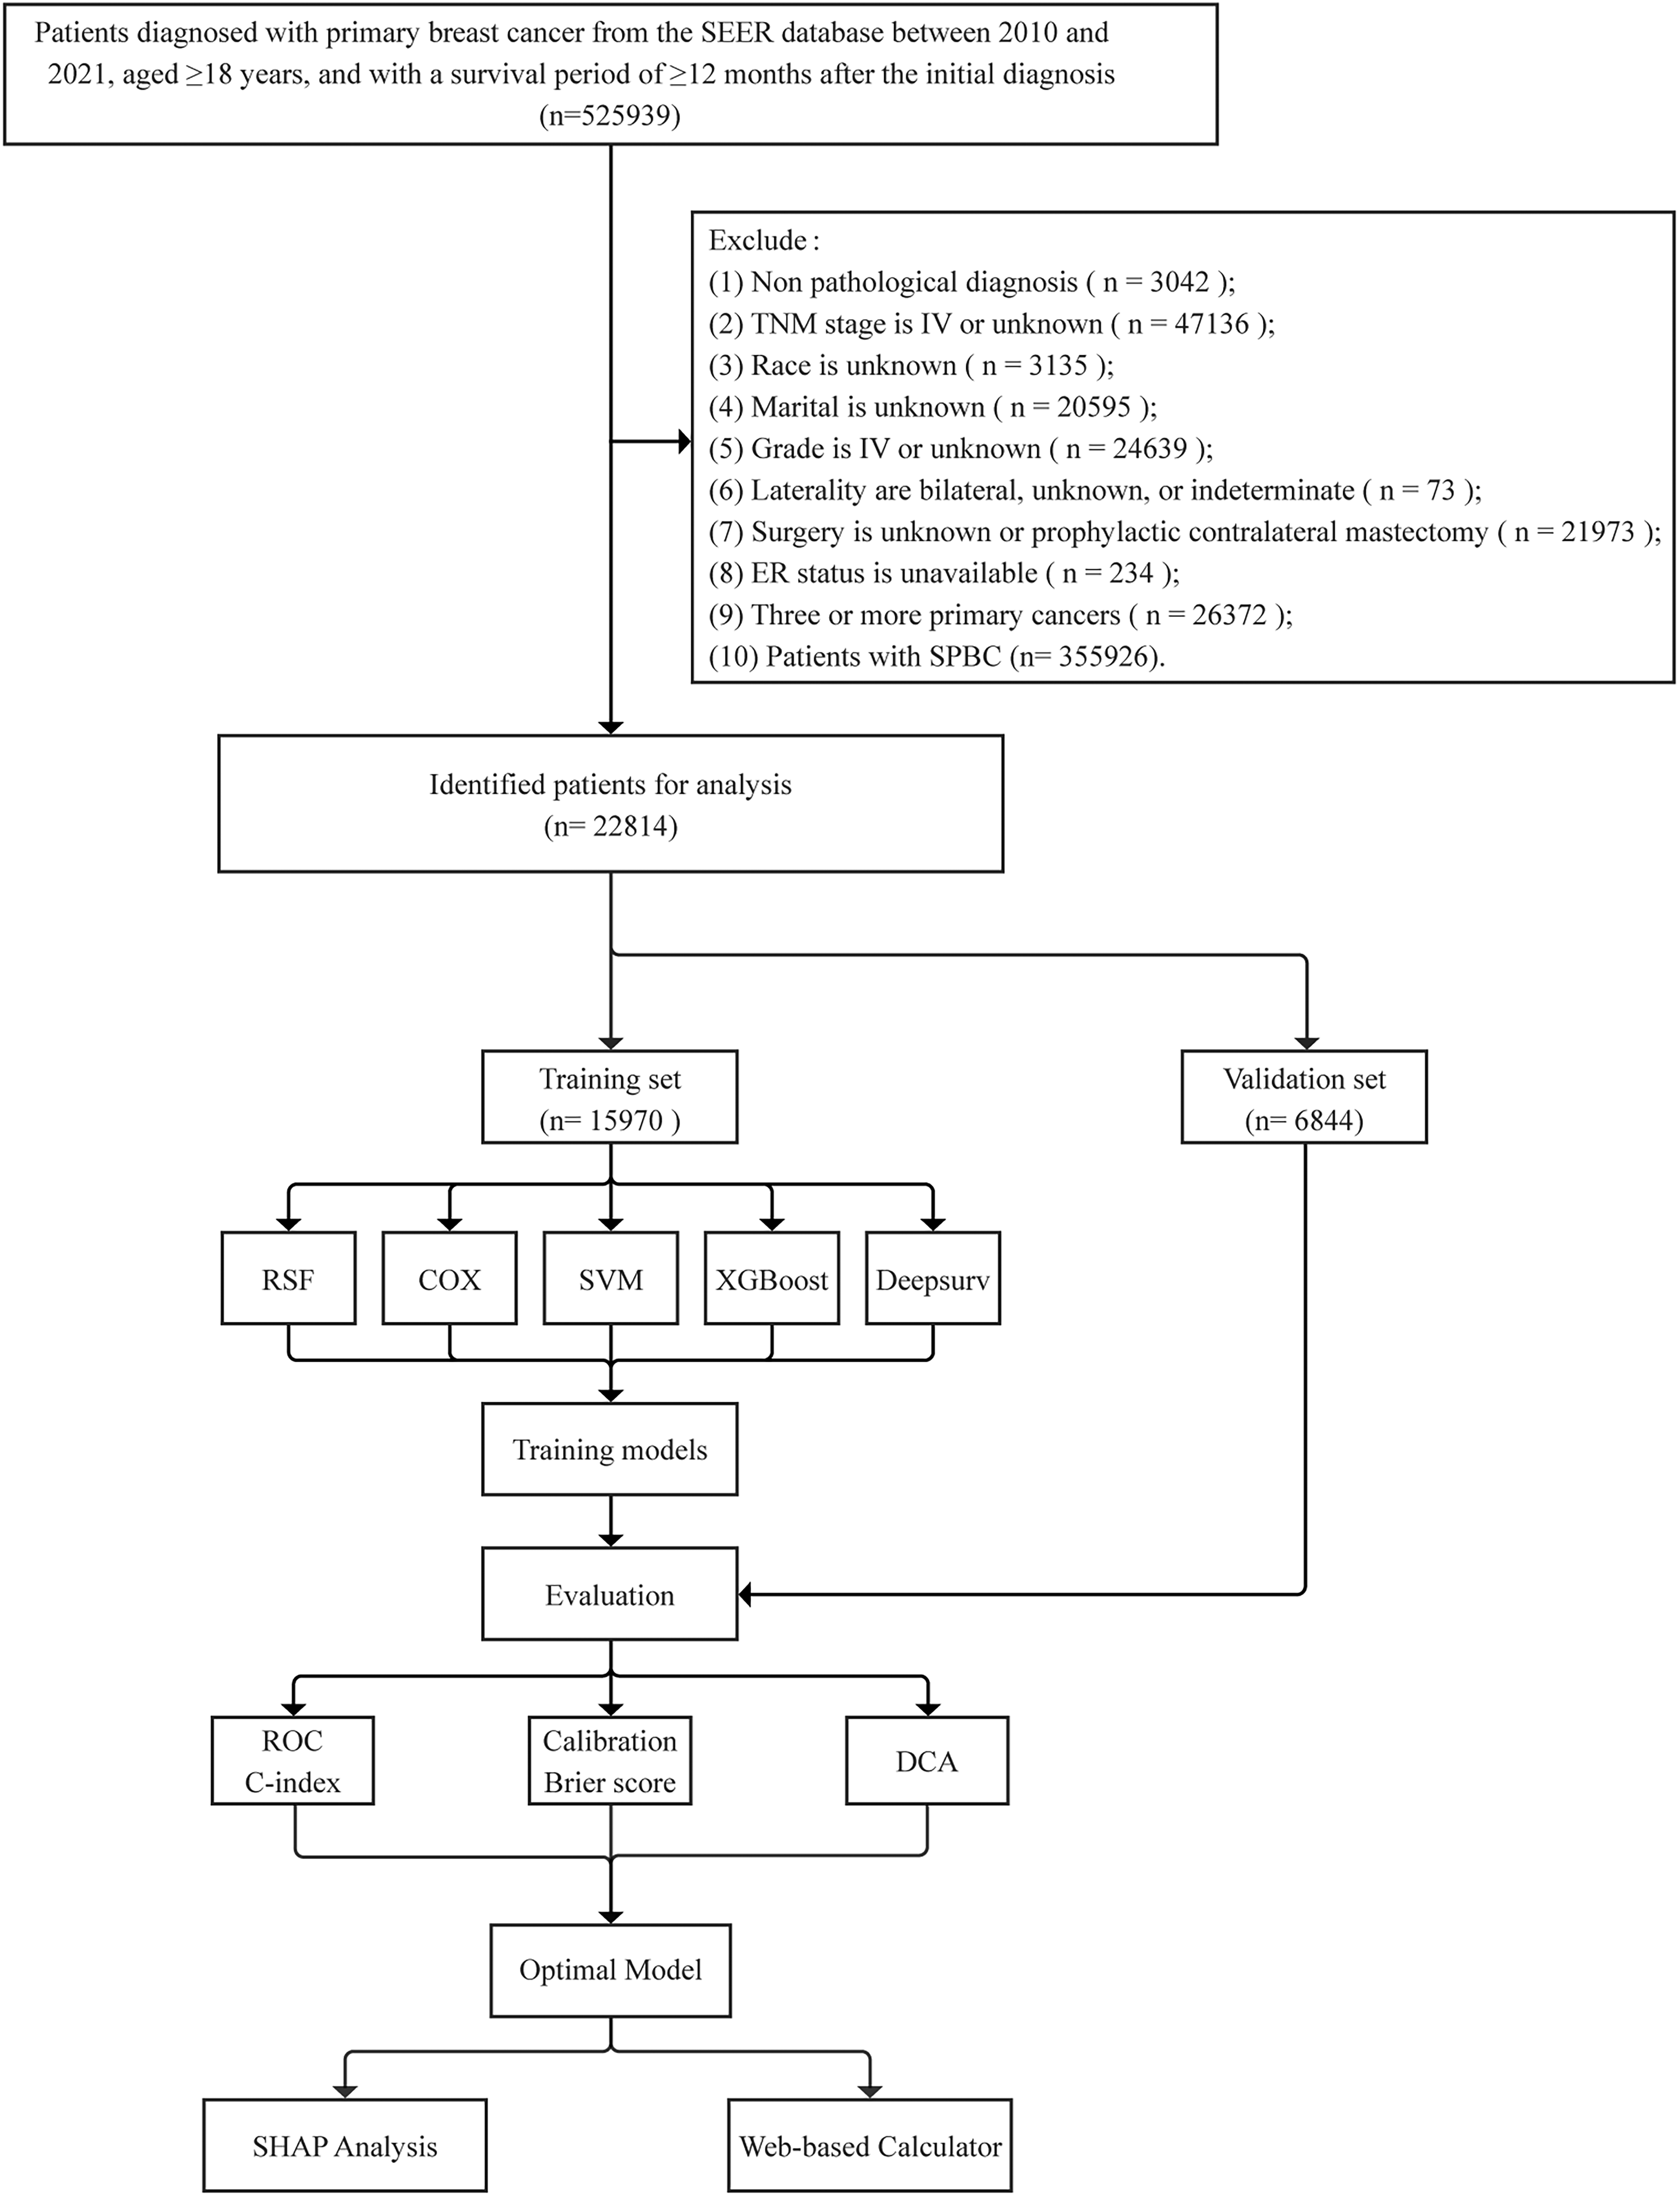
Patient screening and study design flowchart. SPBC, single primary breast cancer; RSF, random survival forest; SVM, support vector machine; XGBoost, extreme gradient boosting; ROC, receiver operating characteristic; DCA, decision curve analysis; SHAP, SHapley Additive exPlanations.
After identifying the optimal model by comparing the various metrics, individualized risk scores for each patient were calculated. Patients were stratified according to their risk scores. Survival analysis was performed using Kaplan–Meier curves, and differences between groups were compared with the log-rank test.
SHAP analysis was employed to interpret the predictive mechanisms of the optimal machine learning model. In the SHAP summary plot, the x-axis represents the magnitude of SHAP values, reflecting both the strength and directionality of variable contributions to model outputs. The color of the points maps to the original feature values, revealing non-linear relationships between feature magnitudes and their corresponding contribution scores.
The individualized prediction consists of a survival probability curve and local SHAP explanation plots, providing prognostic assessment from survival expectancy and risk factor contributions. First, the survival probability for each patient is calculated based on non-parametric methods. Second, local SHAP plots are used to analyze the predictive contributions of key variables to specific individuals, revealing quantitative associations between risk factors and prognosis. Finally, leveraging the optimal machine learning model, a web-based calculator using the Shiny framework is developed to dynamically predict CSS in BC-SPC patients.
Results
Clinical characteristics of BC-SPC patients
This study included 22,814 breast cancer patients, comprising a training cohort (n = 15,970) and a validation cohort (n = 6844). During follow-up, 565 CVD-specific deaths occurred. The cumulative incidence of CVD death was 1.29%, 3.06%, and 4.30% at 5, 8, and 10 years, respectively. Baseline characteristics demonstrated balanced distributions between the training and validation cohorts across demographic variables (sex, age, race, marital status), tumor features (grade, laterality, histologic type, pTNM stage), treatment modalities (surgery, radiotherapy, chemotherapy), and hormone receptor status (ER, PR, HER2), with all intergroup comparisons showing p > 0.05. In the overall cohort, 98.97% were female, 64.96% were aged ≥ 60 years, invasive ductal carcinoma accounted for 84.29%, TNM stage I was the most common (57.63%), and 97.19% underwent surgery (Table 1).
Characteristics of BC-SPC patients in training and validation set.

ER: estrogen receptor; PR: progesterone receptor; HER2: human epidermal growth factor receptor 2.
LASSO regression for variable screening
Fourteen variables were initially included in the analysis. Using the training dataset, LASSO regression with 10-fold cross-validation was conducted for variable selection. Finally, the set of 7 variables with non-zero coefficients selected at the log(λ) value corresponding to one standard error above the minimum (−5.747) was identified as the final set of selected features. These variables include Sex, Age, Race, Marital status, Surgery, Radiation, and Chemotherapy, as shown in Figure 3.
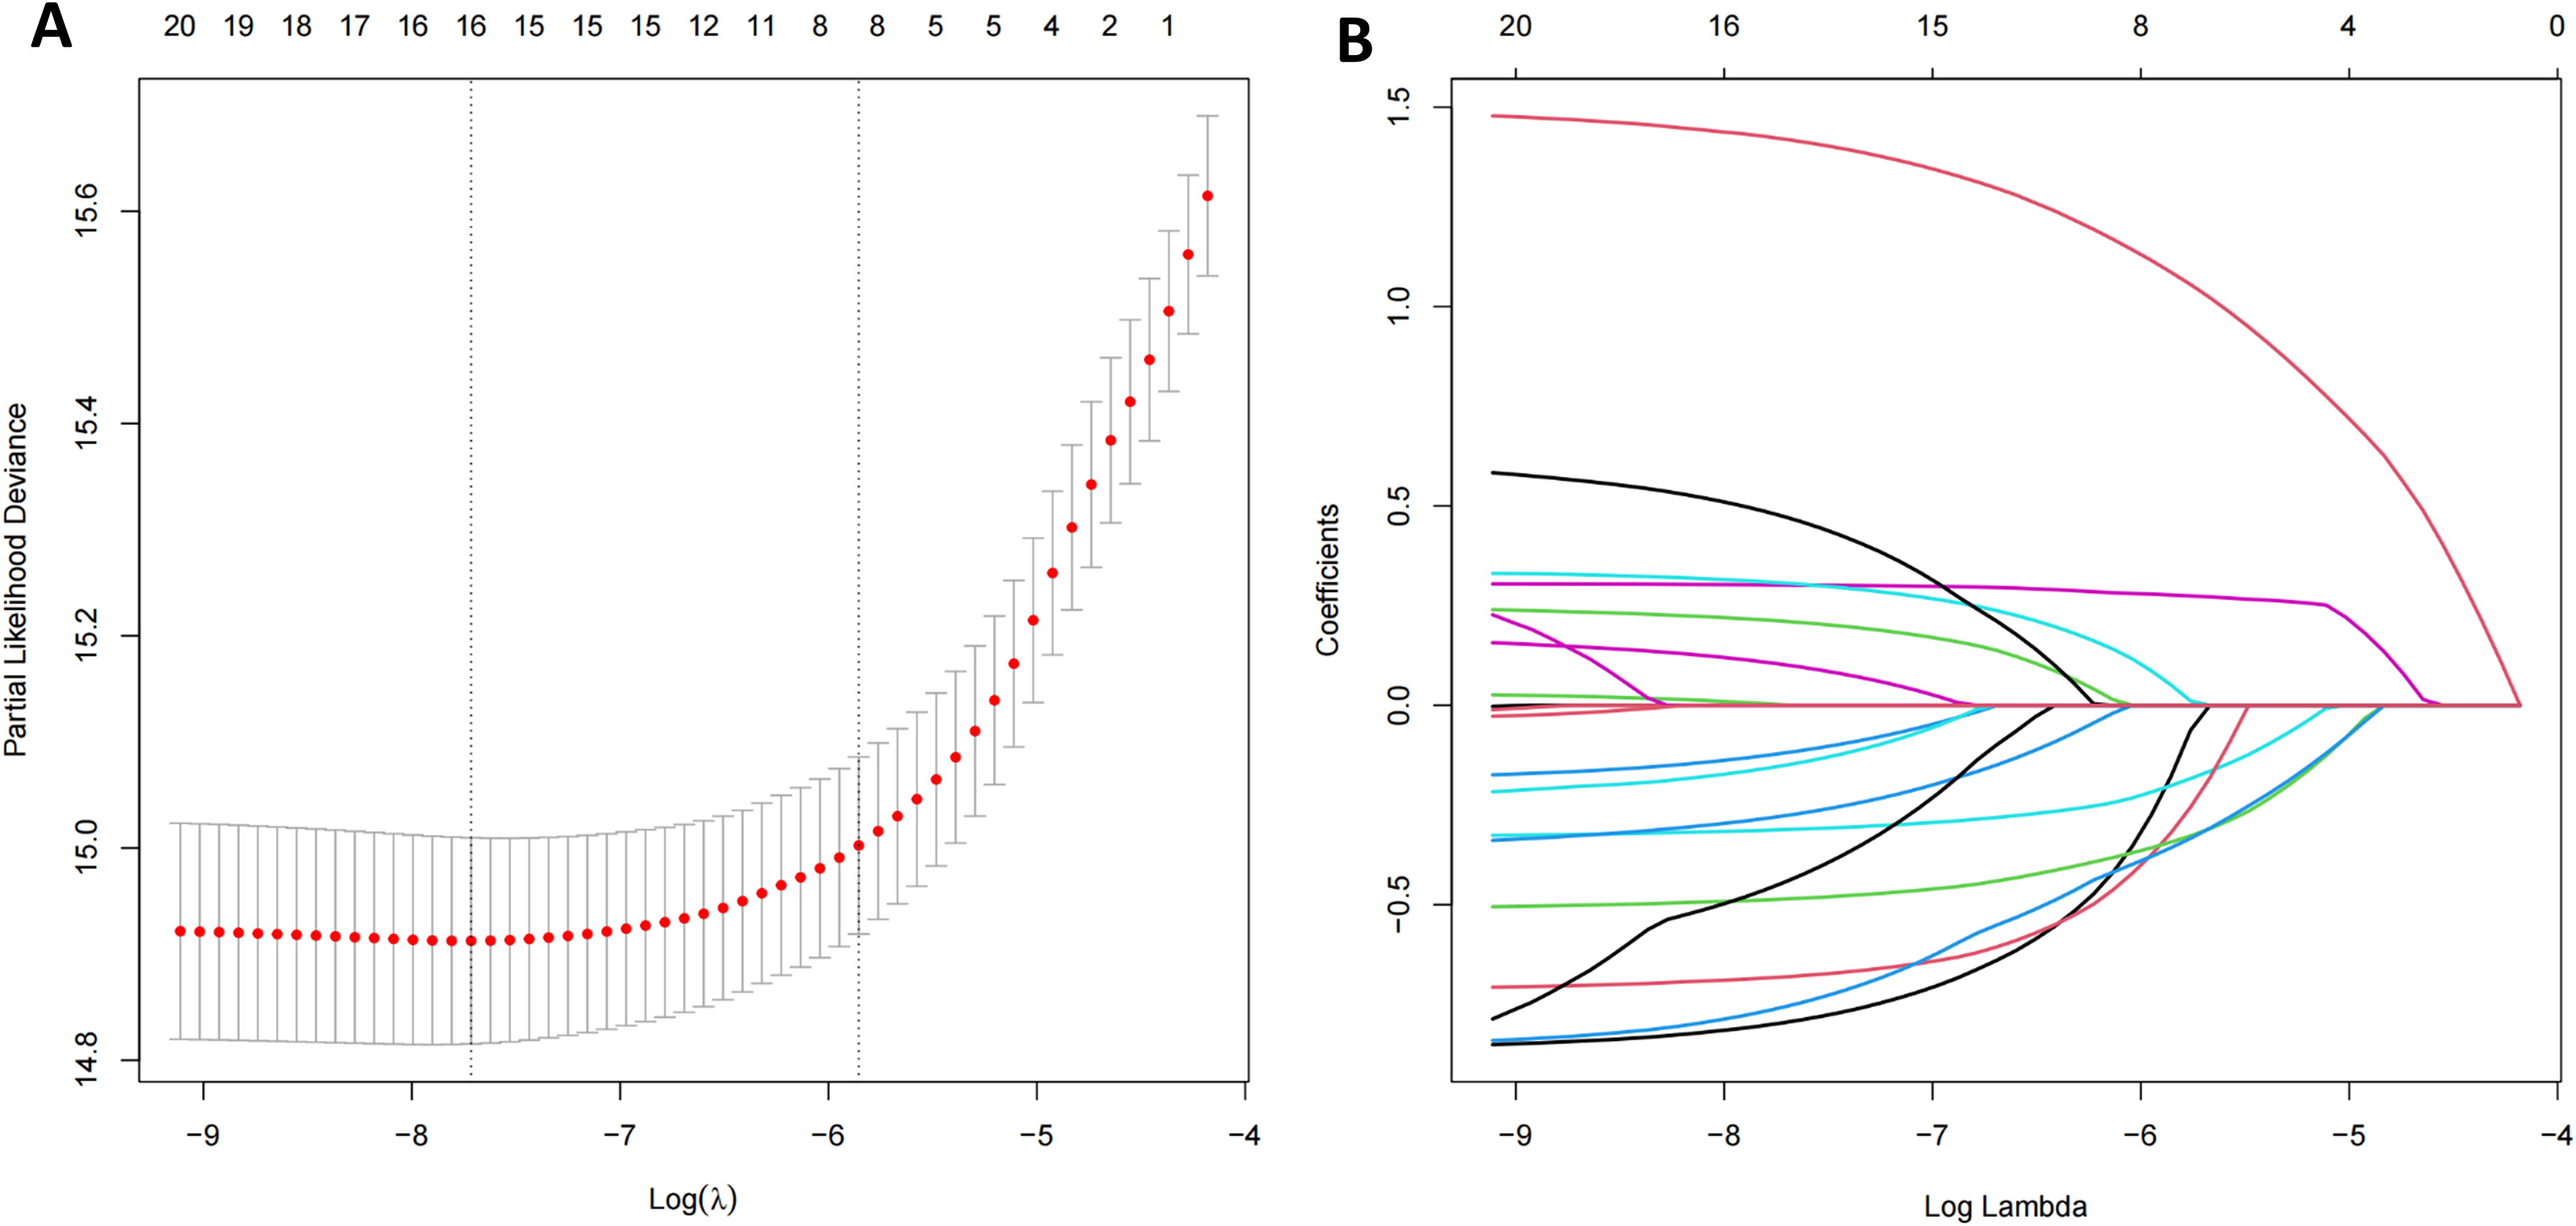
LASSO regression for variable selection. (A)10-fold cross-validation analysis; (B) Coefficient path plot. LASSO, least absolute shrinkage and selection operator.
Prediction model construction
RSF Model: The optimal hyperparameter combination for the model was determined through grid search, with ntree set to 400, mtry to 3, nodesize to 30, and other hyperparameters retaining their default settings.
Cox regression model: Sex, Age, Race, Marital status, Surgery, Radiation, and Chemotherapy were identified as independent prognostic factors for BC-SPC patients in the multivariable Cox regression analysis. The results are presented in Table 2, and the corresponding nomogram is shown in Figure 4.

Nomogram for Cox regression. CSS, cardiovascular-specific survival.
Multivariate cox regression analysis of the training set.

Ref: Reference; CI: confidence interval; HR: hazard ratio.
XGBoost Model: The optimal hyperparameter combination was determined through grid search, with max_depth set to 4, eta to 0.1, lambda to 0.5, and other hyperparameters retaining their default settings.
SVM Model: The optimal hyperparameter combination was determined through grid search, with kernel set to “RBF kernel”, gamma.mu to 0.12, and other hyperparameters retaining their default settings.
DeepSurv Model: The optimal hyperparameter combination was determined through grid search, with alpha set to 0.1, learning rate to 0.008, and other hyperparameters retaining their default settings.
Model evaluation and interpretation
The C-index was compared across training and validation sets to evaluate the discriminative ability of each model. The C-indices for the RSF, COX, XGBoost, DeepSurv, and SVM models (hereafter “the five models”) were 0.749, 0.733, 0.740, 0.725, and 0.692 in the training set, and 0.752, 0.752, 0.750, 0.747, and 0.701 in the validation set, respectively. Based on C-index comparisons, the RSF, Cox, and XGBoost model demonstrated comparable discriminative performance overall, while the DeepSurv model exhibited slightly lower performance, and the SVM model showed the poorest discriminative ability.
To further evaluate the discriminative ability of the five models at three time points (5, 8, and 10 years), time-dependent ROC curves were employed. Analysis of the training set revealed: at the 5-year mark, the RSF model demonstrated optimal predictive performance, followed closely by XGBoost; at 8 years, the ROC curve of the RSF model was marginally lower than that of XGBoost; by year 10, XGBoost maintained its advantage with RSF and COX models ranking subsequently. In the validation set, the RSF model consistently achieved the best predictive performance across all three time points, followed by XGBoost model. Overall, these results indicate that the RSF model exhibited optimal discriminative performance (Figure 5). Calibration curves were employed to assess the agreement between the predicted and actual outcomes of the five models at the 5-year, 8-year, and 10-year time points. The results showed that, in both the training and validation cohorts, all models exhibited comparable calibration performance (Figure 6).

ROC analysis of five machine learning models. (A1) Training set – 5 year; (A2) Training set – 8 year; (A3) Training set – 10 year; (B1) Validation set – 5 year; (B2) Validation set – 8 year; (B3) Validation set – 10 year. ROC, receiver operating characteristic; AUC, area under curve, RSF, random survival forest; SVM, support vector machine; XGBoost, extreme gradient boosting.
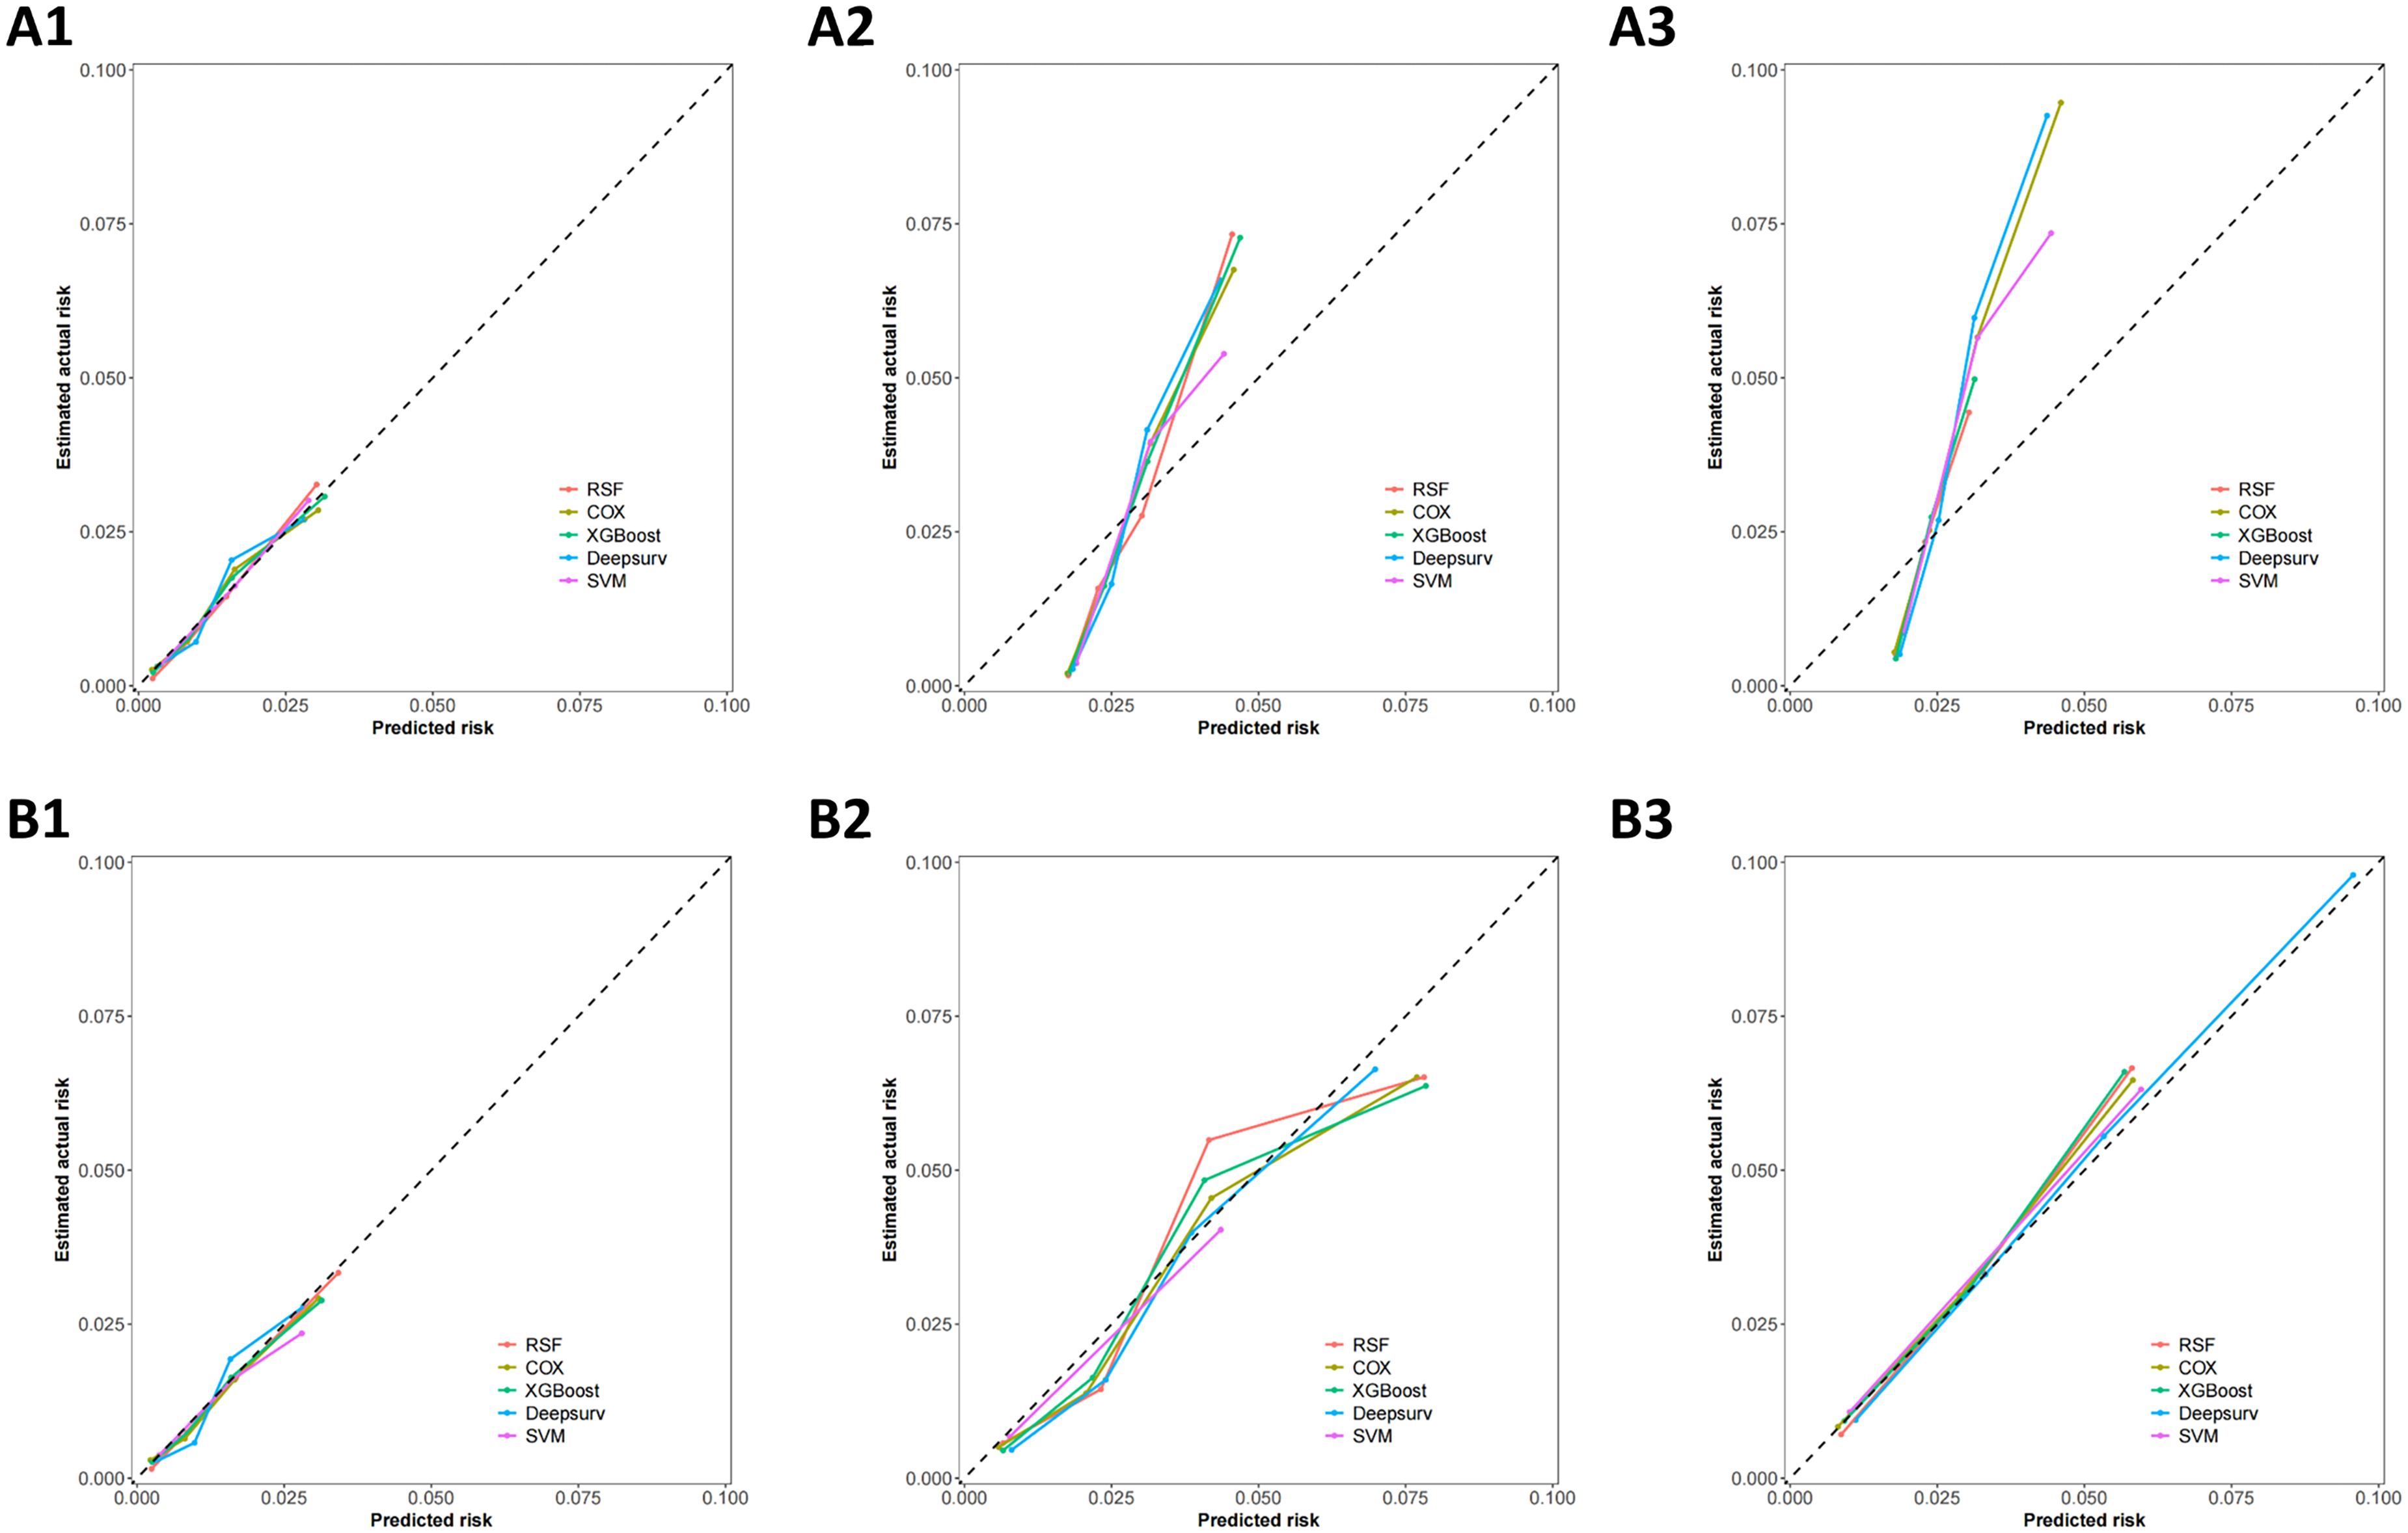
Calibration curves of five machine learning models. (A1) Training set – 5 year; (A2) Training set – 8 year; (A3) Training set – 10 year; (B1) Validation set – 5 year; (B2) Validation set – 8 year; (B3) Validation set – 10 year. RSF, random survival forest; SVM, support vector machine; XGBoost, extreme gradient boosting.
DCA of the five models in the training set revealed that the RSF model consistently demonstrated the highest clinical net benefit at the 5-year, 8-year, and 10-year time points. In the validation set, the RSF model achieved optimal clinical net benefit specifically at the 10-year time point, whereas its performance at the 5- year and 8-year time points was comparable to that of the other models (Figure 7).

DCA curves for five machine learning models. (A1) Training set – 5 year; (A2) Training set – 8 year; (A3) Training set – 10 year; (B1) Validation set – 5 year; (B2) Validation set – 8 year; (B3) Validation set – 10 year. DCA, decision curve analysis; RSF, random survival forest; SVM, support vector machine; XGBoost, extreme gradient boosting.
The comprehensive evaluation indicates that the RSF model is the optimal tool for predicting CSS in BC-SPC patients. SHAP framework was subsequently employed to analyze and visualize the RSF model. The SHAP summary plot revealed that variables in the model were ranked by importance in descending order as follows: Age, Radiation, Marital status, Chemotherapy, Surgery, Race, and Sex (Figure 8).

SHAP summary plot for the RSF model. SHAP, SHapley Additive exPlanations; RSF, random survival forest.
RSF-based risk stratification of BC-SPC patients
Based on the risk scores calculated by the RSF model for patients in the training set, the Additive Forward Search (AddFor) algorithm was employed to generate candidate cutoff points. Using the maximization of the C-index as the criterion, two optimal cutoff values (24.2 and 46.2) were identified. Based on these thresholds, patients in both the training and validation sets were stratified into high-risk (risk score > 46.2), intermediate-risk (24.2 ≤ risk score ≤ 46.2), and low-risk (risk score < 24.2) groups. The Kaplan-Meier survival curves and log-rank tests demonstrated a statistically significant difference in CSS among the three groups (p < 0.0001, Figure 9).

Risk stratification of the RSF model on the training and validation sets. (A) Training set risk stratification; (B) Validation set risk stratification.
Individualized prognostic interpretation for BC-SPC patients
Three BC-SPC patients were randomly selected and sequentially numbered for individualized prognostic illustration. As depicted in Figure 10(a), Patients 1 and 2 exhibited more favorable survival probabilities than Patient 3. Local SHAP analysis explained each patient's prognosis from the perspective of variable contributions, where red-highlighted variables represented positive contributions to the predicted CVD-mortality risk, while blue-highlighted variables indicated negative contributions.

Individualized prognosis prediction for BC-SPC patients. (A) Estimated survival probability curves for three patients; (B) Local SHAP plot for patient 1
The local SHAP plot for Patient 1 demonstrated that radiation, marital status, and surgery served as features associated with lower CVD-mortality risk, whereas age and chemotherapy were linked to higher risk. Additionally, the contribution of sex and race was minimal in this example (Figure 10(b)). Patient 2 (Figure 10(c)) exhibited a pattern consistent with Patient 1: radiation, marital status, and surgery were linked to lower risk prediction, whereas age and chemotherapy were associated with increased risk, with sex and race exhibiting minimal impact
Web-based calculator for the optimal model
To facilitate the clinical translation of the research findings, we developed a web-based RSF model prediction tool using the Shiny framework (https://webcalcula.shinyapps.io/RSF-model_pro/) for the dynamic prognostic assessment of CSS in BC-SPC patients. This tool integrates an interactive interface, real-time computation, and visualization capabilities to dynamically generate individualized survival probability curves, survival rates at specific time points, and individual-level SHAP explanations, thereby providing clinicians with precise and convenient risk-quantification support. Its user-friendly design, highly adapted to clinical settings, significantly enhances the implementation of personalized health management for BC-SPC patients.
Discussion
This study systematically developed and validated a CSS prediction model using a cohort of BC-SPC patients from the SEER database. By comparing Cox regression and four machine learning algorithms, the RSF model demonstrated superior predictive performance
Early identification of cardiovascular mortality risk in BC-SPC patients is critical for improving quality of life and reducing comorbidity management costs. Although existing studies have shown that ML algorithms outperform traditional statistical methods in assessing CVD risk, 15 predictive modeling in the field of cardio-oncology remains exploratory. 16 The RSF model established in this study demonstrated significantly superior discriminative ability to other models in 5-, 8-, and 10-year predictions, as evidenced by higher C-index and time-dependent AUC values. Additionally, the calibration curves revealed favorable predictive consistency. Further validation through DCA confirmed that the RSF model provides enhanced clinical net benefit.This may stem from the RSF model's capability to effectively capture nonlinear relationships and higher-order interactions among variables by integrating multiple decision trees.17,18 Moreover, its tree-based risk stratification mechanism has shown excellent performance in numerous cancer-prognosis studies.19,20 This study not only confirms the superiority of the RSF model for CSS prediction in BC-SPC patients but also provides important guidance for selecting prognostic models in clinical practice. With its outstanding predictive accuracy and capacity to handle complex clinical data, RSF emerges as the ideal tool for prognostic assessment in this patient population.
Concurrently, the XGBoost model also performed exceptionally well in long-term survival prediction, particularly for 10-year survival, with discriminative power closely approximating that of the RSF model. As a gradient boosting tree algorithm, XGBoost likewise excels at handling high-dimensional data and has demonstrated high accuracy and reliability in various clinical prediction tasks.21,22 Additionally, the DeepSurv model showed noteworthy predictive performance at certain time points, indicating its potential applicability in specialized scenarios. 23 Future research could explore strategies to integrate the strengths of multiple models, thereby enhancing predictive accuracy and clinical utility.16,24
Although ML models offer advantages in predictive accuracy, their “black-box” nature still limits widespread clinical adoption. To enhance model transparency and clinical utility, this study implemented SHAP interpretability analysis to elucidate the decision-making processes of the RSF model. By quantifying the contribution of predictors to individual survival risk, SHAP analysis not only identified key factors associated with CSS risk in BC-SPC patients but also clarified the direction of their contribution, substantially enhancing the model's clinical interpretability and practical utility.
25
SHAP analysis revealed that age, radiotherapy, marital status, chemotherapy, and surgery are the core predictors of CSS. Among these, age was identified as the primary risk factor, with its effects likely associated with age-related impairment of vascular endothelial function and cumulative toxicity from anticancer therapies
Regarding treatment variables, SHAP analysis revealed that radiotherapy, chemotherapy, and surgery were all associated with a lower risk of CVD mortality. This phenomenon may stem from complex bidirectional interactions between tumors and the cardiovascular system mediated through inflammatory factors, metabolic abnormalities, and neuroendocrine signaling. Research has found that endothelin-1 (ET-1) secreted by breast tumor cells serves not only as a key factor in breast cancer progression and metastasis but also as a critical mediator of myocardial hypertrophy. Eliminating tumor cells reduces circulating ET-1 levels, thereby alleviating its pro-hypertrophic effects on the heart.29,30 Similarly, resection of primary tumor lesions might mitigate long-term chronic cardiovascular damage caused by tumor-related systemic inflammatory responses. Regarding radiotherapy, modern precision techniques such as intensity-modulated radiotherapy (IMRT) and deep inspiration breath hold (DIBH) have significantly reduced cardiac radiation exposure, potentially minimizing harm while maintaining tumor control.31–33 In contrast, the contribution of surgery appears relatively modest, potentially due to its threshold effect for benefit. Although surgery can indirectly prevent chemotherapy-induced cardiotoxicity by reducing the required cycles and dosages of adjuvant chemotherapy, the stress response from overly extensive surgical procedures (such as total mastectomy) may partially counteract its protective effects.34–36 In summary, the association between anticancer treatments and cardiovascular outcomes is complex. These observations may also, to some extent, reflect that patients receiving active treatment possess better physiological reserve and fewer comorbidities. Therefore, personalized risk-benefit assessments should be conducted when formulating systemic anticancer regimens, carefully weighing antitumor efficacy against potential cardiovascular risks. Through multidisciplinary collaboration, comprehensive strategies integrating precision therapy and cardioprotection should be developed to maximize antitumor efficacy while avoiding compound toxicities, ultimately optimizing patient survival and quality of life.6,8,37
Marital status was also identified as a significant prognostic factor, with being married associated with better outcomes. Studies indicate that the spousal support available to married patients not only helps alleviate psychological stress, thereby suppressing excessive sympathetic activation and elevated inflammatory markers, but also promotes treatment adherence and ensures timely cardiac function monitoring. This finding substantiates the modulatory influence of psychosocial factors on cardiovascular prognosis in cancer survivors, providing a theoretical basis for integrating social support interventions into clinical practice.38–40
In summary, the SHAP analysis has substantially enhanced the transparency and interpretability of the RSF model by elucidating both the magnitude and direction of feature impacts, successfully transforming this high-accuracy machine learning tool into a clinically intelligible and trustworthy decision aid. Our study not only validates and refines findings from existing literature on key clinical predictors but also provides visual, user-friendly, and easily interpretable risk assessments to support personalized patient management and clinical decision-making. Leveraging the model's interpretable outputs, clinicians can swiftly identify high-risk patients and focus more precisely on key factors when formulating treatment strategies and follow-up plans. For example, for elderly, unmarried patients undergoing chemotherapy, incorporating psychosocial support and enhancing multidisciplinary monitoring for cardiotoxicity may be considered. This will help achieve more precise and efficient clinical management by driving the seamless integration of artificial intelligence technology into clinical practice, ultimately improving cardiovascular outcomes for cancer survivors.
To facilitate clinical translation, we developed an interactive web-based calculator using the Shiny framework, addressing the gap in precision cardiovascular risk management tools for BC-SPC patients. The tool dynamically integrates multidimensional clinical data to generate individualized survival probabilities in real time, enabling immediate computation of CSS risk. This innovation provides clinicians with dynamic risk prediction support, such as guiding intensified cardiac monitoring for high-risk patients, enabling the timely development of personalized treatment plans and optimized follow-up strategies.
Although this study provides an effective ML model and a clinical tool for predicting CSS in BC-SPC patients, several limitations should be acknowledged. First, the study is constrained by the retrospective nature of the SEER database and its limited variable coverage. The absence of granular clinical information, such as detailed treatment regimens, cardiovascular comorbidities, and lifestyle factors, may introduce residual confounding. In addition, treatment-related variables are susceptible to confounding by indication and “healthy patient” selection bias; Thus, their apparent effects in the model may reflect an aggregate of baseline health status and disease severity rather than the causal impact of treatment itself. Moreover, despite applying strict classification rules, a small degree of misclassification between second primary cancers and recurrences may still exist, which is an inherent limitation of registry-based studies. Second, regarding statistical methodology, this study did not employ a competing-risks model for adjustment. In subgroups with a high incidence of competing events, this may overestimate the cumulative incidence of cardiovascular death; therefore, our risk prediction results should be interpreted as conditional risk stratification within specific survival contexts. Additionally, although SHAP analysis effectively quantifies feature contributions to model predictions, its interpretability remains constrained by the underlying model architecture and potential confounders; meanwhile, larger multicenter datasets will be required to support reliable subgroup-specific interpretability analyses. Thus, it cannot be used to establish direct causal relationships. Third, as the model was developed and validated exclusively using the SEER database, it currently lacks external evaluation. To confirm its utility and generalizability, further validation through multi-center external studies is required across broader geographic regions, diverse healthcare systems, and specific patient subgroups. Additionally, future research should focus on refining the model by incorporating cohorts that provide comprehensive longitudinal treatment and granular clinical information.
Conclusion
This study confirms the predictive value of ML for CSS in BC-SPC patients, with the RSF model demonstrating optimal predictive performance. An interactive web-based dynamic tool developed with key predictors enables real-time risk prediction, providing clinicians with intuitive and reliable technical support to optimize cardiovascular outcomes in BC-SPC survivors.
Supplemental Material
sj-pdf-1-dhj-10.1177_20552076261435833 - Supplemental material for Interpretable machine learning for predicting cardiovascular-specific survival in breast cancer patients with second primary cancers: A SEER-based study
Supplemental material, sj-pdf-1-dhj-10.1177_20552076261435833 for Interpretable machine learning for predicting cardiovascular-specific survival in breast cancer patients with second primary cancers: A SEER-based study by Wen Shui, Chao Lan, Xueqing Xing, Jian Wang and Huiping Liu in DIGITAL HEALTH
Supplemental Material
sj-docx-2-dhj-10.1177_20552076261435833 - Supplemental material for Interpretable machine learning for predicting cardiovascular-specific survival in breast cancer patients with second primary cancers: A SEER-based study
Supplemental material, sj-docx-2-dhj-10.1177_20552076261435833 for Interpretable machine learning for predicting cardiovascular-specific survival in breast cancer patients with second primary cancers: A SEER-based study by Wen Shui, Chao Lan, Xueqing Xing, Jian Wang and Huiping Liu in DIGITAL HEALTH
Footnotes
Acknowledgements
Thanks for the data support provided by SEER database.
Ethical considerations
This study utilized data from the publicly available SEER database, where patient information is anonymized; therefore, ethics approval and informed consent were not required.
Author contributions
Wen Shui and Chao Lan: Conceptualization, Funding acquisition, Data curation, Formal analysis, Software, Visualization, Writing - original draft. Xueqing Xing: Formal analysis, Investigation, Supervision, Validation. Jian Wang: Methodology, Resources, Supervision, Writing - review & editing. Huiping Liu: Conceptualization, Methodology, Supervision, Writing - review & editing.
Funding
The authors disclosed receipt of the following financial support for the research, authorship, and/or publication of this article: This work was supported by the Natural Science Foundation of Shanxi Province, (grant number No. 202203021222387).
Declaration of conflicting interests
The authors declared no potential conflicts of interest with respect to the research, authorship, and/or publication of this article.
Data and code availability
Selected non-proprietary code components and scripts necessary for the primary analyses can be shared upon reasonable requests to the corresponding author via email.
Data availability statement
The data utilized in this study were sourced from the SEER database.
Supplemental material
Supplemental material for this article is available online.