
Abstract
Background
Stroke is a leading cause of morbidity and mortality worldwide, representing a major cerebrovascular disorder. Early identification of stroke-related risk factors is essential for implementing effective prevention and management strategies. This study aimed to develop an interpretable Bayesian network (BN)-based predictive model to identify key risk factors associated with stroke and to elucidate their complex interdependencies.
Methods
This study analyzed cross-sectional data derived from the National Health and Nutrition Examination Survey (NHANES) spanning the period 2011–2020. Feature selection was performed using univariate and multivariate logistic regression analyses. The BN structure was constructed using the hybrid HPC algorithm (H2PC), with conditional probability distributions estimated via maximum likelihood estimation. Both qualitative and quantitative analyses were conducted to examine node probabilities and elucidate dependencies between stroke and associated risk factors. Model performance was primarily assessed using the area under the receiver operating characteristic curve (AUROC) and compared against established machine learning algorithms.
Results
The final analytical sample comprised 20,535 individuals. Bayesian network analysis identified five variables with direct dependency relationships to stroke occurrence: age, sleep disorders, alcohol consumption, coronary heart disease, and diabetes. The BN model demonstrated superior predictive performance with an AUROC of 0.803 (95% CI: 0.773–0.833), significantly outperforming other machine learning approaches.
Conclusions
The developed BN model provides an intuitive visualization of the probabilistic interdependencies among stroke risk factors while achieving competitive predictive accuracy. These findings demonstrate its exploratory value in unmasking complex risk pathways and suggest its potential to inform future stroke risk assessment and prevention strategies upon further longitudinal validation.
Introduction
Stroke represents a major global health challenge, constituting the second leading cause of death and third leading cause of disability worldwide according to the World Stroke Organization 2025 report. 1 The global burden of stroke has increased substantially over recent decades, with stroke incidence, mortality, and disability-adjusted life years (DALYs) rising by 70%, 44%, and 32%, respectively between 1990 and 2021—a trend that continues unabated. 2 This disease affects individuals across all demographic groups, transcending traditional age boundaries and no longer being confined to elderly populations. 3 The majority of patients who developed hemorrhagic stroke during COVID-19 infection presented with underlying chronic conditions, such as hypertension or diabetes mellitus, which are recognized as established risk factors for stroke. 4 Most stroke survivors experience persistent neurological sequelae of varying severity, necessitating intensive, long-term healthcare, rehabilitation, and social support. Such long-term disability creates substantial burdens for patients and healthcare systems alike. 5 However, more than 85% of initial stroke events are potentially avoidable through effective primary prevention strategies. 6 Therefore, early identification of high-risk populations and comprehensive management of modifiable risk factors are essential for reducing stroke incidence and disability burden while mitigating strain on healthcare resources.
Current stroke risk assessment paradigms rely predominantly on traditional prediction models that only incorporate demographic data, medical history, and general clinical parameters. Established tools such as the Framingham stroke risk profile, 7 CHA2DS2-VASc score, 8 and QStroke score, 9 logistic regression, 10 have provided valuable frameworks for clinical decision-making. However, traditional statistical frameworks frequently fail to account for the intricate non-linear dependencies among multiple risk determinants. This limitation compromises their predictive precision and cross-population generalizability, particularly when confounded by disparities in socioeconomic status, ethnicity, and regional healthcare infrastructures, which ultimately fuels substantial inter-study heterogeneity. The emergence of machine learning (ML) technologies has opened new avenues for addressing these limitations. ML approaches demonstrate superior capability in handling high-dimensional datasets, capturing non-linear relationships, and identifying subtle patterns that may be overlooked by traditional statistical methods.11,12 Ischemic stroke pathogenesis involves a complex web of interdependent risk factors rather than isolated, independent variables. 13 Unlike traditional logistic regression models, which often rely on the assumption of variable independence, Bayesian networks (BNs) construct graphical architectures through data-driven learning to explicitly represent complex interactions. 14 This approach facilitates a more efficient utilization of multidimensional data and provides deep insights into the intricate, multifactorial dependencies underlying stroke occurrence. 15 Crucially, the graphical nature of BNs ensures a transparent decision-making process, enabling clinicians to trace the underlying reasoning pathways rather than merely receiving a “black-box” prediction.16–18 This clinical utility is exemplified by previous work in post-stroke outcomes, 19 suggesting that BNs are uniquely suited for integration into complex medical decision-support systems.
Although numerous predictive models for stroke have been developed, substantial challenges persist in elucidating the intrinsic relationships among risk factors and in quantifying their contributions. This study aims to develop a BN model for stroke prediction that captures complex interactions and dependencies among risk factors to advance understanding of stroke pathogenesis and inform evidence-based prevention strategies. The established model will enable individualized stroke risk assessment using patient-specific clinical variables and probabilistic inference, thereby supporting clinical decision-making and targeted interventions.
Methods
Data source and participants
This study utilized data from the National Health and Nutrition Examination Survey (NHANES) conducted by the National Center for Health Statistics (NCHS) of the Centers for Disease Control and Prevention (CDC). NHANES is a nationally representative, cross-sectional survey designed to assess the health and nutritional status of the non-institutionalized civilian population of the United States. The survey employs a complex, multistage probability sampling design to ensure representative estimates for the US population. Data from five consecutive NHANES cycles spanning 2011–2020 were included in this analysis. NHANES data collection encompasses demographic information, socioeconomic status, dietary intake, health status, physical measurements, and laboratory analyses of blood and urine specimens. The health interview is administered in participants’ homes, whereas the physical examination and laboratory assessments are conducted at Mobile Examination Centers (MECs) by trained medical personnel. The survey protocol was approved by the NCHS Research Ethics Review Board, and all participants provided written informed consent before participation. According to the NHANES data use guidelines, all data are de-identified and released under the public domain for unrestricted research use.
Data processing and feature selection
This study excluded participants aged less than 20 years and those with missing demographic data. A total of 20,535 participants were included in the final analysis. The complete data extraction flowchart is presented in Supplementary Figure S1. Variables with missing data rates exceeding 60% were excluded from the analysis to ensure data quality and statistical robustness. The final dataset comprised 31 variables: age, sex, race, education level, marital status, ratio of family income to poverty (RFIP), body mass index (BMI), waist circumference, systolic blood pressure (SBP), diastolic blood pressure (DBP), pulse, albumin creatinine ratio (ACR), direct high density lipoprotein cholesterol (HDL), triglyceride, low density lipoprotein cholesterol (LDL), glycohemoglobin, fasting glucose, diabetes, drinking, smoking, serum total folate, work hours, sleep disorder, aspirin use, coronary heart disease (CHD), thyroid disorders, liver condition, exercise increase, salt reduction, and fat reduction. The primary outcome for stroke was operationalized as a binary indicator (yes/no), based on participants’ self-reported physician diagnosis. This was derived from the standardized questionnaire item: “Has a doctor or other health professional ever told you that you had a stroke?”. Additionally, participants whose stroke-related responses were recorded as “Refuse”, “Don’t know”, or were missing were removed from the analysis.
For variables with remaining missing values, multiple imputations by chained equations (MICE) were performed using the predictive mean matching (PMM) method. This approach maintains the distributional properties of the original data while providing robust estimates for missing values. Continuous variables were discretized based on established clinical guidelines and expert consensus (Supplementary Table S1). This approach was adopted to maximize clinical interpretability and to allow the model to capture complex non-linear interactions without the restrictive assumption of multivariate normality. By utilizing thresholds recognized in clinical practice, the resulting conditional probability distributions remain directly applicable to medical decision-making. To balance clinical interpretability with model parsimony, predictors were initially screened via univariate and multivariate logistic regression (
Model construction and evaluation
BNs, also referred to as Bayesian belief networks or directed acyclic graphical models, represent a powerful probabilistic framework for modeling complex relationships among variables under uncertainty. A BN consists of two essential components: a directed acyclic graph (DAG) and a set of conditional probability distributions. The DAG comprises nodes representing random variables and directed edges encoding conditional associations between variables. Each node is associated with a conditional probability table (CPT) that quantifies the probabilistic relationship between the node and its parent variables. Without temporal ordering or experimental intervention, these associations should not be interpreted as evidence of causality. Formally, a BN defines a joint probability distribution over a set of variables
BNs support two primary computational tasks: learning (Parameter learning and Structure learning) and probabilistic inference. Parameter learning focuses on estimating conditional probability distributions from data, typically accomplished through maximum likelihood estimation or Bayesian parameter estimation. Structure learning, the more challenging task, involves discovering the optimal graph topology from observational data using score-based methods (e.g., Bayesian information criterion), constraint-based approaches (e.g., PC algorithm), or hybrid techniques. Probabilistic inference involves computing posterior probabilities of query variables given observed evidence. A hybrid HPC algorithm (H2PC) was utilized for BN construction. This approach integrates both constraint-based conditional independence testing and score-based optimization techniques. The selection of H2PC was motivated by its ability to significantly reduce the search space through local structural constraints while ensuring global score optimization, thereby enhancing both computational efficiency and structural accuracy in complex datasets. Model selection was performed through comparative analysis of log-likelihood scores, and to ensure biological plausibility, structural constraints were applied to prohibit directionality that contradicts temporal or clinical logic (e.g., preventing edges from disease outcomes to age or sex).
The dataset was divided into training and testing subsets using an 8:2 split for model assessment based on the identified features. To evaluate the predictive superiority of the BN, its performance was benchmarked against five distinct ML algorithms, including extreme gradient boosting (XGBoost), random forest (RF), support vector machine (SVM), K-nearest neighbor (KNN), and artificial neural network (ANN). All models were developed and evaluated using the same standardized pipeline to ensure a fair comparison. To account for class distribution disparities, the Youden Index (sensitivity + specificity-1) was employed to establish optimal probability thresholds for classification. Model performance was evaluated using the area under the receiver operating characteristic curve (AUROC) to assess overall discriminative ability. Given the class imbalance in the dataset, the area under the precision-recall curve (AUPRC), recall, and F1-score were also employed to provide a more robust evaluation of the model's capacity to identify the minority class (stroke cases) and to balance precision with sensitivity. Decision curve analysis (DCA) was employed to assess clinical utility by quantifying net clinical benefit across a range of threshold probabilities. Calibration curves were constructed to evaluate model reliability, specifically by examining the agreement between predicted probabilities and observed outcomes—an aspect of particular importance in the presence of class imbalance. To ensure robust and unbiased performance estimation, a 10-fold cross-validation strategy was implemented, with all reported metrics averaged across the test folds to mitigate stochastic variability.
Statistical analysis
All statistical computations were conducted using R software (version 4.3.3). All data were weighted according to NHANES analytic guidelines. Examination sample weights (WTMEC2YR) from five 2-year cycles (2011–2020) were combined and rescaled by a factor of 0.2 so that the total weight equals the size of the U.S. population represented by a single 2-year cycle. Variance estimates were obtained with the Taylor series linearization method to account for the complex, stratified, multistage cluster sampling design. Study participants were stratified into two cohorts according to stroke occurrence status. Categorical data were summarized as counts and proportions, with between-group comparisons performed using chi-square tests. Statistical significance was defined as
Results
Baseline characteristics and potential risk factors for stroke
The detailed clinical characteristics of patients are presented in Table 1. Among 20,535 participants, 19,617 had no stroke history, and 918 had experienced stroke. The results indicate that age, race, education level, and other factors may affect on the prevalence of stroke. Age represents the risk factor for stroke occurrence, with risk increasing multiplicatively with each advancing age group. Among stroke patients, 56.6% were aged >65 years. Males and females accounted for 51.7% and 48.3% in stroke patients, respectively, but no statistically significant differences were observed (p > 0.05). The magnitude of the association between categorical risk factors and stroke was assessed using Cramer's V, with values below 0.2 considered indicative of a small effect size.
Baseline characteristics of patients.

RFIP: ratio of family income to poverty; BMI: body mass index; SBP: systolic blood pressure; DBP: diastolic blood pressure; ACR: albumin creatinine ratio; HDL: direct high density lipoprotein cholesterol; LDL: low density lipoprotein cholesterol; Glycol: glycohemoglobin; Fglucose: fasting glucose; SleepDis: sleep disorder; CHD: coronary heart disease; InExercise: exercise increase; RedSalt: salt reduction; RedFat: fat reduction; Trigly: triglyceride.
Univariate and multivariate LR analyses were performed for feature selection, with results presented in Table 2.The Top-5 risk factors associated with stroke were age ([OR,2.510; 95%CI, 2.272∼2.777] vs. [OR, 2.755; 95%CI, 2.542∼2.994]), diabetes ([OR,1.526; 95%CI, 1.233∼1.888] vs. [OR, 3.304; 95%CI, 2.863∼3.806]), drinking ([OR,1.591; 95%CI, 1.342∼1.882] vs. [OR, 2.067; 95%CI, 1.774∼2.400]), sleeping disorder ([OR,1.544; 95%CI, 1.334∼1.786] vs. [OR, 2.040; 95%CI, 1.781∼2.334]), CHD ([OR,2.448; 95%CI, 1.993∼2.995] vs. [OR, 6.199; 95%CI, 5.148∼7.430]) in multivariate LR and univariate LR, and all
Univariate and multivariate binary logistic regression analysis.
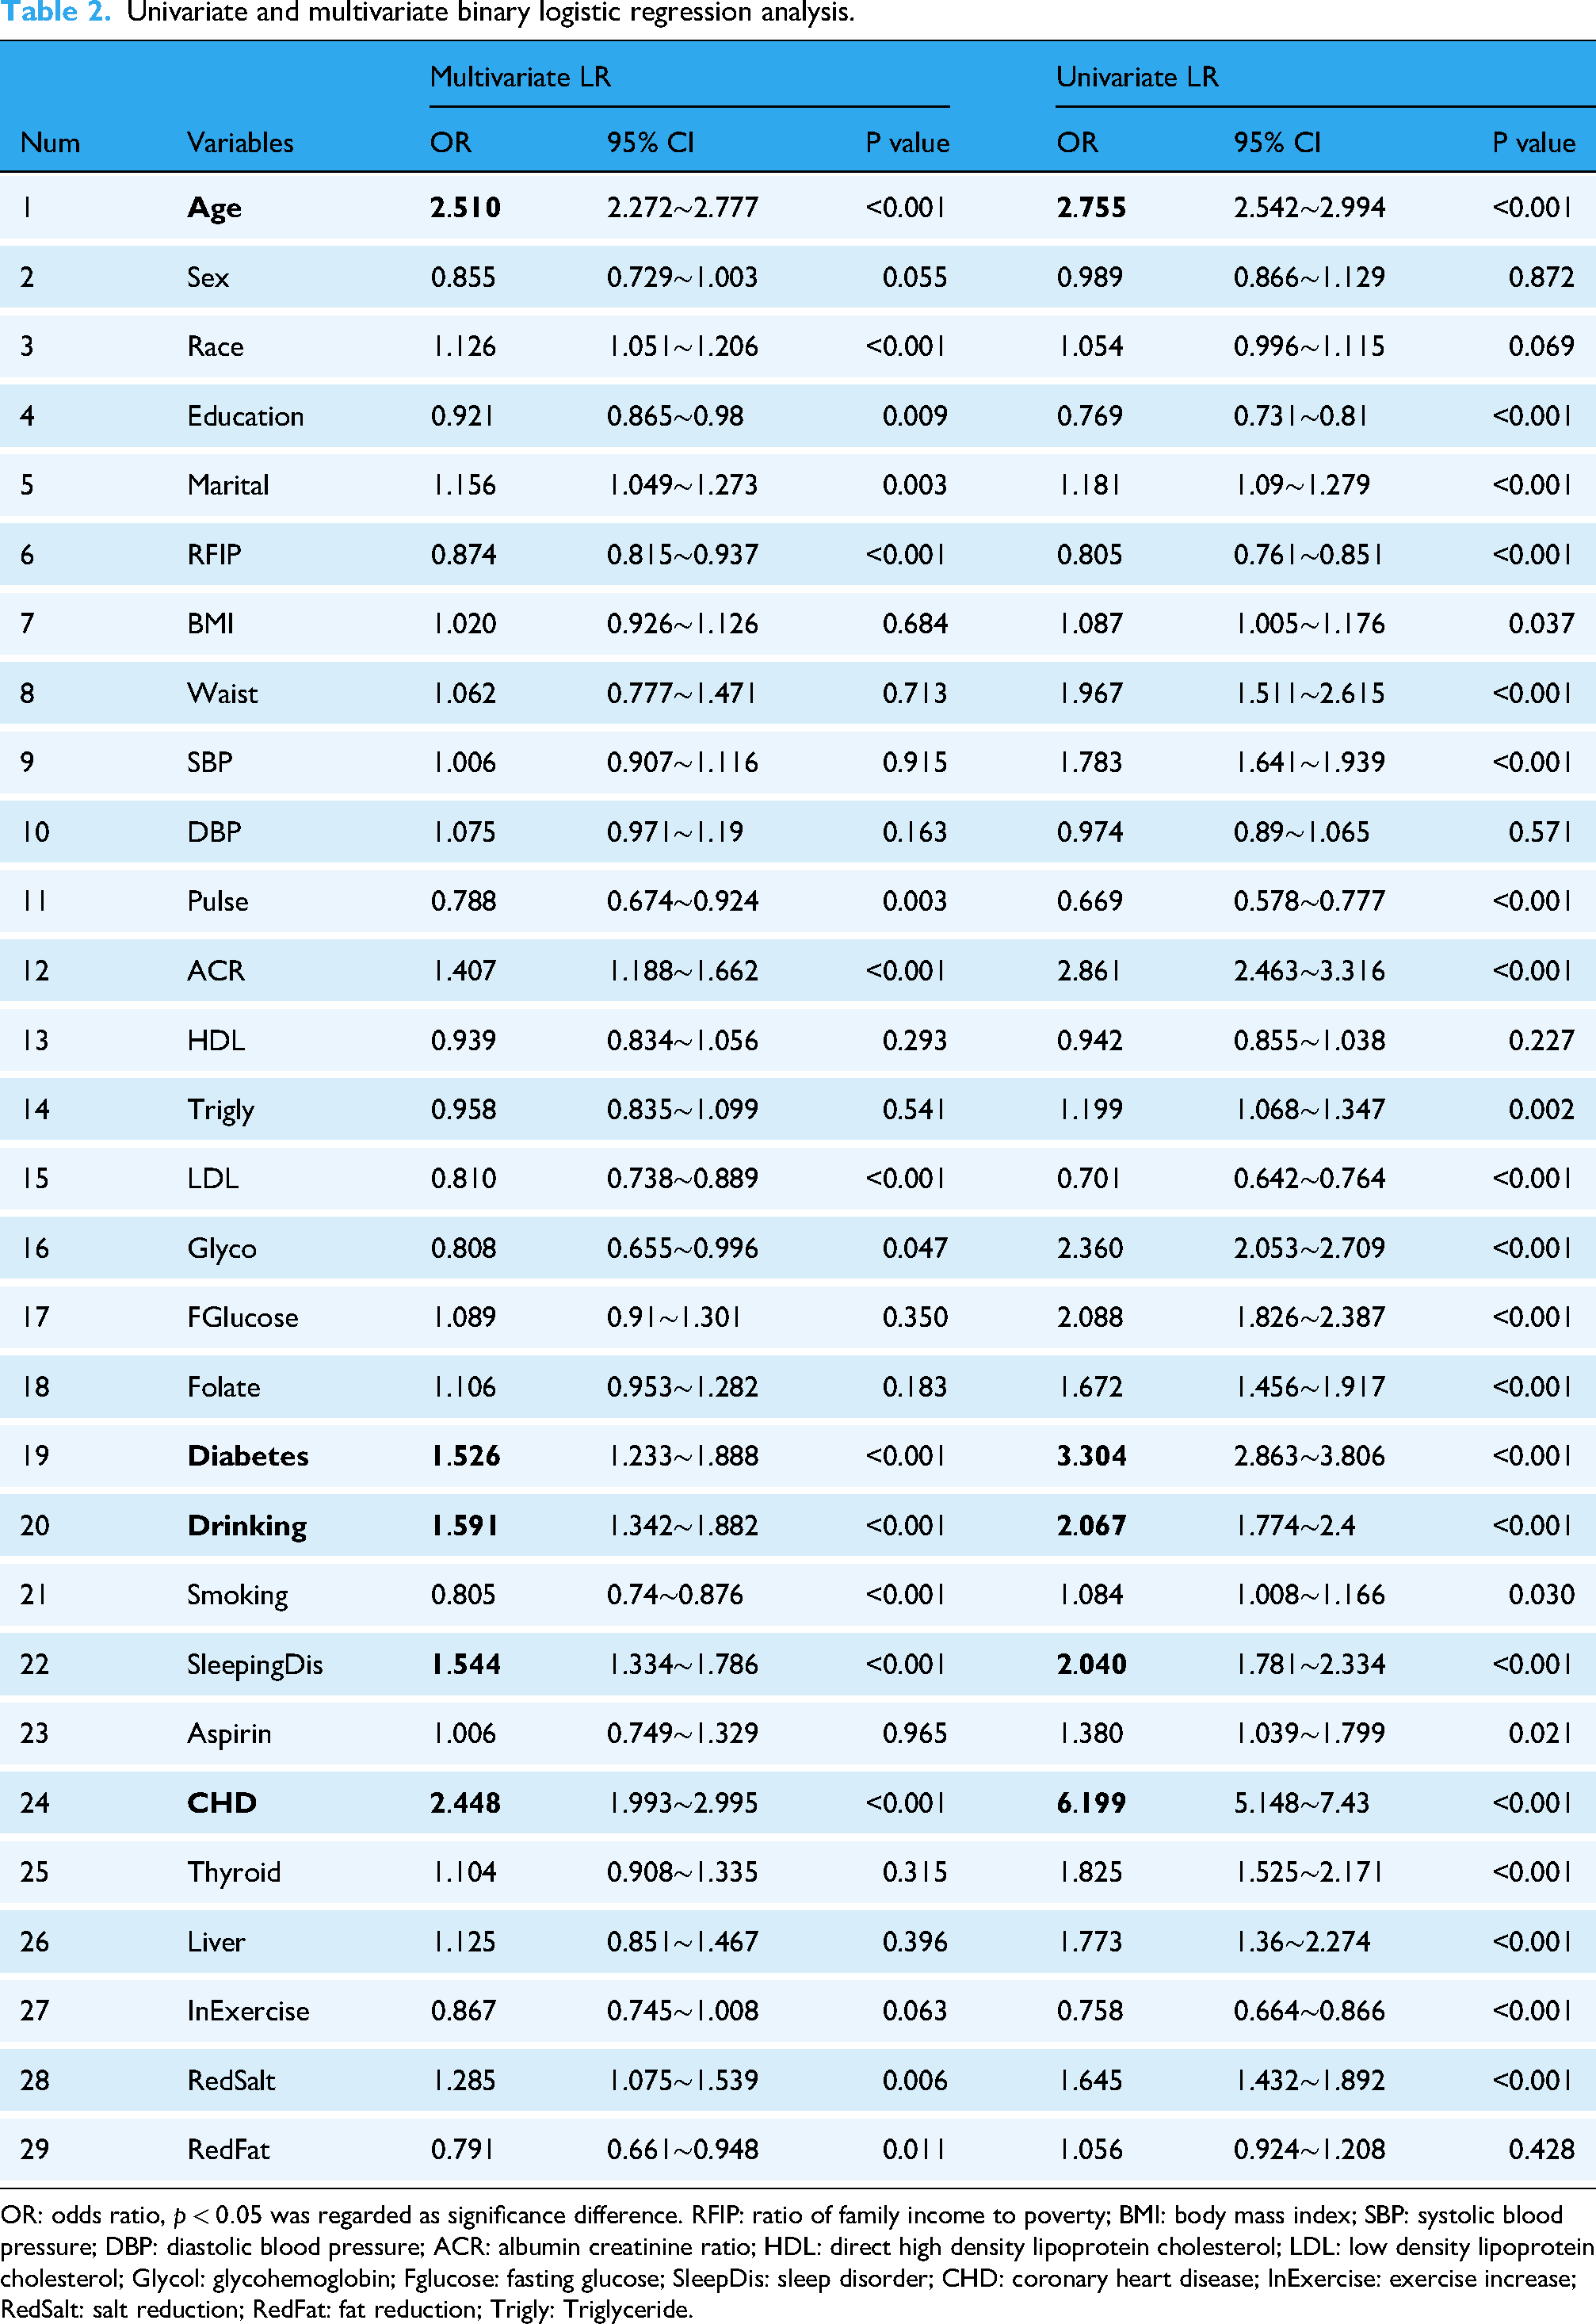
OR: odds ratio,
Model performance evaluation
Figure 1 and Supplementary Table S2 present the performance metrics of six ML models for stroke prediction, and the decision curves and calibration curves were also analyzed. Hyperparameters were optimized using a grid search strategy; the detailed hyperparameter configurations for each model are presented in Supplementary Table S3. Among the evaluated models, BN achieved the highest discriminative ability, with an AUROC of 0.803 (95% CI: 0.773–0.833). This was followed by RF (0.795; 95% CI: 0.763–0.826) and ANN (0.784; 95% CI: 0.748–0.820). While XGBoost demonstrated moderate performance (0.737; 95% CI: 0.701–0.772), SVM and KNN exhibited relatively lower discriminative power (Figure 1A). Notably, the BN model achieved the highest recall (0.864), which significantly outperformed RF (0.787) and XGBoost (0.775). This superior sensitivity in identifying stroke cases is particularly crucial for clinical screening applications, where minimizing false negatives is a priority. Furthermore, the BN model also achieved a comparatively favorable AUPRC of 0.139 (Figure 1B) and F1-score (0.170). The decision curve showed that the net benefit of all models decreases as the threshold probability increased. The BN model also demonstrated good clinical suitability (Figure 1C). Meanwhile, the calibration curve (The closer the Apparent line is to the dashed line, the better the agreement between the predicted and actual values is) showed that BN exhibited the best fit between the actual diagnosis and the predicted diagnosis (Figure 1D). Ten-fold cross-validation was conducted to evaluate model stability and reduce overfitting risk. Table 3 summarizes the performance metrics averaged across all ten folds. The BN attained the highest AUROC (0.780) and recall (0.790), along with a competitive F1-score (0.176). These results indicate that the BN model is particularly effective at identifying true stroke cases (minimizing false negatives), which is a primary goal in clinical screening. According to the Scott Knott test (Supplementary Figure S2), no statistically significant difference was found in AUROC, AUPRC, or recall between the BN and RF models; however, both models significantly outperformed the other evaluated models. Overall, the BN emerged as the optimal model for stroke prediction in this cohort.

Comprehensive analysis of ML model on test set. A: AUROC (The area under receiver operating characteristic Curve), B: AUPRC (The area under precision-recall curve), C: decision curves, D: calibration curves.
The predictive performance of six ML models using 10-fold cross-validation.

Bayesian network structure of stroke
To enhance the biological plausibility of the derived network, specific structural constraints were imposed. For instance, demographic variables (e.g., age and race) were defined as root nodes, as they cannot be influenced by other physiological or clinical variables in this context. Consequently, all edges directed toward age or race were prohibited. Furthermore, Stroke was defined as a terminal outcome variable, precluding it from influencing other risk factors. All other edges were learned directly from the data without prior constraints. The BN was constructed using 80% of the patient data allocated as the training dataset. To enhance the robustness and reliability of the network structure, 100 bootstrap resampling iterations were performed on the training dataset. Only edges with an occurrence frequency exceeding 80% across all resampling runs were retained to filter spurious associations. The final BN, depicting the probabilistic dependencies between stroke and its potential predictors, is illustrated in Figure 2. In this network, it was observed that age, diabetes, sleeping disorder, CHD and drinking created direct connections with stroke, representing the most proximal risk determinants within the model hierarchy. Other variables were related to stroke indirectly through intermediate nodes. For instance, dietary fat reduction exhibited an indirect relationship with stroke risk, mediated by alcohol consumption. To facilitate clinical interpretation, pink nodes highlight direct risk factors, while green nodes identify upstream modifiable lifestyle factors, providing a visual roadmap for precision prevention strategies. The detailed dependency explanations are presented in Supplementary Table S4. Moreover, there were five pathways that mediated the indirect association between age and the stroke outcomes: (1) age→CHD→Stroke, (2) age→Diabetes→Stroke, (3) age→Diabetes→CHD→Stroke, (4) age→Smoking→RedFat→Drinking→Stroke, (5) age→RFIP→Smoking→RedFat→Drinking→Stroke.
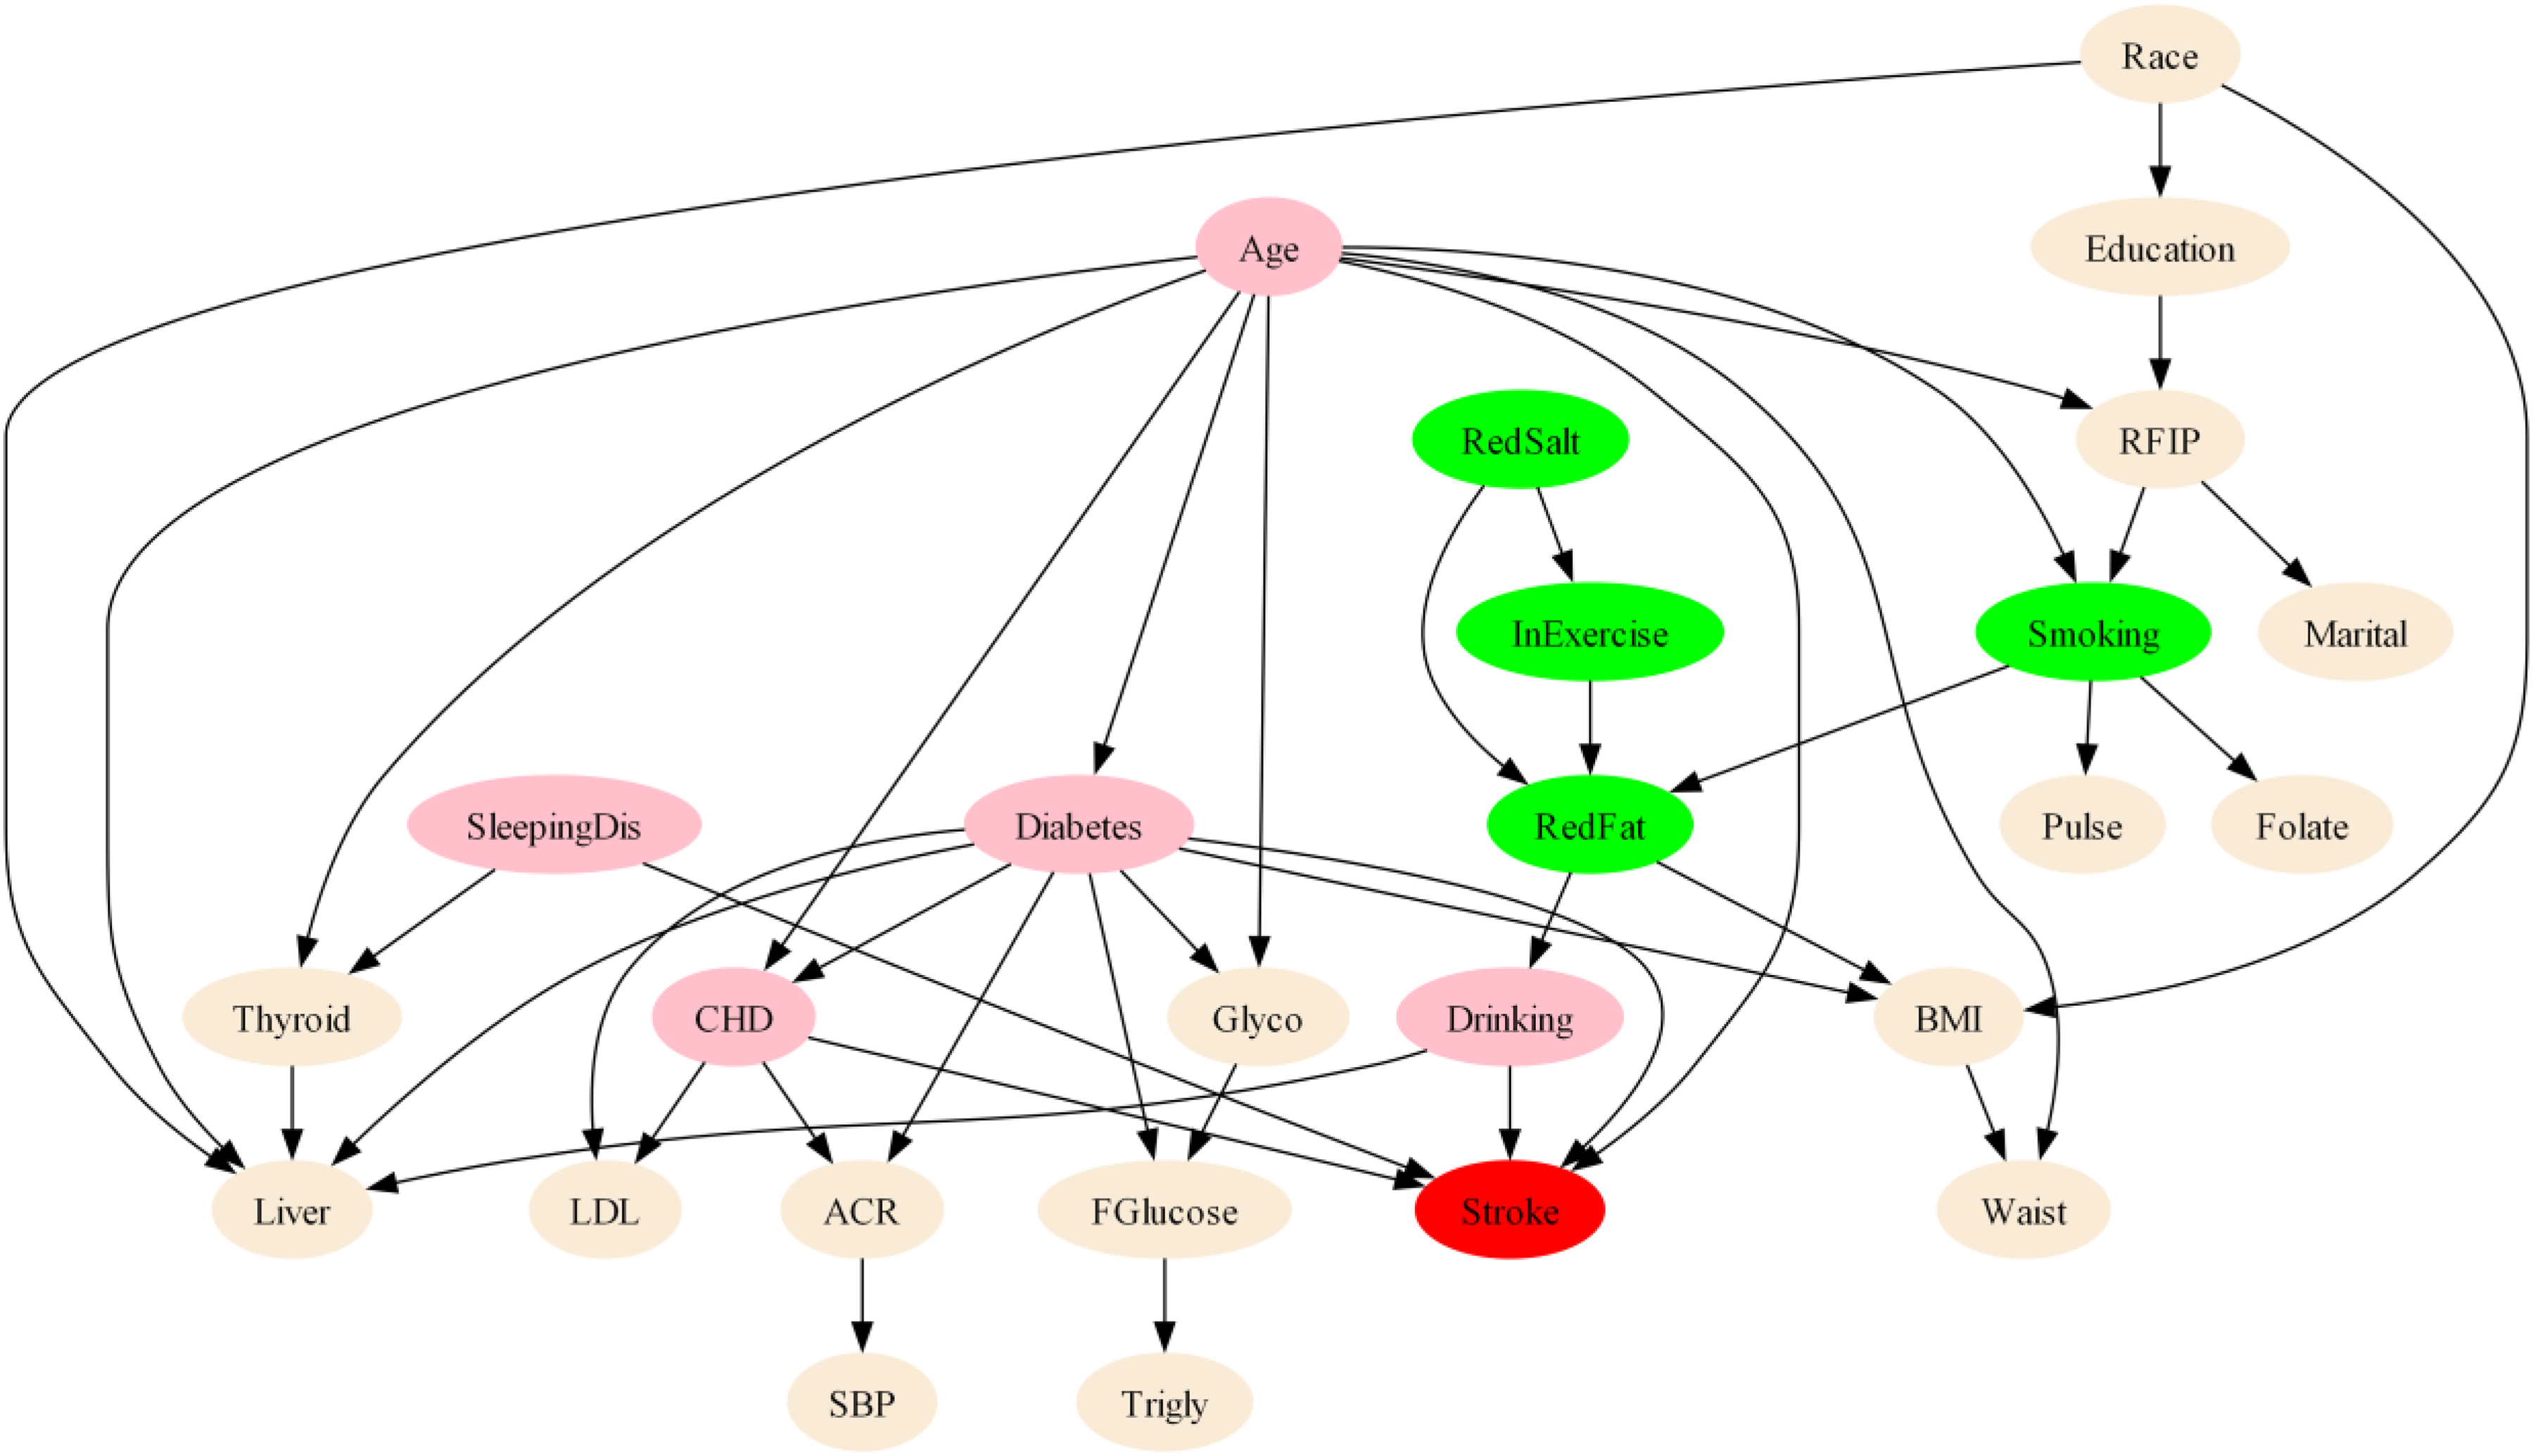
The BN topology of Stroke. RFIP, ratio of family income to poverty; BMI, body mass index; SBP, systolic blood pressure; ACR, albumin creatinine ratio; LDL, low density lipoprotein cholesterol; Glycol, glycohemoglobin; Fglucose, fasting glucose; SleepDis, sleep disorder; CHD, coronary heart disease; InExercise, exercise increase; RedSalt, salt reduction; RedFat, fat reduction; Trigly, triglyceride. Pink nodes represent direct risk determinants; Green nodes represent upstream modifiable lifestyle factors. Edges (arrows) represent probabilistic dependencies between variables, with the direction indicating the structural flow of risk propagation. Note: Several direct determinants (e.g., diabetes, drinking, and sleep disorders) are also clinically modifiable, but are highlighted in pink to emphasize their structural proximity to Stroke in the network.
Model inference and sensitivity analysis
Unlike standard ML models like random forest, which provide a static ranking of feature importance (Supplementary Figure S3), highlighting the key predictors used for classification, the BN enables dynamic simulations and provides superior structural interpretability; a detailed comparison is presented in Supplementary Table S5. Based on patient demographics and available clinical records (Supplementary Figure S4A), BNs enabled inference of individualized stroke occurrence probabilities. For example, a 70-year-old patient with comorbid diabetes and coronary heart disease who also presented with sleep disorders and alcohol consumption demonstrated a stroke probability of 32%. Intervention analysis revealed differential risk reduction patterns: alcohol cessation alone reduced stroke risk to 17% (a 15% reduction), while sleep disorder management alone decreased risk to 26% (a 6% reduction). However, concurrent implementation of both interventions—alcohol cessation and sleep disorder management—resulted in a stroke risk of 20%, representing a 12% reduction from baseline (Supplementary Figures S4B-4D illustrate this reasoning process). The observed non-additive effect of combined interventions suggests complex synergistic interactions between alcohol consumption and sleep disorders in stroke pathogenesis.
Figure 3 shows the sensitivity analysis of Stroke. Nodes colored in red contain parameters that are important for the calculation of the posterior probability distributions in those nodes that are marked as targets (Stroke has marked as targets). Gray-colored nodes do not contain any parameters that are used in the calculation of the posterior probability distributions over the target variables (Figure 3A). The tornado diagram (Figure 3B) shows the top-10 most sensitive parameters for a selected state of the target node. One-way sensitivity analysis using ±10% parameter perturbations demonstrated that baseline stroke probability varied modestly from 4.14% to 4.53%. Age distribution was the predominant factor influencing stroke probability. A 10% increase in the proportion of the oldest age group (age4) raised stroke probability to 4.53% (sensitivity coefficient +0.087), while increased prevalence in the youngest age group (age1) exerted a protective influence. Among risk factors, diabetes mellitus ranked after age: a 10% increase in diabetes prevalence yielded measurable increments in stroke risk. Sleep disorder prevalence demonstrated a substantially smaller effect.

Sensitivity analysis for Stroke. A:Risk reasoning of BN model for stroke.Age:age1∼age4 correspond to age groups 20∼35,36∼50,51∼65,>65; Race: race1∼race5 correspond to race groups Mexican, other Hispanic, White, Black, and other race; BMI:bmi1∼bmi4 correspond to BMI groups <18.4,18.4∼25,25.1∼30,>30;Education:edu1∼edu5 correspond to education level groups <9th,9∼11th,High School, Some college, college graduate; Marital, mar1∼mar3 correspond to marital status groups married, separated, and never married; RFIP: fip1∼fip4 correspond to RFIP groups <1, 1∼2,2.1∼3,>3; B: Tornado diagram. Sorted from the most to least sensitive, the horizontal axis shows the absolute change in the posterior probability of Stroke = Y when each of the parameter's changes by that percentage, red expresses negative and green positive change.
Discussion
Utilizing an extensive NHANES dataset spanning a decade, this study presents a robust evaluation of stroke risk within a comparative ML framework. The findings underscore the capacity of BNs to effectively capture conditional dependencies among sociodemographic and lifestyle factors, thereby elucidating five critical risk nodes and their associated mediating pathways. This approach moves beyond simple risk factor identification to a systems-level understanding of stroke etiology. By providing a biologically plausible and interpretable structure, this framework serves as a valuable tool for personalized risk assessment and the optimization of public health interventions.
BN analysis identified five critical risk factors exhibiting direct associations with stroke: age, diabetes, sleep disorders, CHD, and drinking. While these findings align with established epidemiological evidence, our model provides novel insights by framing these factors as actionable clinical gateways. Age represents a non-modifiable risk factor that consistently emerges as the strongest predictor across stroke prevention studies, reflecting the cumulative vascular damage and physiological decline associated with aging.21,22 The identification of diabetes 23 and CHD 24 as direct risk factors corroborates extensive literature demonstrating their roles in accelerating atherosclerosis and promoting thrombotic events through chronic inflammatory pathways and endothelial dysfunction. 25 Notably, sleep disorders emerged as a direct, independent determinant, whereas traditional risk scores often treat sleep hygiene as a peripheral concern. 26 Our model positions sleep as a primary intervention target, hypothesized to act through intermittent hypoxia and sympathetic activation.27,28 Similarly, alcohol consumption was identified as a direct arc to stroke within a complex comorbidity web, highlighting its immediate impact on blood pressure and coagulation pathways.29,30 By unmasking these direct dependencies, the BN identifies high-leverage points where clinicians can disrupt risk progression more effectively than is possible with static, linear assessment tools.
The learned DAG unmasks robust pathways that function as a structural roadmap for precision prevention (Figure 2). In this framework, age functions as both a distal root cause and a catalyst for intermediate cardiometabolic and behavioral cascades. CHD and diabetes mellitus emerged as the predominant mediators, accounting for the majority of age-attributable stroke risk. Existing evidence demonstrates that both conditions synergistically elevate stroke incidence.31,32 Their sequential arrangement (age → diabetes → CHD → stroke) suggests that chronic hyperglycemia accelerates atherosclerotic progression, thereby amplifying cerebrovascular risk.33,34 The network also captured lifestyle-oriented cascades initiated by socioeconomic status. The upstream positioning of the ratio of family income to poverty (RFIP) relative to smoking indicates that lower socioeconomic status propagates stroke risk through cascading adverse health behaviors rather than isolated exposures.35–37 Notably, dietary fat reduction functions as an intermediate mediator between smoking and alcohol consumption; this complex behavioral pattern may reflect compensatory dietary modifications.38,39 Collectively, these pathways indicate that effective stroke prevention strategies must simultaneously target cardiometabolic control (diabetes and CHD management) while addressing upstream socioeconomic determinants that influence smoking and alcohol consumption behaviors.40,41 As stroke arises from a multifaceted interplay of factors—including advanced age, systemic comorbidities, and emerging biomarkers—each requiring further refinement to establish definitive prognostic utility in clinical practice. 42 Future interventional studies should utilize this causal framework to quantify the comparative effectiveness of cardiometabolic versus socioeconomic policy interventions, thereby optimizing resource allocation and maximizing population-level stroke risk reduction.
This study presents several distinct advantages. First, leveraging a decade of population-based data from the NHANES database ensures substantial statistical power and high representativeness, facilitating a robust identification of stroke predictors that are generalizable to the broader U.S. population. Second, by employing a comparative benchmarking framework, this study demonstrated that BNs can achieve high predictive accuracy—comparable to state-of-the-art “black-box” models like XGBoost and Random Forest—while uniquely maintaining structural interpretability. Unlike traditional ML approaches, this probabilistic framework allows for bi-directional inference and “what-if” scenario analysis, enabling clinicians to move beyond static risk scores toward a more dynamic and nuanced understanding of patient-specific risk profiles. Traditional risk scores often fail to account for the synergistic effects of lifestyle and clinical factors. The BN structure addresses this by unmasking the dependency relationships, thereby offering a more granular tool for stroke risk assessment than conventional scoring systems. Third, the integration of a comprehensive spectrum of sociodemographic, clinical, and lifestyle variables offers a holistic perspective on stroke determinants. Notably, the identification of modifiable factors, such as sleep disorders and alcohol consumption, within a network-based structure provides actionable, evidence-based targets that account for the complex interdependencies inherent in stroke etiology.
Several limitations warrant consideration. First, residual confounding from unmeasured variables may influence the observed associations. Additionally, the applied feature selection strategy may have introduced selection bias by excluding variables with structural importance but low independent significance. Second, stroke outcomes in NHANES are primarily ascertained through self-reported data based on prior clinical diagnoses, which are susceptible to recall bias and misclassification. The absence of standardized neuroimaging confirmation or detailed clinical stroke subtype classification (e.g., ischemic vs. hemorrhagic) further limits the precision and clinical granularity of outcome assessment. Third, while BNs efficiently model complex probabilistic dependencies, their capacity to capture dynamic clinical progressions is constrained by the cross-sectional design of the NHANES data. Specifically, the lack of longitudinal tracking precludes the observation of temporal stroke stages, such as the transition from acute to chronic phases. Consequently, the identified pathways should be interpreted as probabilistic structural associations rather than validated causal trajectories. Fourth, despite using a nationally representative sample, this study lacks external validation in independent geographic or clinical cohorts. While our internal validation demonstrated high stability, the transportability of this BN-based risk architecture to diverse global populations requires further prospective validation before clinical implementation. Finally, the categorization of several continuous variables (e.g., age, BMI, SBP) into discrete bins, while facilitating interpretability in the BN, may oversimplify underlying dose–response relationships and attenuate the model's ability to capture nuanced gradients in risk.
Conclusions
This study demonstrates that an interpretable BN model serves as a valuable exploratory tool for mapping the complex interplay of risk factors contributing to stroke. Through a large-scale analysis of NHANES data, five critical factors—age, diabetes, sleep disorders, coronary heart disease, and alcohol consumption—were identified, with their probabilistic interdependencies systematically elucidated. While these findings are derived from cross-sectional data and require further validation, the BN framework offers a transparent alternative to traditional “black-box” models, facilitating the generation of testable hypotheses regarding risk pathways. This underscores the model's potential to inform risk stratification and the development of targeted prevention strategies. Future research is essential to validate these exploratory findings using longitudinal, multi-center datasets to establish temporal relationships and ensure the generalizability of the identified risk architecture across diverse clinical settings.
Supplemental Material
sj-docx-1-dhj-10.1177_20552076261434648 - Supplemental material for Identifying risk factors and predicting stroke using Bayesian networks: Evidence from NHANES 2011–2020
Supplemental material, sj-docx-1-dhj-10.1177_20552076261434648 for Identifying risk factors and predicting stroke using Bayesian networks: Evidence from NHANES 2011–2020 by Ju Zhao, Mingyang Zhang and Hongnian Wang in DIGITAL HEALTH
Footnotes
Acknowledgements
We thank the National Center for Health Statistics for providing the NHANES database and all participants who contributed to the NHANES study.
Ethics approval and consent to participate
This study used publicly available de-identified data from NHANES. The original NHANES study was approved by the National Center for Health Statistics Research Ethics Review Board. No additional ethics approval was required for this secondary analysis.
Consent for publication
Not applicable.
Authors’ contributions
JZ conceived the study, performed the analysis, and drafted the manuscript. MZ processed the data, developed the methodology, and conducted visualization. HW supervised the project and revised the manuscript. All authors reviewed the manuscript and approved the final version for publication.
Funding
The authors disclosed receipt of the following financial support for the research, authorship, and/or publication of this article: This research was supported by the Joint Co-construction Project of the Henan Provincial Medical Science and Technology Program (LHGJ20250479) and the Sichuan Science and Technology Program (2026NSFSC1446).
Declaration of Conflicting Interests
The authors declared no potential conflicts of interest with respect to the research, authorship, and/or publication of this article.
Guarantor
HW.
Clinical trial number
Not applicable.
Supplemental material
Supplemental material for this article is available online.