
Abstract
Objective
Depression among non-smokers at risk of second-hand smoke (SHS) exposure has been a neglected public health concern despite their vulnerability. The objective of this study was to develop high-performance machine-learning (ML) models for the prediction of depression in non-smokers and to identify important predictors of depression for second-hand smokers.
Methods
ML algorithms were created using demographic and clinical data from the Korea National Health and Nutrition Examination Survey (KNHANES) participants from 2014, 2016, and 2018 (N = 11,463). The Patient Health Questionnaire was used to diagnose depression with a total score of 10 or higher. The final model was selected according to the area under the curve (AUC) or sensitivity. Shapley additive explanations (SHAP) were used to identify influential features.
Results
The light gradient boosting machine (LGBM) with the highest positive predictive value (PPV; 0.646) was selected as the best model among the ML algorithms, whereas the support vector machine (SVM) had the highest AUC (0.900). The most influential factors identified using the LGBM were stress perception, followed by subjective health status and quality of life. Among the smoking-related features, urine cotinine levels were the most important, and no linear relationship existed between the smoking-related features and the values of SHAP.
Conclusions
Compared with the previously developed ML models, our LGBM models achieved excellent and even superior performance in predicting depression among non-smokers at risk of SHS exposure, suggesting potential goals for depression-preventive interventions for non-smokers during public health crises.
Introduction
Depression is a common mental disorder characterised by persistent sadness and lack of interest or pleasure in daily activities, with possible disturbances in areas including sleep, appetite, concentration, and self-perception. 1 According to a Global Burden of Disease study, depressive disorders have become the second-highest cause of years lived with disability in 2019. 2 The commonly identified risk factors for depression include youth, the female gender, low levels of education, living alone, low household income, current smoking, and unemployment.3–6
A robust association between smoking and depression has been replicated in numerous population-based studies 7 ; however, the association between second-hand smoke (SHS) exposure and depression remains questionable. 8 Several studies have indicated that SHS is closely associated with a psychosocial environment that increases the risk of depression.8–10 Non-smokers who are chronically and persistently exposed to SHS may have a lower overall socioeconomic status and a higher likelihood of being in stressful environments than those without SHS exposure. 11 SHS in women, who have a higher proportion of low socioeconomic status than men, is associated with higher levels of depression. 12 Exposure to SHS during childhood and adulthood was associated with increased depression in adulthood. 13 SHS can have physiological effects such as an increase in the cotinine level. Increased salivary cotinine levels indicated a higher likelihood of experiencing psychological distress and depressive episodes.14,15 The accumulative effect of nicotine can persistently influence endothelial, inflammatory, and haemostatic factors over time, even at low levels, similar to chronic cigarette use. 16
Thus, it is necessary for the Korean government to prioritise SHS exposure in non-smokers as an important public health concern while formulating tobacco and depression control policies. Overall, the SHS exposure rate in South Korea is approximately 38.1%, which is lower than that in China (49.2%) but higher than those in most other countries, such as Finland (14%) and the United States (20.2%).17,18 Moreover, most Korean female non-smokers exposed to SHS at home and male non-smokers exposed to SHS at workplaces face an elevated risk of both depression and suicidal ideation.19–21
Screening and diagnosing depression in non-smokers is an unaddressed medical and social issue. This is difficult in Korean primary care for several reasons. The government has prohibited non-psychiatric doctors from prescribing antidepressants for more than 2 months since 2002 and only partially relaxed this restriction in 2022. Additionally, a negative social perception exists among Koreans towards individuals with depression. In a study examining public reactions to individuals with depression in 11 countries, patients with depression in Eastern countries including Korea were more likely to be discriminated against than those in Western countries, and a tendency to view depression as being caused by moral reasons was observed. 22 Owing to the difficulty in diagnosing depression, suicide rate in Korea doubled from 2001 to 2011, and Korea has been ranked on top for the past 18 years, whereas the rates in Europe, Japan, and other OECD countries have been on a decline. To overcome institutional barriers for primary care physicians and social barriers for patients, automated tools that can be unconsciously applied will be needed.
Therefore, this study unprecedentedly focused on developing a prediction model for depression in non-smokers at risk of SHS exposure using machine-learning (ML) techniques to enhance the diagnosis rate of depression in Korea. Our aim was to develop high-performance ML models by recognizing important SHS-related features often overlooked in primary care settings, thereby identifying previously undiagnosed or under-diagnosed depressive patients.
Methods
Dataset
The data for this study were acquired from the sixth and seventh Korea National Health and Nutrition Examination Survey (KNHANES), which is a nationwide dataset that has been compiled by the Ministry of Health and Welfare of Korea to investigate the nutritional and overall health status of the general public since 1998. Since 2007, cross-sectional datasets of approximately 10,000 subjects have been established annually through stratified multilevel cluster sampling to ensure the representativeness of the sample and allow the findings of studies to be merged. 23 The methodology of the survey complied with the principles outlined in the Declaration of Helsinki. Initially, the KNHANES survey required approval from the Korea Disease Control and Prevention Agency Institutional Review Board. However, since 2014, research ethics approval has been exempted under the Bioethics and Safety Act.
In this study, a subset of demographic and clinical variables of the KNHANES dataset were selected as features of interest for predicting depression in non-smokers, and the list of selected variables is presented in Section 2.2. Because the measurement items of KNHANES vary slightly every year, we only used the datasets from the years that included measurements of all the features of interest (2014, 2016, and 2018); thus, we examined data from a total of 23,030 participants in this study. After excluding participants who were under the age of 19, without a Patient Health Questionnaire-9 (PHQ-9) score, missing independent variables, or current smokers, a total of 11,463 participants were included from the final analysis. Current smokers were excluded from the final dataset to identify the sole influence of SHS on depression. A flowchart of the data is presented in Figure 1.

Data flowchart.
Measurement
Depression labelling was performed using the PHQ-9, which is a self-reported questionnaire designed to assess depression severity among adults. 24 The PHQ-9 total score ranges from 0 to 27, and individuals with a total score of 10 or higher can be considered depressed. 25
KNHANES assessed >800 variables on various aspects of the health and nutritional status of participants. Two general physicians (HJS and OBJ) carefully reviewed all the variables within the survey and identified candidate variables potentially associated with depression. This selection was aimed at reducing the high dimensionality of variables before commencing the analyses. The diagnosis of depression through clinical interviews was not considered as a variable, because of the overlap with the total PHQ-9 score. Finally, 40 candidate variables were selected as the features of interest.
The features of interest included demographics, socioeconomic status, anthropometric characteristics, lifestyle or health behaviour variables, and systemic health conditions including physical and mental comorbidities. The demographic characteristics included age group, sex, residency, marital status, and education. Furthermore, socioeconomic variables, such as employment, family income level, number of family members, and national basic livelihood security, were included. The anthropometric features included height, weight, waist circumference, and body mass index.
The health behaviour factors related to smoking included urine cotinine level, lifetime experience of smoking, and SHS exposure in the office, at home, and in public. The alcohol consumption variable included drinking frequency for a year, the amount of alcohol consumed at once, the frequency of binge drinking, and whether a family doctor recommended abstinence and counselling on drinking problems within the past year.
Physical activity was evaluated according to the number of steps and number of days with middle- to high-intensity or muscular exercise per week. The overall quality of life, stress awareness, subjective health status, and damage caused by accidents or addiction in the past year were also included as health behaviour variables. Systemic comorbidities for common diseases such as hypertension, diabetes mellitus, renal failure, and various types of cancer were investigated.
Among these, some features were recoded or generated. Given that KNHANES does not provide age as a continuous value for individuals over 80 years old, the ages of subjects under 80 were divided into age groups using a 10-year cut-off. The cancer variable was based on the number of cancers each participant had. The SHS exposure variable was the total number of occurrences of exposure to SHS in the office, at home, and in public places.
Data analysis
The datasets were randomly divided into training and test sets. Stratified randomisation was performed so that the proportion of depression cases between the training and test sets was similar. All continuous variables were normalised via z-score standardisation, and categorical variables were coded as dummy features. 26 A student t-test was performed to compare the characteristics of the depressed and nondepressed groups. Variables with p-values of <0.05 were defined as statistically significant.
To achieve our research objective of developing a fast and accurate predictive model for depression diagnosis, we conducted forward selection, including only the essential variables for each model before building the predictive models. The feature selection was performed using the forward feature selection method implemented in mlxtend 1.8.0.
Several different ML models were selected and applied in this study to determine the model with the best accuracy and speed; we implemented logistic regression (LR), a traditional statistical model, to compare its performance with the relatively recently introduced ML models. Moreover, we used several ML algorithms including support vector machine (SVM), naive Bayes (NB), light gradient boosting machine (LGBM), random forest (RF), extreme gradient boosting (XGBoost), and multilayer perceptron (MLP). The SVM algorithm finds the optimal hyperplane to best separate and classify both linear and non-linear data. NB is a classification algorithm based on Bayes’ theorem that is a simple yet effective classification method. LGBM is a tree-based gradient boosting algorithm that is memory and computationally efficient, making it suitable for large-scale data. RF and XGBoost are both ensemble algorithms, while XGBoost uses gradient boosting to turn weak learners into strong ones by combining them, and RF combines multiple decision tree models to solve classification and regression problems. Finally, MLP is an artificial neural network capable of learning complex non-linear relationships. These classification algorithms are fast in prediction even with relatively low computing power and ensure safety in medicine because they are explainable conventional ML techniques. For each algorithm, a feature subset maximising the area under the curve (AUC) of the algorithm was obtained.
Model development and evaluation
Two solutions were adopted to resolve the issue of the frequency of depression classes being substantially higher than that of non-depression classes. The first approach involved oversampling, where samples from the minority class were duplicated within the training set. The second approach involved assigning weights inversely proportional to the class frequency for balancing the prediction loss across all classes. During the 10-fold cross-validation, hyperparameter tuning was applied to the training set. Along with the primary parameter (AUC), the sensitivity, specificity, positive predictive value (PPV), negative predictive value, and F1-score on the training set were computed. With the dataset used for hold-out testing, a model evaluation was performed. The same ML models, including LR, SVM, NB, RF, XGBoost, LGBM, and MLP, were employed. Their performance was evaluated using the same process, encompassing the entire sample of both smokers and non-smokers.
In addition, the fairness of the best model was evaluated by comparing the recently proposed model fairness metrics with the results of previous studies. The model fairness metrics, that is, disparate impact and equal opportunity difference, were calculated by dividing the total second-hand smoker population into subgroups based on sex and education level. For education-based fairness evaluation, the population was categorised into individuals who had completed high school and individuals who had not. Disparate impact refers to the proportion of positive predictions when one is in a privileged group over an unprivileged group. 27 Equal opportunity difference is the difference in the true-positive rates between groups. 28 The results of model development and evaluation using the complete samples and never-smoker samples are presented in the Supplementary Tables 1 and 2, respectively. The assessment of model fairness is presented in Supplementary Table 3.
Model interpretation method
Shapley additive explanation (SHAP) analysis and LR were performed for model interpretation. Initially, the individual SHAP values for each participant were computed. Subsequently, the significance of features was ranked, and a summary plot was generated to depict the SHAP values of all attributes. In addition, the relationship between smoking-related characteristics and SHAP values was investigated through a dependency plot. Furthermore, an LR analysis was conducted to arrange the features according to the beta coefficients. Modelling was conducted on the entire dataset to ascertain the significance of predictors in the overall population, encompassing both smokers and non-smokers.
Results
Characteristics of participants
Among the 23,030 participants in KNHANES 2014, 2016, and 2018, 6402 participants who did not respond to PHQ-9 were excluded. Among them, 4534 participants under age 19 were not eligible to use PHQ-9 as a screening tool for depression. Cases with missing values in the independent variables (N = 2311) and current smokers (n = 2800) were excluded from the final analysis. A total of 11,463 participants were split into the training (N = 9170) and test sets (N = 2293; Figure 1).
The characteristics of non-smokers included in the training set are presented in Table 1. Compared with the nondepressed group, the depressed group tended to be older, female, and of lower economic status and education levels (p < 0.001 for all). Furthermore, there were significant differences in smoking-related characteristics, including lifetime smoking (p = 0.04) and the proportions of SHS exposure at the office (p = 0.02), at home (p < 0.001), and in public (p = 0.004). There was no difference in the level of urine cotinine.
Characteristics of the non-smokers included in this study.

Notes. No.: number; SD: standard deviation; SHS: second-hand smoke. The demographic and smoking-related characteristics of the groups were compared using the independent t-test and chi-square test for continuous and categorical variables, respectively.
These refer to the ratio of participants who have experienced SHS exposure in the total group, depressed group, and nondepressed group, respectively.
Selected features from ML models
The features selected to build prediction models via forward feature selection are presented in Table 2. Among the models, NB selected the smallest number of features (n = 9), whereas LGBM selected the largest number of features (n = 43). The following variables were consistently selected across all the models: marital status, economic status, waist circumference, quality of life, and stress awareness. Most algorithms selected smoking-related features. The urine cotinine level and the severity of SHS exposure were each selected by five algorithms (urine cotinine level was selected by LR, SVM, RF, XGBoost, and LGBM; severity of SHS exposure was selected by LR, SVM, NB, XGBoost, and LGBM), and smoking history was selected by four algorithms (LR, RF, SVM, and XGBoost).
Selected features from forward feature selection.

Notes. LGBM: light gradient boosting machine; LR: logistic regression; MLP: multilayer perceptron; NB: naive Bayes; RF: random forest; SVM: support vector machine; XGB: extreme gradient boosting.
Predictive performance of ML models
The performance metrics of the models for depression prediction are presented in Table 3. The conventional LR analysis exhibited an AUC of 0.899, and its prediction sensitivity and specificity were 0.742 and 0.843, respectively. Among the ML algorithms, SVM exhibited the highest AUC (0.900), and RF exhibited the lowest AUC (0.878). As all models exhibited slight variations within the confidence intervals (Figure 2), LGBM, which had the highest PPV (PPV = 0.646), was selected as the best model. LGBM exhibited the highest accuracy, specificity, and F1-score among the models but had relatively low sensitivity. NB exhibited comparable performance to the other algorithms and used the smallest number of features. MLP exhibited the highest sensitivity; however, it had the lowest accuracy and F1-score.

ROC curves showing the model's prediction of depression in non-smokers.
Performance of machine-learning algorithms for depression prediction in non-smokers.

Notes. AUC: area under the curve; LGBM: light gradient boosting machine; LR: logistic regression; MLP: multilayer perceptron; NB: naive Bayes; PPV: positive predictive value; NPV: negative predictive value; ROC: receiver operating characteristics curve; RF: random forest; SVM: support vector machine; XGBoost: extreme gradient boosting.
The results of the model fairness analyses of LGBM, which exhibited the highest PPV, are presented in Supplementary Table 2. The model is unfair for the unprivileged group when the disparate impact is <1 or when the equal opportunity difference is <0.27,28 The disparate impact and equal opportunity difference for sex were 4.736 and 0.162, respectively, indicating that that the model is theoretically unfair for the male group. For education, the disparate impact was 2.250 and the equal opportunity difference was 0.021, suggesting that the higher education group is treated unfairly by the model.
Model interpretation by feature importance
In this study, we examined the feature importance of our best model by calculating the SHAP values of LGBM to capture non-linear relationships between features and analysed the mean SHAP values of the features. Among the 43 features, stress awareness was the most predictive, followed by subjective health status and quality of life. Among the smoking-related features, urine cotinine level was the most important, followed by SHS exposure severity and former smoking (Figure 3). There was no linear relationship between smoke-related features and SHAP values in the dependence plot (Figure 4).

Results of the SHAP analyses of the LGBM model.
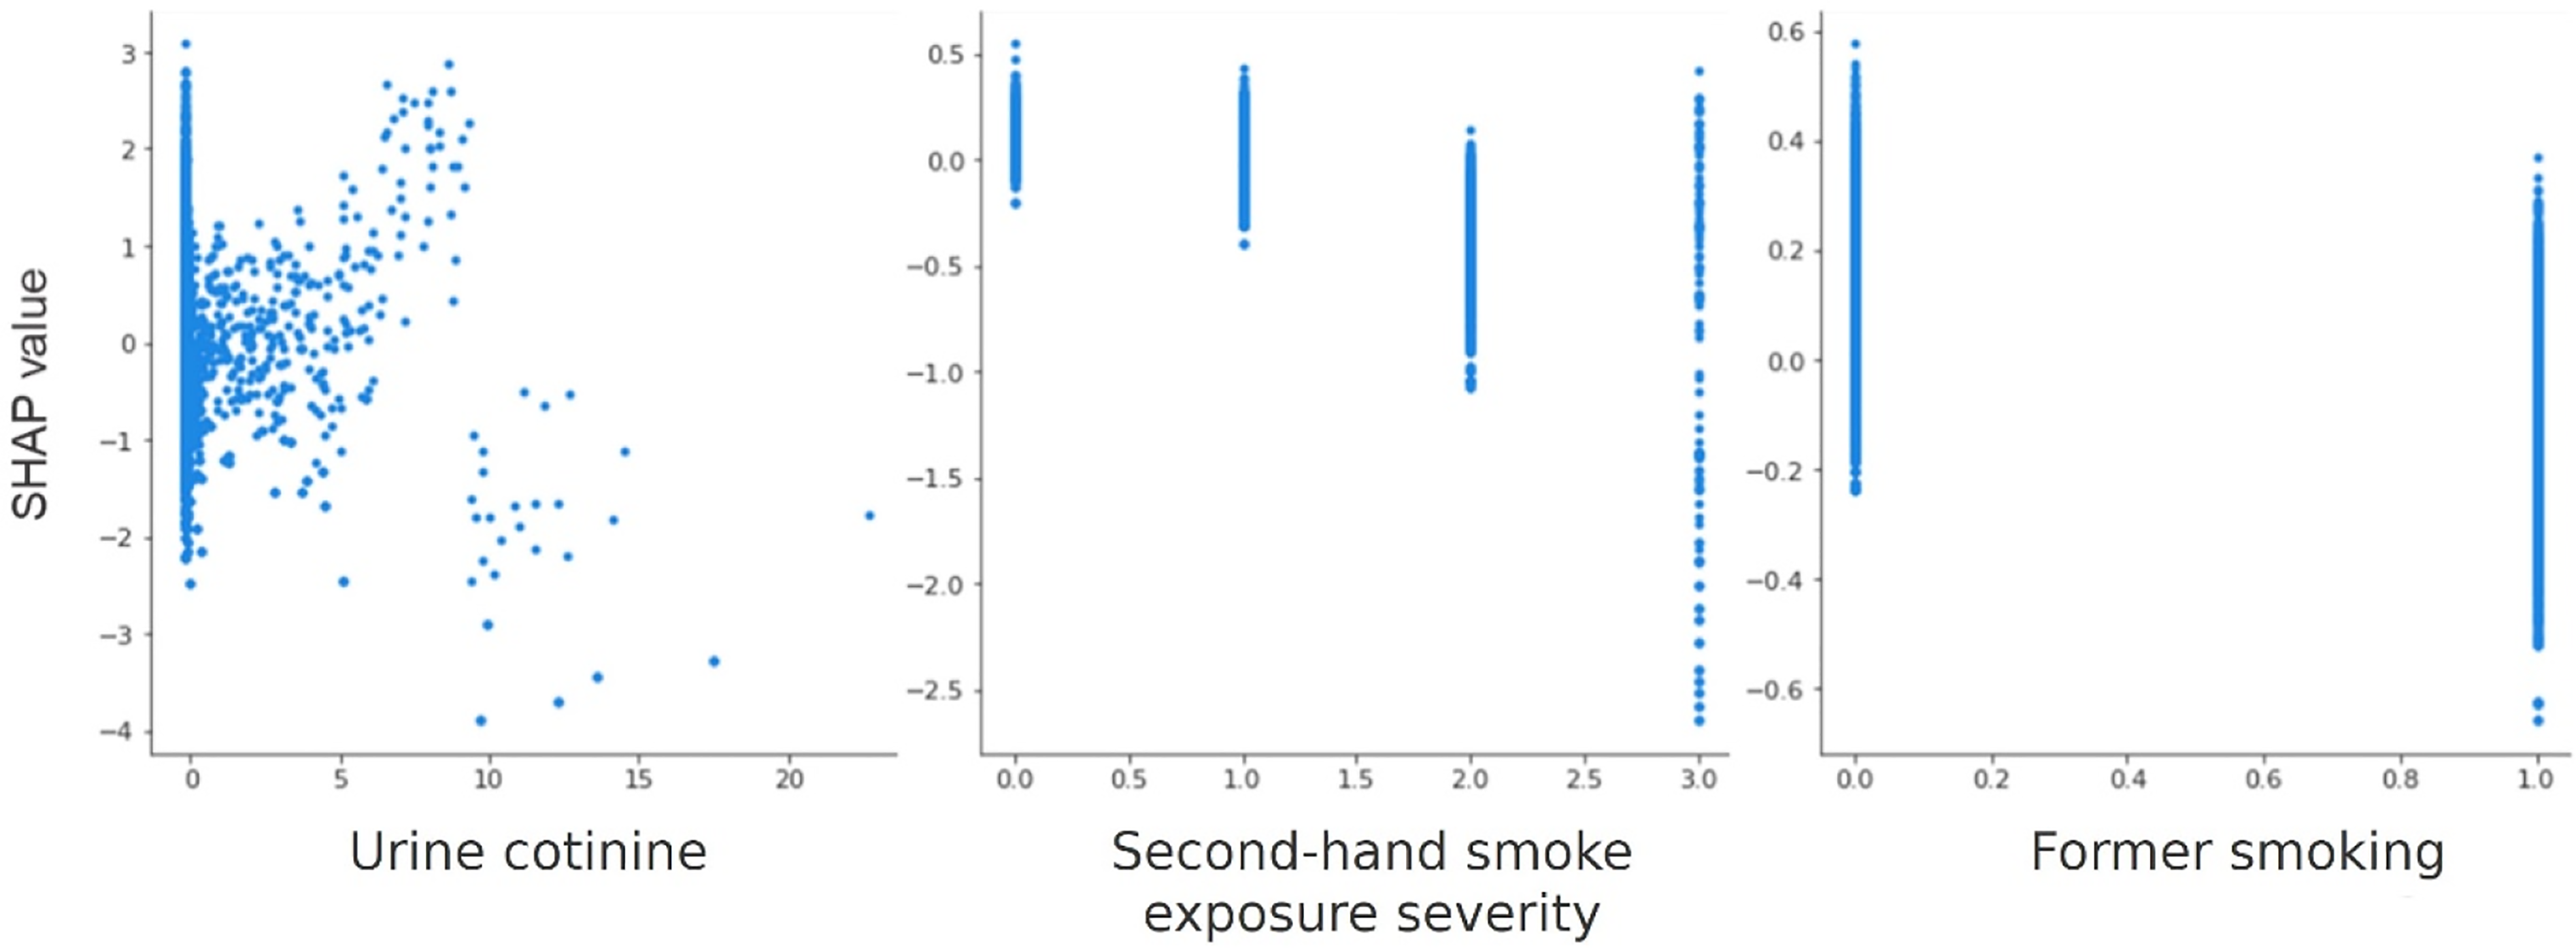
Dependence plots of smoking-related features.
For the model that trained on the total population, diabetes, thyroid disease, and steps were the most important features (Supplementary Figure 2). For the model that trained on the never-smokers, stress awareness, quality of life, and subjective health status were the most important features, which was consistent with the results of the non-smoker training model (Supplementary Figure 4).
Discussion
In this study, we developed high-performance ML models that can predict depression in non-smokers from sociodemographic and health-related variables of a representative dataset. Our objective was fulfilled because the results indicated a clear need for a different modelling approach for non-smokers.
Comparison with prior ML studies
Overall, the performance of our best model was excellent, with an AUC of 0.900 for the SVM, which was comparable to those of models that predicted depression in previous studies. 29 The prediction performance in our study was superior to that achieved by Oh et al., 30 who used the same cohort data to predict depression in the general population. The proportion of depressive patients included was approximately 5%, indicating a severe class imbalance similar to that in the previous studies. Considering this characteristic, we selected PPV as an important performance metric to check the reliability of positive prediction by models because it prioritises ‘true-positive’ patients for further evaluation and management. 31 Our LGBM model outperformed other conventional ML classifiers, achieving a remarkably high PPV (0.643), which significantly exceeded that reported by Oh et al. 30 In summary, we successfully developed a depression prediction model for non-smokers, which is a useful diagnostic tool for clinical applications.
Subjective factors dominantly predict depression
We found that self-reported subjective features such as ‘stress awareness’, ‘quality of life’, and ‘subjective health status’ ranked the highest in the feature importance analysis. This is consistent with previous research suggesting that the onset of depression depends more on cognitive processes than on actual stress; however, in analysing the general population, including current smokers, the presence of systemic diseases such as diabetes, thyroid disease, cirrhosis, and dermatitis emerged as the top-ranked features, with a greater contribution to the prediction of depression (Supplementary Figure 2). This indicates that physical conditions caused by smoking may play a role in the development of depression, 32 which suggests that detecting depression in non-smokers at risk of SHS exposure requires a different approach. In particular, the similarity between the feature importance analysis results of the never-smoker model and the non-smoker model suggests that the two groups are quite homogeneous in terms of depression prediction. For non-smokers including never-smoker and ex-smoker, it is necessary to inquire about the perceived subjective stress and lifestyle of patients or implement relevant diagnostic tools to replace the time-consuming history-taking.
Impact of smoking-related features
As smoking-related features, we selected smoking history, SHS exposure, and urine cotinine levels, which were generally retained in the feature selection process. The LR analysis revealed that all three features were statistically significant predictors, and the likelihood of depression was higher with smoking history, a higher severity of SHS, and higher urine cotinine levels, albeit marginally. In the SHAP analysis, urine cotinine was selected as the top seventh feature; however, smoking history and the severity of SHS were less important. These results indicate that smoking-related variables are strong risk factors for depression, suggesting that not only psychosocial factors but also physiologic changes caused by SHS may serve as risk factors for depression. However, a dose–response linear trend between cotinine and depression was not evident in this study. Extreme vertical dispersion of SHAP values was observed for individuals exposed to SHS at low levels and above a certain level. A higher urine cotinine level corresponded to a higher SHAP value, above which the trend gradually disappeared (Figure 4). This result indicates that gradient boosting machine algorithms can capture non-linear relationships between the feature and the outcome. Previous studies indicated that increased salivary cotinine levels and a higher frequency of SHS exposure (>1 h per day) are associated with higher odds of psychological distress and depression episodes.14,15 These conflicting results can be attributed to the interactive effect of cotinine levels with other features, and they should be confirmed in future studies.
Waist circumference as controversial feature
The SHAP analysis indicated that a smaller waist was more predictive of depression. Many previous studies revealed a mixed association (linear, U-shaped, or none) between obesity and depression. Extensive data favoured a positive, linear association between obesity and depression, because of the strong evidence supporting the genetic and epigenetic overlap between these conditions in the pathway of chronic inflammation.33–35 However, most studies from Asian countries have favoured a U-shaped or negative association, suggesting depressive vulnerability in underweight adults as well. 36 Among them, some studies demonstrated a stronger and more pronounced association between underweight individuals and depression, compared with that of obese individuals, which is consistent with our findings.30,37 A smaller waist may suggest lower body mass and energy, which can have a negative impact on daily activities. Although we are hesitant to suggest linearity of the relationship from our study, it is important to not overlook the influence of a ‘smaller waist’ for predicting depression in non-smokers.
Implications and limitations of this study
Although PHQ-9 is an excellent depression screening and monitoring tool in primary care, it has limitations as a diagnostic tool. For example, a significant number of patients with bipolar disorder may be misdiagnosed as having major depressive disorder when PHQ-9 is applied, and in these cases, symptoms may worsen with antidepressant treatment. 38 In actual psychiatric clinical settings, major depressive disorder is diagnosed using the DSM-5 (Diagnostic and Statistical Manual of Mental Disorders) criteria. According to the primary care guidelines for depression issued by the Korean Medical Association and Korea Disease Control and Prevention Agency, the role of PHQ-9 is limited to a screening tool. Additionally, to diagnose depression, applying the DSM-5 criteria and comprehensively evaluating factors such as functional status, past medical history, alcohol consumption, and recent stressors are recommended.
Given that depression screening tools such as PHQ-9 lack measurements for stress awareness, quality of life, subjective health status, and smoking or SHS-related features, we believe that our models successfully identified significant features for predicting depression that may not be screened by current tools. However, obtaining all these 43 important features in primary care settings is challenging; therefore, it may not serve as a suitable substitute for current screening tools such as PHQ-9. Nonetheless, this model has highlighted the necessity of incorporating subjective features alongside the objective PHQ-9 to enhance diagnostic efficiency. Because the diagnosis of depression in a psychiatric clinic is considerably more multifaceted and comprehensive than screening using the PHQ-9, this comprehensive approach has the potential to improve the diagnosis accuracy of depression. In addition, the methodology of this study can be used in the future when developing a depression diagnosis tool by learning from data containing more accurate answers than PHQ-9.
ML is needed to develop screening and diagnostic tools for various cultures and countries. The accuracy of PHQ-9 varies by country and race. 39 ML-based screening and diagnostic tools optimised for each separate population group can serve as promising alternatives to overcome this limitation. Customised ML models may be developed by selecting features specific to particular countries, racial groups, or any subgroups. In our study, we observed that the predictive capability improved when analysing the non-smoker subgroup compared with all participants (non-smokers and current smokers). Similarly, depression screening tools must evolve and be customised to the characteristics of specific populations rather than applying the same, single tool to any subgroup populations.
This study has several limitations. First, because this was a cross-sectional analysis, determining whether the same important features can prospectively predict depression risk is necessary. Therefore, further study using longitudinal datasets is necessary to validate whether the current ML models maintain similar performance.
Second, our study focused on non-smokers at risk of SHS exposure; therefore, a relatively small sample dataset (N = 11,463) was used to build a prediction model for depression. Our top-performing model, that is, LGBM, is a tree-based learning algorithm recognised for its high training speed due to low memory usage. It offers high accuracy – particularly when working with large survey datasets. It is possible that the performance of our ML model can be enhanced by increasing the sample size. Moreover, a model fairness evaluation of our LGBM model indicated relatively unfair results for the male group compared with a previous study, likely because there were far more women than men diagnosed with depression in the SHS population (Supplementary Table 2). To build a more accurate and fairer model applicable to the general population, it may be necessary to conduct studies using a larger and more diverse sample of non-smokers with depression. Privileged groups were relatively underrepresented in both sex and education levels, and this result is attributed to the lack of training data, which makes them less likely to accurately predict depression. While the LGBM model used in this study was found to be conceptually unfair for the privileged group, men, and people who graduated from high school, it is difficult to determine the level of the unfairness of the model, because of the lack of a definite standard for evaluating model fairness metrics.
Third, implementing our ML model in primary care settings may pose challenges. There are many diagnostic tools available for depression screening; however, no single tool has been preferred over others with regard to validity, reliability, efficiency, and usability. Our findings indicated that subjective features such as ‘stress awareness’, ‘quality of life’, and ‘subjective health status’ had a more significant impact on predicting depression in the non-smoking group than more objective smoking-related features such as ‘smoking history’, ‘severity of SHS exposure’, and ‘urine cotinine level’. Obtaining subjective information from patients may introduce recall bias when the patients complete surveys or questionnaires. However, integrating web or mobile-based medical questionnaires before health check-ups or office visits may be an effective alternative approach for overcoming the limitation because self-reported, subjective information plays a crucial role in detecting depression in non-smoking groups.
Our findings can be used to develop a data-based clinical decision support system using electronic medical records for the diagnosis of depression, which may be useful for combining the knowledge of healthcare providers and information provided by our ML models at the point of care. It can provide a customised and individualised diagnostic approach for both smokers and non-smokers by identifying at-risk depressive patients based on the data input.
Conclusion
The Korean Ministry of Health and Welfare has recently responded to unmet mental healthcare needs by increasing public awareness of the importance of depression screening and treatment. On December 1, 2022, the 60-day prescription limit on selective serotonin reuptake inhibitor-based antidepressants for non-psychiatric doctors was discarded, allowing several patients with depression to be identified and treated appropriately. 40 In addition to such efforts, working towards the development of simple and widely applicable depression screening tools that can be easily used in primary care settings has potential to mitigate the national burden associated with depressive disorders. Further research on the development and application of ML models integrating human intelligence and artificial intelligence for predicting depression in smokers and non-smokers can provide high-quality evidence for developing clinical practice guidelines for depression.
Supplemental Material
sj-docx-1-dhj-10.1177_20552076241257046 - Supplemental material for Machine-learning model for predicting depression in second-hand smokers in cross-sectional data using the Korea National Health and Nutrition Examination Survey
Supplemental material, sj-docx-1-dhj-10.1177_20552076241257046 for Machine-learning model for predicting depression in second-hand smokers in cross-sectional data using the Korea National Health and Nutrition Examination Survey by Na Hyun Kim, Myeongju Kim, Jong Soo Han, Hyoju Sohn, Bumjo Oh, Ji Won Lee and Sumin Ahn in DIGITAL HEALTH
Footnotes
Acknowledgements
None.
Contributorship
NHK and MK, protocol development, gaining ethical approval, machine learning training, data analysis, drafted manuscript. JSH, researched literature and conceived the study, funding application, study supervision, data collection, drafted manuscript. HS, involved in protocol development, machine learning training, drafted manuscript. BO, JWL, and SA, researched literature and conceived the study, drafted manuscript. All authors reviewed and edited the manuscript and approved the final version of the manuscript.
Declaration of conflicting interests
The authors declared no potential conflicts of interest with respect to the research, authorship, and/or publication of this article.
Ethical approval
The methodology of the survey complied with the principles outlined in the Declaration of Helsinki. Initially, the KNHANES required approval from the Korea Center for Disease Control Institutional Review Board. Since 2014, research ethics approval has been exempted under the Bioethics and Safety Act.
Funding
The author(s) disclosed receipt of the following financial support for the research, authorship, and/or publication of this article: This work was supported by an Institute of Information & Communications Technology Planning & Evaluation (IITP) grant funded by the Korean government (MSIT) [grant number 2022-0-00184, Development and Study of AI Technologies to Inexpensively Conform to Evolving Policy on Ethics] and the Basic Science Research Program through the National Research Foundation of Korea (NRF) funded by the Ministry of Education [grant number 2021R1F1A1060787].
Guarantor
JSH.
Supplemental material
Supplemental material for this article is available online.
References
Supplementary Material
Please find the following supplemental material available below.
For Open Access articles published under a Creative Commons License, all supplemental material carries the same license as the article it is associated with.
For non-Open Access articles published, all supplemental material carries a non-exclusive license, and permission requests for re-use of supplemental material or any part of supplemental material shall be sent directly to the copyright owner as specified in the copyright notice associated with the article.