
Abstract
Objective
Exacerbation of chronic respiratory diseases leads to poor prognosis and a significant socioeconomic burden. To address this issue, an artificial intelligence model must assess patient prognosis early and classify patients into high- and low-risk groups. This study aimed to develop a model to predict in-hospital mortality in patients with chronic respiratory disease using demographic, clinical, and environmental factors, specifically air pollution exposure levels.
Methods
This study included 6272 patients diagnosed with chronic respiratory diseases comprising 39 risk factors. Air pollution indicators such as particulate matter (PM10), fine particulate matter (PM2.5), CO, NO2, O3, and SO2 were used based on long-term and short-term exposure levels. Logistic regression, support vector machine, random forest, and extreme gradient boost were used to develop prediction models.
Results
The AUCs for the four models were 0.932, 0.935, 0.933, and 0.944. The key risk factors that significantly influenced predictions included blood urea nitrogen, red blood cell distribution width, respiratory rate, and age, which were positively correlated with mortality prediction. In contrast, albumin, lymphocyte count, diastolic blood pressure, and SpO2 were negatively correlated with mortality prediction.
Conclusion
This study developed a prediction model for in-hospital mortality in patients with chronic respiratory disease and demonstrated a relatively high predictive performance. By incorporating environmental factors, such as air pollution exposure levels, the model with the best performance suggested that 365 days of exposure to air pollution was a key risk factor in mortality prediction.
Introduction
Asthma and chronic obstructive pulmonary disease (COPD) are the most common chronic respiratory diseases worldwide, 1 and the exacerbation of symptoms in chronic respiratory diseases is not only associated with poor prognosis but also with an increased socioeconomic burden due to treatment costs. 2 The mortality rate of patients with chronic respiratory diseases admitted to the intensive care unit is as high as 29%. 3 In the United States, the direct costs associated with chronic respiratory diseases are estimated at $32 billion annually, with indirect costs at $20.4 billion annually. 2 To mitigate these risks, it is essential to perform early prognostic assessment of patients, classify them into high- and low-risk groups, and prevent unnecessary cost increases through timely treatment. 3 Numerous studies have been conducted to identify the risk factors for chronic respiratory diseases and predict symptom exacerbation based on these risk factors.
Risk factors for chronic respiratory diseases include demographic characteristics such as sex and age and clinical characteristics such as body measurements, medical history, vital signs, blood tests, and functional tests.4–7 Rezaee et al. identified significant risk factors for the acute exacerbation of chronic respiratory diseases, including patient age among demographic characteristics, respiration, pulse, smoking history, and medication use among clinical characteristics. 5 Blood test results have been used as biomarkers for chronic respiratory diseases, including red blood cell, white blood cell, platelet, hemoglobin, hematocrit, and neutrophil and eosinophil counts.6,7
These demographic and clinical characteristics have been used to predict exacerbation of chronic respiratory diseases. Goto et al. developed predictive models for the exacerbation of asthma and COPD in patients presenting to the emergency department using demographic and clinical characteristics, dividing patients into critical care and hospitalization groups. 8 Gradient boosting machine (GBM) showed a concordance statistic (C-statistic) of 0.80 for critical care, and random forest (RF) showed a C-statistic of 0.83 for hospitalization. 8 Shiroshita et al. developed and compared extreme gradient boost (XGB) and statistical models to predict in-hospital mortality of COPD patients, reporting AUCs of 0.71 and 0.69, respectively. 9 Zein et al. developed models to predict hospitalizations due to symptom exacerbation in asthma and COPD patients, reporting AUCs of 0.81, 0.79, and 0.85 for logistic regression (LR), RF, and LightGBM, respectively. 10
The significance of previous studies lies in the proposal of machine learning models that are superior to simple statistical analyses. 11 Predictive models using machine learning have the advantage of obtaining stable predictive results compared to statistical models by considering nonlinear interactions between independent variables from large datasets.8–10 However, the models in previous studies have low performance for clinical applications and lack universality, as they arbitrarily divide patient groups to develop individual predictive models. Additionally, they are limited as they predict exacerbations using only demographic and clinical characteristics without considering patients’ environmental characteristics.
The environmental characteristics of patients include economic level, presence of a caregiver, residential area, and degree of exposure to air pollution, with the latter showing a high correlation with respiratory diseases.4,12,13 Furthermore, fine particulate matter, an indicator of air pollution, affects acute exacerbation and 30-day readmission regardless of the disease. 14 However, no studies have evaluated the prognosis of the most vulnerable respiratory diseases or predicted symptom exacerbations using these air pollution concentrations. Therefore, a predictive model applicable to patients with chronic respiratory diseases that includes statistically significant risk factors and environmental risk factors related to patients, such as the degree of exposure to air pollution, is needed.
In this study, we aimed to predict in-hospital mortality due to symptom exacerbation of chronic respiratory diseases using patients’ demographic and clinical characteristics as well as environmental characteristics, such as the degree of exposure to air pollution. By utilizing machine learning, we propose a model that aids therapeutic decision-making in clinical settings by early assessment of the prognosis of patients diagnosed with and hospitalized for chronic respiratory diseases and categorizing patients into high-risk and low-risk groups based on in-hospital mortality predictions.
Methods
Development environment
In this study, an Intel® Core™ i9-10900 (Intel, Santa Clara, CA, USA) system with 32 GB RAM was used, and experiments were conducted using Python (version 3.7.0, Python Software Foundation, Wilmington, DE, USA) on a 64-bit CPU. Model training was performed using a framework based on Scikit-learn (version 1.0.2), Imblearn (version 0.13.0) and statistical analysis was performed using MedCalc (Version 19.6.1, MedCalc Software, Ostend, Belgium).
Data collection
This study was designed as a retrospective chart review study and was conducted at Gachon University Gil Medical Center in Incheon, South Korea. We collected electronic health record data from 6272 patients diagnosed with chronic respiratory diseases as their primary diagnosis, who were admitted to Gachon University Gil Medical Center and resided in Incheon from 1 January 2019 to 31 December 2023. The patients included 628 in-hospital mortality and 5644 control who were discharged normally after treatment during the same period. The in-hospital mortality group data was retrospectively collected for patients who died within 30 days of hospitalization. The entire dataset was randomly split into training (n = 5017) and test (n = 1255) datasets in a ratio of 8:2. The primary diagnostic codes of the patients were based on the International Classification of Diseases (ICD 10), as shown in Supplementary Materials 1. All data related to patient information were collected from the Clinical Research Data Warehouse (CRDW) after obtaining approval from the Institutional Review Board (GBIRB2024-167) at Gachon University Gil Medical Center. Information on air pollution in the patients’ residential areas was collected through the Environmental Information Disclosure System (https://air.incheon.go.kr/) using measurement records from regional urban air quality monitoring stations.
Patient data comprised 30 clinical factors and nine non-clinical factors based on the risk factors that affect chronic respiratory diseases (Supplementary Materials 2). Clinical factors include demographic characteristics, severity, acute clinical stability, and physical functional status, which can be identified upon patient admission. 4 In this study, clinical factors included age, gender, vital signs (blood pressure, 15 body temperature, pulse, 16 respiration, 16 oxygen saturation, 16 and laboratory values (Hb, 17 Hct, 17 PLT, neutrophils, 18 lymphocytes, 19 basophils, monocytes, eosinophils, 18 MCV, 17 MCH, 17 MCHC, 17 MPV, 20 PDW, 21 red blood cell distribution width (RDW),22,23 sodium, 24 potassium, calcium, 25 total bilirubin, blood urea nitrogen (BUN),26,27 creatinine, albumin,28,29 and hsCRP. 17 Non-clinical factors include psychological, cognitive, and social functioning; cultural, ethnic, and socioeconomic beliefs and behaviors; and health-related quality of life, which are more indirectly related to health status or functional level than clinical factors. 4 Non-clinical factors included the patient's residential area, marital status, smoking status, and concentration of air pollutants in the residential area, specifically particulate matter (PM10), fine particulate matter (PM2.5), CO, NO2, O3, and SO2. In this study, the 34 factors mentioned previously were used as independent variables, and the patient's in-hospital mortality was used as the dependent variable.
Data preprocessing
All patients underwent repeated vital sign measurements and hematological tests during hospitalization, resulting in a large amount of data on vital signs and laboratory values. Therefore, the mean value of each variable was calculated. For air pollution indicators, PM10, PM2.5, CO, NO2, O3, and SO2 were used, and the patients’ residential areas were used at the district level. Each indicator was preprocessed into long-term and short-term exposure levels by residential area. The long-term exposure level was calculated as the average value over 365 days based on the patient's admission date. Short-term exposure levels were calculated as the average values over 7 and 3 days based on the patient's admission date.
Data were separated into categorical and numerical variables (Supplementary Materials 2). Categorical variables were mapped to integers corresponding to each category and then converted to the numerical value of that category. Subsequently, categorical and numerical variables were normalized to a range of 0–1 for application to the machine learning models. The training dataset was undersampled using the RandomUnderSampler algorithm from the Imblearn library to prevent model overfitting due to data imbalance (n = 1004), ensuring that the mortality and control groups were trained at an equal ratio (Figure 1).
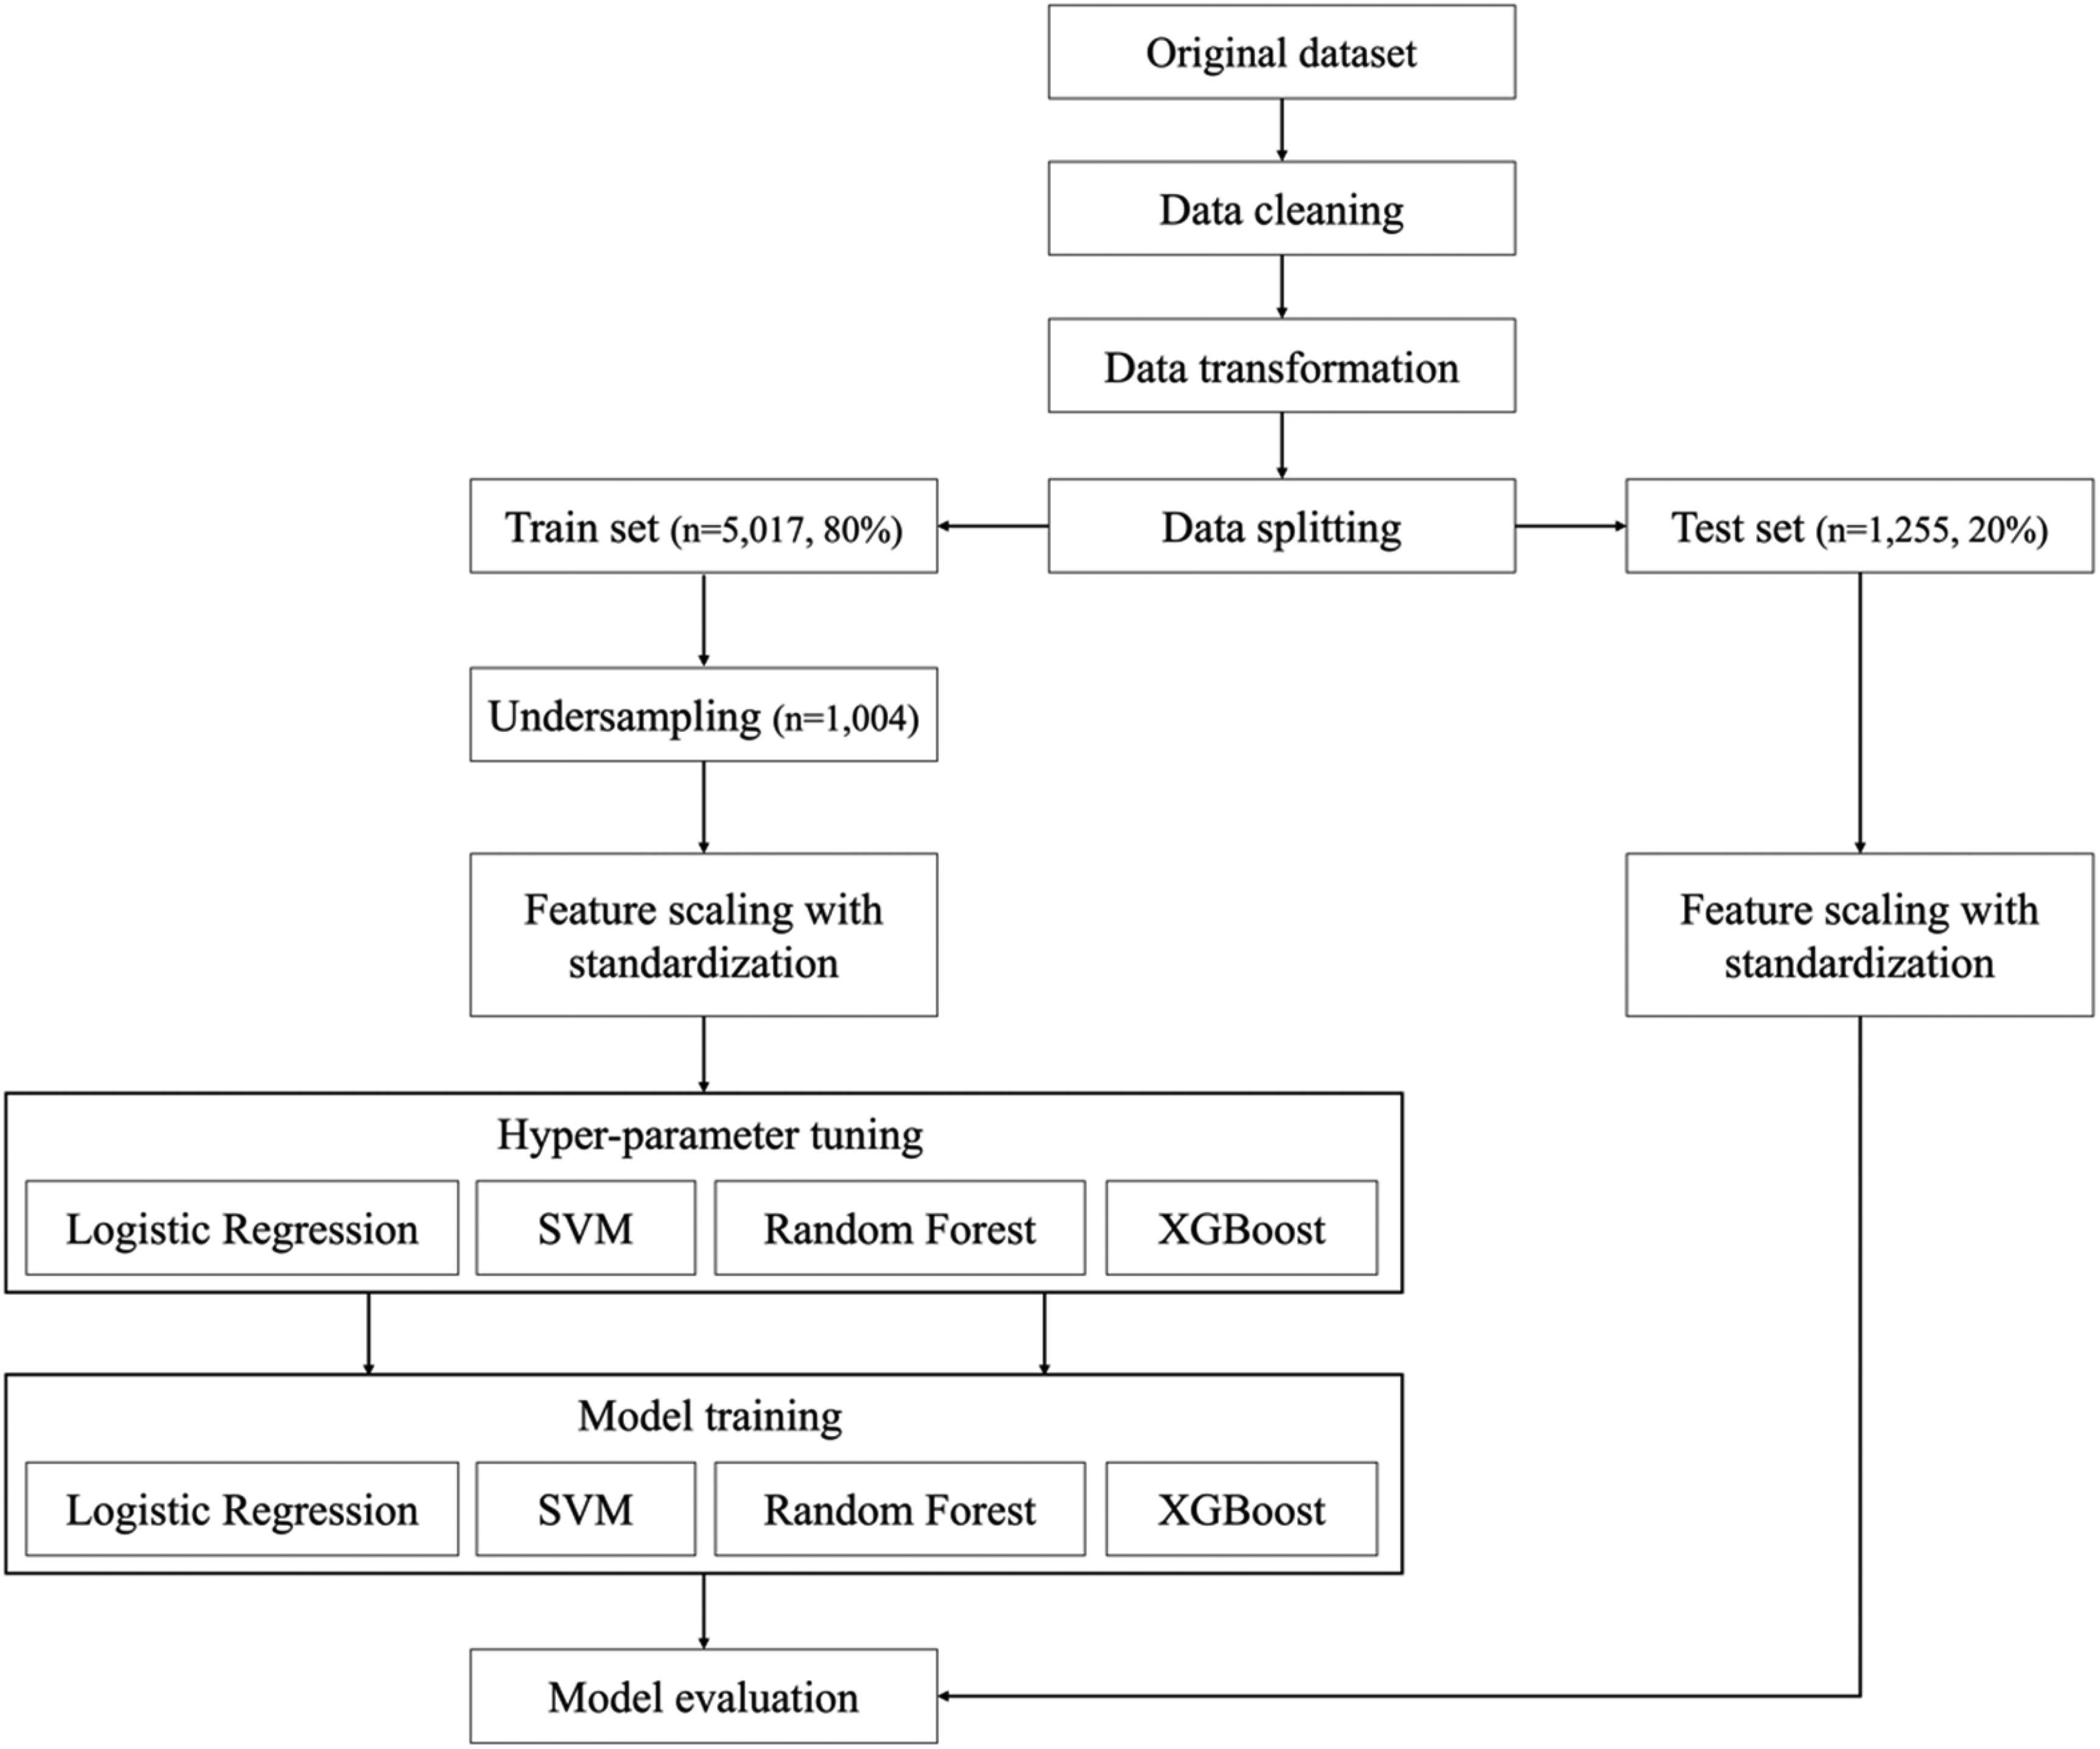
Flow chart of data preprocessing and modeling.
Model training
In this study, the machine learning classification models used were LR, support vector machine (SVM), RF, and XGB. LR is a basic and effective machine learning method suitable for binary classification and modeling probabilities based on a sigmoid function. 30 SVM, developed by Vapnik and Chervonenkis in 1963, is a classification model that can transform nonlinear inputs into a linear state, depending on the kernel function used.31,32 RF, an ensemble model developed by Breiman in 2001, prevents overfitting by expanding processing based on the amount of information while maintaining statistical efficiency.33,34 XGB is an enhanced version of the traditional Gradient Tree Boosting algorithm that incorporates techniques to prevent overfitting and has the advantage of fast classification through parallel processing. 35 As shown in Figure 1, the training parameters of the four models were optimized using a grid-search technique for hyperparameter tuning. The optimized parameters are listed in Supplementary Materials 3.
Statistical analysis
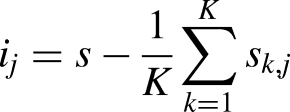
Continuous data among the independent variables were analyzed using an independent sample t-test to test the statistical significance between the control and expired groups. Additionally, all independent variables were quantitatively evaluated for their impact on mortality prediction using permutation importance.
36
The permutation importance was calculated using an algorithm provided by Scikit-learn, and the importance (ij) of each independent variable (j) was calculated using the model's performance metric (s), specifically the AUC, as shown in the following formula:
Results
A total of 2259 participants were used to train and validate the models. Fivefold cross-validation was performed on the training dataset (n = 1004) using the grid-search technique, and the models trained with the optimal parameters were evaluated using the test dataset (n = 1255). The statistical characteristics of the clinical and non-clinical factors collected from the subjects are presented in Tables 1 and 2, respectively. The average ages of the control and expired groups were 75 and 83 years, respectively, with males constituting 52.4% and 64.0% of each group. The most common residential areas in both groups were the same. The majority were married (86.1% and 87.3% in the control and expired groups, respectively), and nonsmokers accounted for 80.4% and 85.2%, respectively. There were statistically significant differences between the control and expired groups in most clinical factors, except for body temperature and MCH, and in non-clinical factors, precisely the 365-day average values of CO, NO2, and O3 and the 7 days average value of NO2 (p < 0.05).
Clinical characteristics of patients in chronic respiratory disease.

SBP: systolic blood pressure; DBP: diastolic blood pressure; SpO2: saturation pulse oxygen; Hb: hemoglobin; Hct: hematocrit, PLT: platelet count; MCV: mean corpuscular volume; MCH: mean corpuscular hemoglobin; MCHC: mean corpuscular hemoglobin concentration; MPV: mean platelet volume; PDW: platelet distribution width; RDW: red blood cell distribution width; BUN: blood urea nitrogen; hsCRP: high-sensitivity C-reactive protein.
Non-clinical characteristics of patients in chronic respiratory disease.
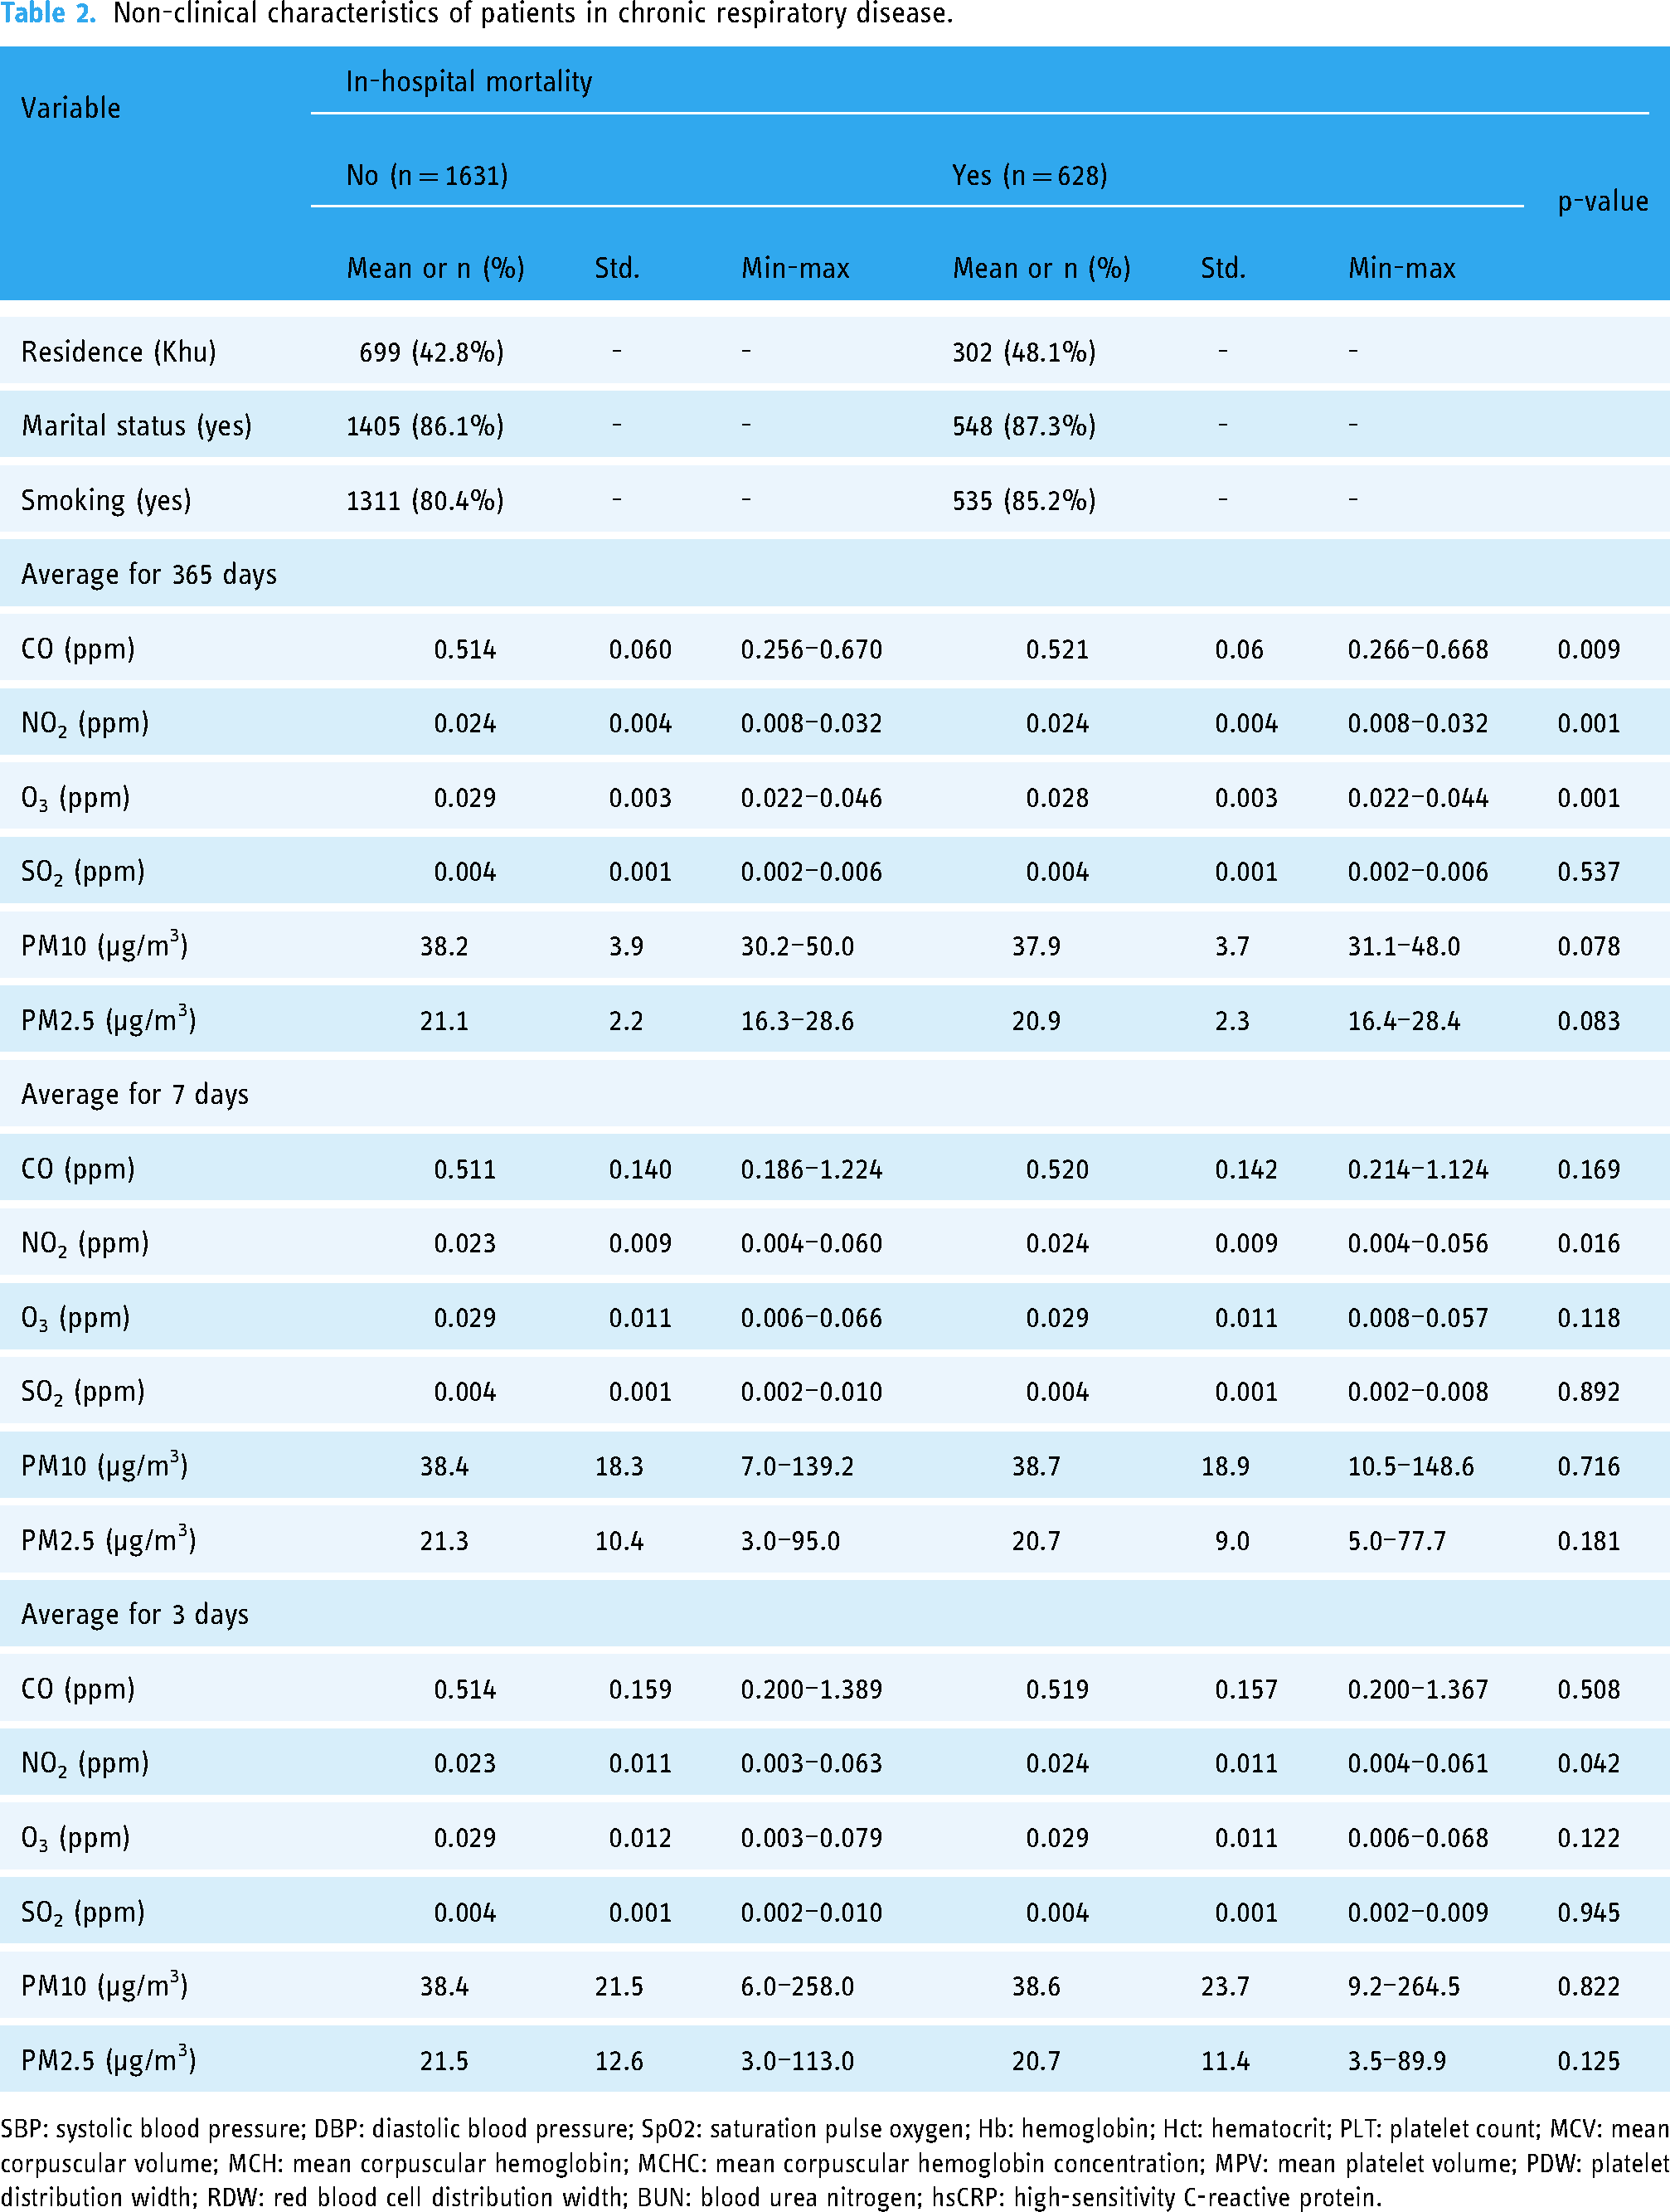
SBP: systolic blood pressure; DBP: diastolic blood pressure; SpO2: saturation pulse oxygen; Hb: hemoglobin; Hct: hematocrit; PLT: platelet count; MCV: mean corpuscular volume; MCH: mean corpuscular hemoglobin; MCHC: mean corpuscular hemoglobin concentration; MPV: mean platelet volume; PDW: platelet distribution width; RDW: red blood cell distribution width; BUN: blood urea nitrogen; hsCRP: high-sensitivity C-reactive protein.
The performance of each model was validated using a separately constructed test dataset. The performance of the LR, SVM, RF, and XGB models was evaluated in terms of sensitivity, specificity, accuracy, and AUC. Sensitivity, specificity, accuracy, and AUC were calculated using a confusion matrix, and the AUC was derived from the receiver operating characteristic curve based on the confusion matrix, presenting the area under the curve. 39 The results are presented in Table 3 and Figure 2. Comparing the performance of each model, XGB demonstrated a higher AUC than the other models, with a statistically significant difference compared to LR (p = 0.044).

Comparison of ROC curves about prediction models.
Result of performance of all models.

LR: logistic regression; SVM: support vector machine; RF: random forest; XGB: extreme gradient boost.
All independent variables were quantitatively evaluated for their impact on mortality prediction using permutation importance. 36 Figure 3 shows the top 10 variables by average importance calculated for the LR, SVM, RF, and XGB models. Figure 4 displays the important variables of all the models and their respective SHAP values, illustrating the correlation between each variable and the prediction outcomes. Based on the analysis of the average importance and model-specific SHAP values, BUN, albumin, RDW, respiratory rate, lymphocyte count, age, diastolic blood pressure (DBP), and SpO2 emerged as common risk factors. BUN, RDW, respiratory rate, and age positively correlated with mortality prediction, whereas albumin levels, lymphocyte counts, DBP, and SpO2 negatively correlated with mortality prediction.

Top 10 prediction factors based on average permutation importance across models, R: respiratory rate per min.

SHAP value based on feature importance for each prediction model, (a) LR, (b) SVM, (c) RF, (d) XGB, R: respiratory rate per min; P: pulse rate per min. LR: logistic regression; SVM: support vector machine; RF: random forest; XGB: extreme gradient boost; SHAP: Shapley additive explanations.
Discussion
This study proposes a machine learning-based model to predict in-hospital mortality due to the exacerbation of symptoms in patients with chronic respiratory disease using demographic, clinical, and environmental characteristics. Predictions were made using the LR, SVM, RF, and XGB models, and the predictive performance was evaluated using sensitivity, specificity, accuracy, and AUC. The XGB model demonstrated superior performance compared with the other models.
The key variables influencing mortality prediction included BUN, RDW, respiratory rate, age, albumin level, lymphocyte count, DBP, and SpO2. BUN, RDW, respiratory rate, and age were positively correlated with mortality prediction (Figure 4), consistent with previous studies.9,22,23,26,27 High BUN levels are strongly associated with mortality from various diseases and have been identified as a major risk factor for exacerbation and in-hospital mortality in COPD. 26 The critical BUN threshold directly contributing to COPD patient mortality is 7.30–7.63 mmol/L (approximately 131.40–137.34 mg/dL),26,27 and the maximum value of the expired group in this study exceeded this threshold. High RDW has been suggested as a risk factor for respiratory, cardiovascular, and hematological conditions.22,23 Previous studies have shown that an increase in the RDW is highly correlated with acute mortality in patients with COPD in the stable phase. 22 The normal range for RDW is 11.8–14.3% 23 ; the control group in this study had an average RDW of 13.4%, whereas the expired group had an average RDW of 15.6%. Typical clinical symptoms of COPD include tachypnea, tachycardia, and low oxygen saturation, 16 and the expired group in this study showed statistically significant differences in respiratory rate, pulse rate, and SpO2 compared to the control group (p < 0.001). These factors contributed significantly to the performance of the predictive model, as shown in Figures 3 and 4.
Variables negatively correlated with mortality prediction included SpO2, serum albumin, lymphocytes, and DBP, consistent with previous studies.15,19,28,29,40,41 Serum albumin is a negative acute-phase reactant and a representative clinical indicator of malnutrition. 28 Malnutrition is a common comorbidity in patients with COPD that leads to lower serum albumin levels.28,29 The expired group had a significantly lower average serum albumin level than the control group (p < 0.001). Hematological indicators such as lymphocytes, monocytes, and eosinophils are closely related to lung function.19,40 Among these, a decrease in lymphocyte count is highly correlated with the exacerbation of COPD symptoms. 19 The average lymphocyte counts in the control and expired groups were 22.8% and 10.1%, respectively, with a statistically significant difference (p < 0.001). Blood pressure was measured as SBP and DBP, with normal ranges of 80–140 mmHg and 60–90 mmHg, respectively.15,41 Both blood pressures showed a U-shaped relationship with mortality from all diseases, indicating that mortality risk increases when blood pressure deviates from the normal range. 15 Previous studies have shown that low DBP is closely associated with in-hospital mortality in patients. 41 In this study, the average DBP was 74.9 mmHg, while that of the expired group was 67.6 mmHg, which falls within the normal range; however, the difference between the two groups was statistically significant (p < 0.001).
As with the variables mentioned earlier, demographic and clinical variables have been used in previous studies to develop models predicting the prognosis of chronic respiratory diseases.8–10 Goto et al. used approximately 45 demographic and clinical variables, focusing on medical history, comorbidities, and chief complaints. 8 Patients were divided into critical care and hospitalization groups for prediction, with GBM showing a C-statistic of 0.80 and critical care and RF showing a C-statistic of 0.83 for hospitalization. 8 Shiroshita et al. compared the BAP-65 and CURB-65 models with machine learning models and applied variables such as age, consciousness level, pulse rate, respiratory rate, SBP, DBP, and BUN required by BAP-65 and CURB-65 to machine learning. 9 The XGB model performed best with an AUC of 0.71. 9 Zein et al. used 56 demographic and clinical variables, including medication history and drug type. 10 Of the LR, RF, and LightGBM models, LightGBM showed the best performance, with an AUC of 0.85. 10 Unlike previous studies, the clinical variables in this study were limited to CBC and general chemistry tests (serum). The CBC is the primary test most commonly requested by clinicians in all clinical settings, offering simplicity, low cost, and feasibility for all medical facilities. 42 To perform a CBC test, blood is drawn from the patient and stored in an SST tube, which allows serum tests to be conducted. 42 Thus, most inpatients undergo CBC and serum tests; the results are recorded in the EMR. The clinical variables in this study were extracted from EMR-based CBC and serum test results. In contrast, demographic variables were collected from EMR-based patient information during initial nursing assessments upon admission.
Furthermore, this study includes environmental characteristics, specifically air pollution exposure levels, as variables in the prediction model. Previous studies have shown that long-term exposure to air pollution is associated with various systemic diseases, such as cardiovascular, respiratory, and neurological diseases, 43 with a particularly high correlation with the onset of bronchial disease.12,13 Short-term exposure to air pollution has been identified as a risk factor affecting 30-day readmission rates, regardless of the disease type. 14 Long-term exposure levels in previous studies were defined as annual averages based on the admission date. 43 In contrast, short-term exposure levels were defined as the 7-day average based on the admission date. 14 This study used the annual, 7-day, and 3-day averages based on the admission date to examine the correlation with the prediction results for each period. Long-term exposure was a more significant factor than short-term exposure in predicting in-hospital mortality in patients with chronic respiratory disease (Figure 4). Among the air pollution indicators, long-term exposure to CO, NO2, and O3 showed statistically significant differences between the control and expired groups (p < 0.01), with CO and NO2 positively correlated with mortality prediction (Figure 4). These results align with those of previous studies, emphasizing the importance of air pollution exposure levels.12–14,43 In conclusion, this study confirmed that the environmental characteristics of patients are important for early assessment of chronic respiratory disease prognosis.
This study has several strengths. Developing an in-hospital mortality prediction model that reflects the environmental characteristics of patients with chronic respiratory diseases is important. It utilizes all air pollution indicators, highlighting the risks of long-term exposure to CO and NO2, and distinguishes itself from previous studies that did not use environmental characteristics.8–10 It also has the advantage of generalizability, covering a broader set of diseases than previous studies and performing well in predicting mortality in several chronic respiratory diseases, including COPD, asthma, and bronchiectasis. Second, the proposed model is applicable in various clinical settings. It is based on patient data recorded in the EMR, including demographic, clinical, and environmental characteristics as well as air pollution exposure levels obtained from publicly available online climate data. Additionally, clinical characteristics were based on primary test items conducted in all medical institutions. The methodological characteristics of this study ensure the practical utility of the predictive model. Finally, the proposed model uses mathematical methods to present the relationships between the predictive variables. The influence and directionality of each variable were quantitatively indicated using the permutation importance and SHAP values. This is significant because it interprets machine learning models that learn by considering complex interactions among independent variables in an explainable manner.
Nevertheless, this study has some limitations. First, the dataset used was insufficiently large. The dataset is highly unbalanced, with only an expired group size of 628 in the test data, which is relatively small compared with previous studies. 8 Second, as this study was designed as a retrospective chart review study, it could not assess the severity of patients’ conditions at the time of admission. Third, the model training used patient data from a specific region of South Korea. This implies that the predictive model reflects regional characteristics. Last, an external institution dataset was not constructed separately for model validation. The dataset from a single institution was split into training and test data, possibly leading to overestimating the test data prediction results. Future large-scale prospective studies should be designed to collect sufficient data, including patient severity, from various regional medical institutions to address these limitations.
Conclusion
The method proposed in this study predicted in-hospital mortality in patients with chronic respiratory diseases using demographic, clinical, and environmental characteristics. If this predictive model is introduced into clinical practice, it could enable early assessment of patient prognosis based on characteristics collected at admission, classifying patients into high- and low-risk groups. This is expected to assist healthcare professionals in clinical decision-making, enabling timely treatment and reducing the socioeconomic costs associated with chronic respiratory diseases.
Supplemental Material
Supplemental material
Supplemental material
Footnotes
Acknowledgements
This work was supported by the Gachon University research fund of 2023(GCU-202308020001). This work was supported by the GRRC program of Gyeonggi Province. [GRRC-Gachon2023(B01), Development of AI-based medical imaging technology]. This work was supported by the Technology Innovation Program(or Industrial Strategic Technology Development Program(K_G012001185601, Building Data Sets for Artificial Intelligence Learning) funded By the Ministry of Trade Industry & Energy(MOTIE, Korea).
Author contributions
Seung Yeob Ryu and Seon Min Lee contributed equally to this work. Seung Yeob Ryu and Seon Min Lee are the co-first (lead) authors.
Declaration of conflicting interests
The authors declared no potential conflicts of interest with respect to the research, authorship, and/or publication of this article.
Funding
The authors disclosed receipt of the following financial support for the research, authorship, and/or publication of this article: This work was supported by the Ministry of Trade Industry & Energy(MOTIE, Korea), GRRC program of Gyeonggi Province, (grant number K_G012001185601, GRRC-Gachon2023(B01)).
Supplemental material
Supplemental material for this article is available online.
Patient consent statement
This study was approved by the IRB as a retrospective medical records dataset collection study, and patient consent was not required.
References
Supplementary Material
Please find the following supplemental material available below.
For Open Access articles published under a Creative Commons License, all supplemental material carries the same license as the article it is associated with.
For non-Open Access articles published, all supplemental material carries a non-exclusive license, and permission requests for re-use of supplemental material or any part of supplemental material shall be sent directly to the copyright owner as specified in the copyright notice associated with the article.