
Abstract
Objectives
Although radiologists typically rely on imaging characteristics of pulmonary nodules for preoperative evaluation, the inherent subjectivity of this approach often leads to high misdiagnosis rates. This study comparatively analyzed the diagnostic value of non-contrast-enhanced computed tomography (NCECT) and contrast-enhanced computed tomography (CECT) in differentiating benign and malignant pulmonary nodules using multi-regional radiomics and machine learning algorithms.
Methods
This retrospective collection included 194 patients who underwent NCECT and CECT scans. Radiomics features were extracted by identifying the intra-nodular and peri-nodular 5 mm area as the region of interest. Six different machine learning classifiers were used to select the most effective classifier to create a predictive model. The efficacy of the models was measured by the area under the curve, further analysis of the combined model was conducted through calibration curves and decision Curve Analysis curves. Additionally, 78 patients were collected as an external validation cohort.
Results
The logistic regression classifier showed the best stability. In the single-region analysis, the model developed based on features extracted from the intra-nodular regions of interest in contrast-enhanced CT scans yielded a significantly higher AUC value compared to the other three single-region models. The combined regions of non-contrast CT achieved an AUC of 0.901, similar to the contrast-enhanced CT combined regions. Furthermore, the NCECT model achieved an AUC of 0.863 in external validation, further confirming its robustness.
Conclusions
The multiple regional features model of intra-nodular and peri-nodular outperformed single-region models in differentiating malignant from benign nodules. Furthermore, the combined model of NCECT demonstrated comparable efficacy to CECT.
Introduction
Data published by the National Cancer Center of China indicates that lung cancer is expected to be the primary cause of cancer-related deaths among both genders within the nation.1,2 The high mortality rate associated with lung cancer is primarily attributable to the late detection of malignant lesions. Consequently, early diagnosis and timely intervention become paramount for mortality reduction. Conventional CT imaging uncovers morphological characteristics that significantly aid radiologists in clinical settings. These characteristics, including nodule diameter, position, lobulation, margin irregularity, calcification, pleural indentation, vacuolation, and vascular infiltration, are instrumental in classifying nodule types and evaluating the malignant potential of lesions.3,4 Nonetheless, reliance on morphological features alone often leads radiologists to erroneous diagnoses, potentially resulting in the overtreatment of benign patients and an uptick in false-negative malignancy diagnoses. 5 Therefore, accurately determining the nature of pulmonary nodules before surgery is of crucial significance to avoid unnecessary invasive procedures.
With the continuous advancement of medical imaging technology and computer technology, the limitations of traditional methods in quantitatively assessing tumor heterogeneity, as well as the deep integration of medicine with other disciplines, have driven the development of radiomics. The concept of radiomics was first proposed by the Dutch scholar Professor Philippe Lambin in 2012 and has been supplemented and expanded by subsequent researchers. 6 Radiomics combines quantitative imaging analysis, machine learning, and computer vision techniques, utilizing advanced image processing technologies to extract a large number of imaging features from medical images, providing new perspectives for disease diagnosis, treatment response assessment, and prognosis prediction. Numerous studies have already demonstrated the potential application value of radiomics in assessing the malignancy of pulmonary nodules, lung cancer risk stratification, personalized treatment, and overall prognosis prediction.7–11
Contrast-enhanced CT (CECT) is often used as the only diagnostic confirmation technique for preoperative staging of pulmonary nodules in China, 12 it can replace the expensive PET/CT as an equivalent diagnostic technique.13,14 Non-contrast enhanced CT (NCECT) can provide adequate density assessment without contrast agent administration, making it a viable first-line imaging option for patients with contrast allergies. Furthermore, NCECT offers greater cost-effectiveness, thereby enhancing its suitability for broader implementation in lung cancer screening programs. In patients undergoing treatment, it is routinely employed for follow-up imaging, facilitating precise comparison with preoperative baseline scans and enabling objective assessment of treatment response. Previous studies have shown that the microenvironment of the tumor periphery contains important prognostic information, such as the degree of vascular invasion and the distribution of lymphocytes within the tumor tissue.15–19 Additionally, distinct regions of the tumor periphery vary significantly in their prognostic significance.20,21 A retrospective analysis of radiological features of intra-nodular and peri-nodular pulmonary nodules using NCECT, aiming to differentiate adenocarcinoma from granuloma, found that the area extending 5 mm from the nodule's boundary showed the most significant discriminative ability in differentiating these two types of lesions. 22 Therefore, in this study, we chose the region extending 5 mm outward from the edge of the lesion as the region of interest (ROI) around the pulmonary nodule.
In this study, we outlined intra-nodular and peri-nodular ROI of pulmonary nodules and constructed radiomics models based on NCECT and CECT, respectively. The study aimed to discriminate malignant from pulmonary nodules and to compare the differences in diagnostic performance between the two CT techniques.
Materials and methods
Ethics
This retrospective study was approved by the Research Ethics Committee of the local hospital (Approved No. of Ethics Committee: 2024–26). Owing to the retrospective nature of the study, informed consent was waived by the Research Ethics Committee, and all clinical data were anonymized during analysis to maintain patient privacy.
Patient cohort
Retrospectively collected patients who underwent both non-contrast-enhanced CT and contrast-enhanced CT examinations between January 2020 and September 2023. The time interval between the two CT scans for each patient did not exceed one month, and the gap between the final CT scan and histopathological biopsy was no longer than two weeks. Clinical data and CT imaging details for all participants were retrieved from an electronic medical records database and a picture archiving and communication system (PACS). Eligibility criteria included (1) 18 years of age or older, (2) CECT and NCECT images, (3) definitive pathologic diagnosis by surgical or puncture biopsy, and (4) lung nodule size between 3 mm and 30 mm. Exclusions included (1) no images or poor image quality, (2) nodule size greater than 30 mm, and (3) unavailability of a pathology report. As a result of the rigorous screening described above, the total number of patients who met the inclusion and exclusion criteria for the study was initially determined to be 569, including 485 patients with malignant lesions and 84 patients with benign lesions. Due to the significant difference in the amount of data between the two groups of subjects, this study used propensity matching, with benign and malignant patients matched in a 1:2 ratio based on sex and age. 23 A total of 194 participants were ultimately included in the study, comprising 124 with malignant cases and 70 with benign cases. This resulted in a benign-to-malignant ratio of 1:1.77, approaching our target matching ratio of 1:2. The detailed criteria are shown in Figure 1. Patients were randomized in a 7:3 ratio into a training set (n = 135) and a testing set (n = 59).

The flowchart of inclusion and exclusion criteria of participants.
CT imaging and region of interest segmentation
Prior to their respective surgical interventions, each patient received a chest CT scan, either unenhanced or with contrast enhancement, approximately 14 days in advance. The CT equipment we used includes: Aquilion ONE TSX-305A, Siemens Force, and Toshiba 320-row. The operational settings for all scanners were as follows: tube voltage ranging from 100–150 kV, automatic tube current, and the injection of 65–75 mL of contrast agent at a flow rate of 3.5–4.5 mL/s. The detailed CT protocols used in this study were described in S1 Table.
Two radiologists, each boasting at least five years of experience, examined the images of all patients through the PACS system, documenting the subjective characteristics of the lesions, including: (1) the nodule size, determined by averaging the maximum horizontal length and the vertical diameter measured axially. 24 (2) location_1 (left/right); (3) location_2 (upper/middle/lower); (4) lobulation (yes/no); (5) spiculated sign (yes/no); (6) calcification (yes/no); (7) Pleural invasion (yes/no). For each participant, clinical information was also recorded, including gender, age, smoking history, and prevalence of diabetes and hypertension.
A radiologist used the segmentation software (Deep-wise Multimodal Research Platform, version V 2.5.1) to semi-automatically segment the ROI in the lung window (width: 1500 HU; level: −500 HU), and a second radiologist reviewed the segmented images to ensure consistency and accuracy. The bin width was set to 25. The periphery of the lesion was extended outward by 5 mm to define the peri-nodular ROI. The bronchi, major blood vessels, and surrounding pleura were manually removed to eliminate interference (Figures 2, 3 and S1 Figure).

Delineation of regions of interest for benign and malignant pulmonary nodules on non-contrast-enhanced CT images a. A 68-year-old male patient with a benign lung nodule, presenting a subsolid nodule in the right lower lung lobe. b. A 72-year-old male patient with a malignant lung nodule, presenting a subsolid nodule in the right lower lung lobe with a cavity and irregular, spiculated margins. The three rows of images respectively represent the original images, the region of interest inside the nodule, and the region of interest around the nodule at the initial, maximum, and disappearing slices of both benign and malignant pulmonary nodules.

Delineation of regions of interest for benign and malignant pulmonary nodules on contrast-enhanced CT images a. A 62-year-old female patient with a benign pulmonary nodule, presenting an irregular-shaped solid nodule shadow in the lower lobe of the left lung, with shallow lobulation visible at the edges; b. A 65-year-old male patient with a malignant pulmonary nodule, presenting an irregular-shaped solid nodule shadow in the middle lobe of the right lung, with shallow lobulation visible at the edges.
Radiomic feature extraction
Before the extraction of features, each image was subjected to resampling at a 1mm × 1mm × 1 mm resolution and underwent z-score normalization. The lesion's 3D characteristics were automatically extracted by using the Deepwise Platform, whose feature extraction engine is based on the Python PyRadiomics package. 25 This ensured that all feature definitions and calculations are standardized according to the IBSI guidelines. The extracted features included the shape, Grey Level Co-occurrence Matrix (GLCM), Grey Level Dependence Matrix (GLDM), Grey Level Run Length Matrix (GLRLM), Grey Level Size Zone Matrix (GLSZM), and Neighbourhood Grey Tone Difference Matrix (NGTDM). Feature extraction involved the application of wavelet transform, squaring, square root, logarithmic transformation, exponential function, gradient analysis, three-dimensional Local Binary Pattern (LBP3D), and logarithmic operations. All features were named based on the three-level naming method, and each level was concatenated with “_”. The first level denoted the image preprocessing method and associated parameters, the second level specified the feature type, and the third level provided the statistical description. 26
Radiomic feature selection
Firstly, all constant values were eliminated. Characteristics were screened by the Mann-Whitney U test (retaining features with p-values < 0.05). The significance level was further adjusted using Bonferroni correction to control the family-wise error rate, where the corrected threshold was set to p < 0.05/N and N is the total number of features tested. 27 The multiple minimum relevance maximum relevance (mRMR) algorithm was used to select the subset of features that were most relevant to the results while minimizing the correlation between them. Finally, the least absolute shrinkage and selection operator (LASSO) method with 5-fold cross-validation was used to identify the best subset of features across intra-nodular, peri-nodular, and their combined subregions for subsequent modeling.
Model construction and evaluation
In this study, six different machine learning classifiers, including support vector machine (SVM), Naive Bayes (NB), logistic regression (LR), quadratic discriminant analysis (QDA), random forest (RF), and k-nearest neighbors (KNN), were used to construct prediction models based on four independent radiomic feature sets (intra-nodular and peri-nodular regions from NCECT and CECT, respectively) and two composite radiomic feature sets (combined intra-nodular and peri-nodular features for NCECT and CECT), and hyperparameter tuning was performed for all classifiers using grid search with 5-fold cross-validation on the training set, aiming to maximize AUC. The optimal hyperparameters were then applied to train the final models, which were evaluated on the independent testing set. Calibration curves and decision curve analysis (DCA) were used to assess the performance of the multi-regional NCECT model and the multi-regional CECT model, and to calculate continuous and categorical net reclassification improvement (NRI) and integrated discrimination improvement (IDI) metrics.
Statistical analysis
Continuous variables with normal distribution (assessed using Shapiro-Wilk tests, p > 0.05) were compared by t-test and expressed as mean ± standard deviation (SD). Non-normally distributed continuous variables were analyzed using the Mann-Whitney U test and reported as median (interquartile range). Statistical analysis was performed using R software (version 4.2.2). P < 0.05 was considered statistically significant.
Results
Patients cohort
The study encompassed 194 patients who satisfied the analysis criteria. 104 were females (53.6%) and 90 were males (46.4%). Solid nodules were identified in 71 patients (36%) and subsolid nodules in 123 patients (64%). The nodules were predominantly found in the right lung (61.8%) and the upper lobes (56.7%). The patient population included 51 smokers (26.3%) and 143 non-smokers (73.7%). The average age of the training and validation cohorts was 58.6 (±7.9) years and 57.8 (±9.9) years, respectively, and the mean nodule diameter was 12.2 mm (±5.4) and 13.3 mm (±5.6), respectively. Demographic, clinical, and morphologic characteristics of the training and validation cohorts are detailed in Table 1. The baseline characteristics of the patients did not significantly differ between the training and testing set.
Clinical and CT characteristics of patients.

Qualitative data (categorical variables) are described as n (%). Quantitative data (continuous variables) are described as mean ± SD.
Selected features of single and combined ROIs
A total of 4308 radiomic features were extracted from each lesion, comprising 2154 features from the nodule interior region and 2154 features from the nodule peripheral region. Initially, feature screening was performed using the Mann-Whitney U test with Bonferroni correction, retaining 2016 intra-nodular, 2096 peri-nodular, and 4076 combined features for non-contrast enhanced CT, and 2043 intra-nodular, 2068 peri-nodular, and 4082 combined features for contrast enhanced CT. The mRMR method was used to perform further screening, which involved retaining 10 features in each of the four individual regions and 20 combined features in each of the two combined feature regions. Ultimately, the LASSO algorithm was employed to determine the final feature set for modeling. 9 features (2 first-order features; 3 glcm features; 2 gldm features; 1 glszm feature; 1 glrlm feature) retained in the intranodal region, 9 features (5 first-order features; 1 glcm feature; 1 gldm feature; 1 glszm feature; 1 glrlm features), and 14 combined features were preserved (7 first-order features; 2 glcm features; 2 gldm features; 1 glszm feature; 2 glrlm features) for NCECT(Figure 4); 9 features were preserved in the nodule (2 first-order features; 5 glcm features; 1 gldm feature; 1 glrlm feature), and 10 features were preserved in the perinodal area (4 first-order features; 3 glcm features; 2 gldm features; 1 glszm feature), and 18 combined features were retained (7 first-order features; 7 glcm features; 1 gldm feature; 1 glszm feature; 1 glrlm feature; 1 ngtdm) for CECT. S2 Table shows the features of four individual regions. S3 Table shows the features of the two combined regions. The distribution of types and numbers of NCECT and CECT radiomics features is shown in S2 Figure.
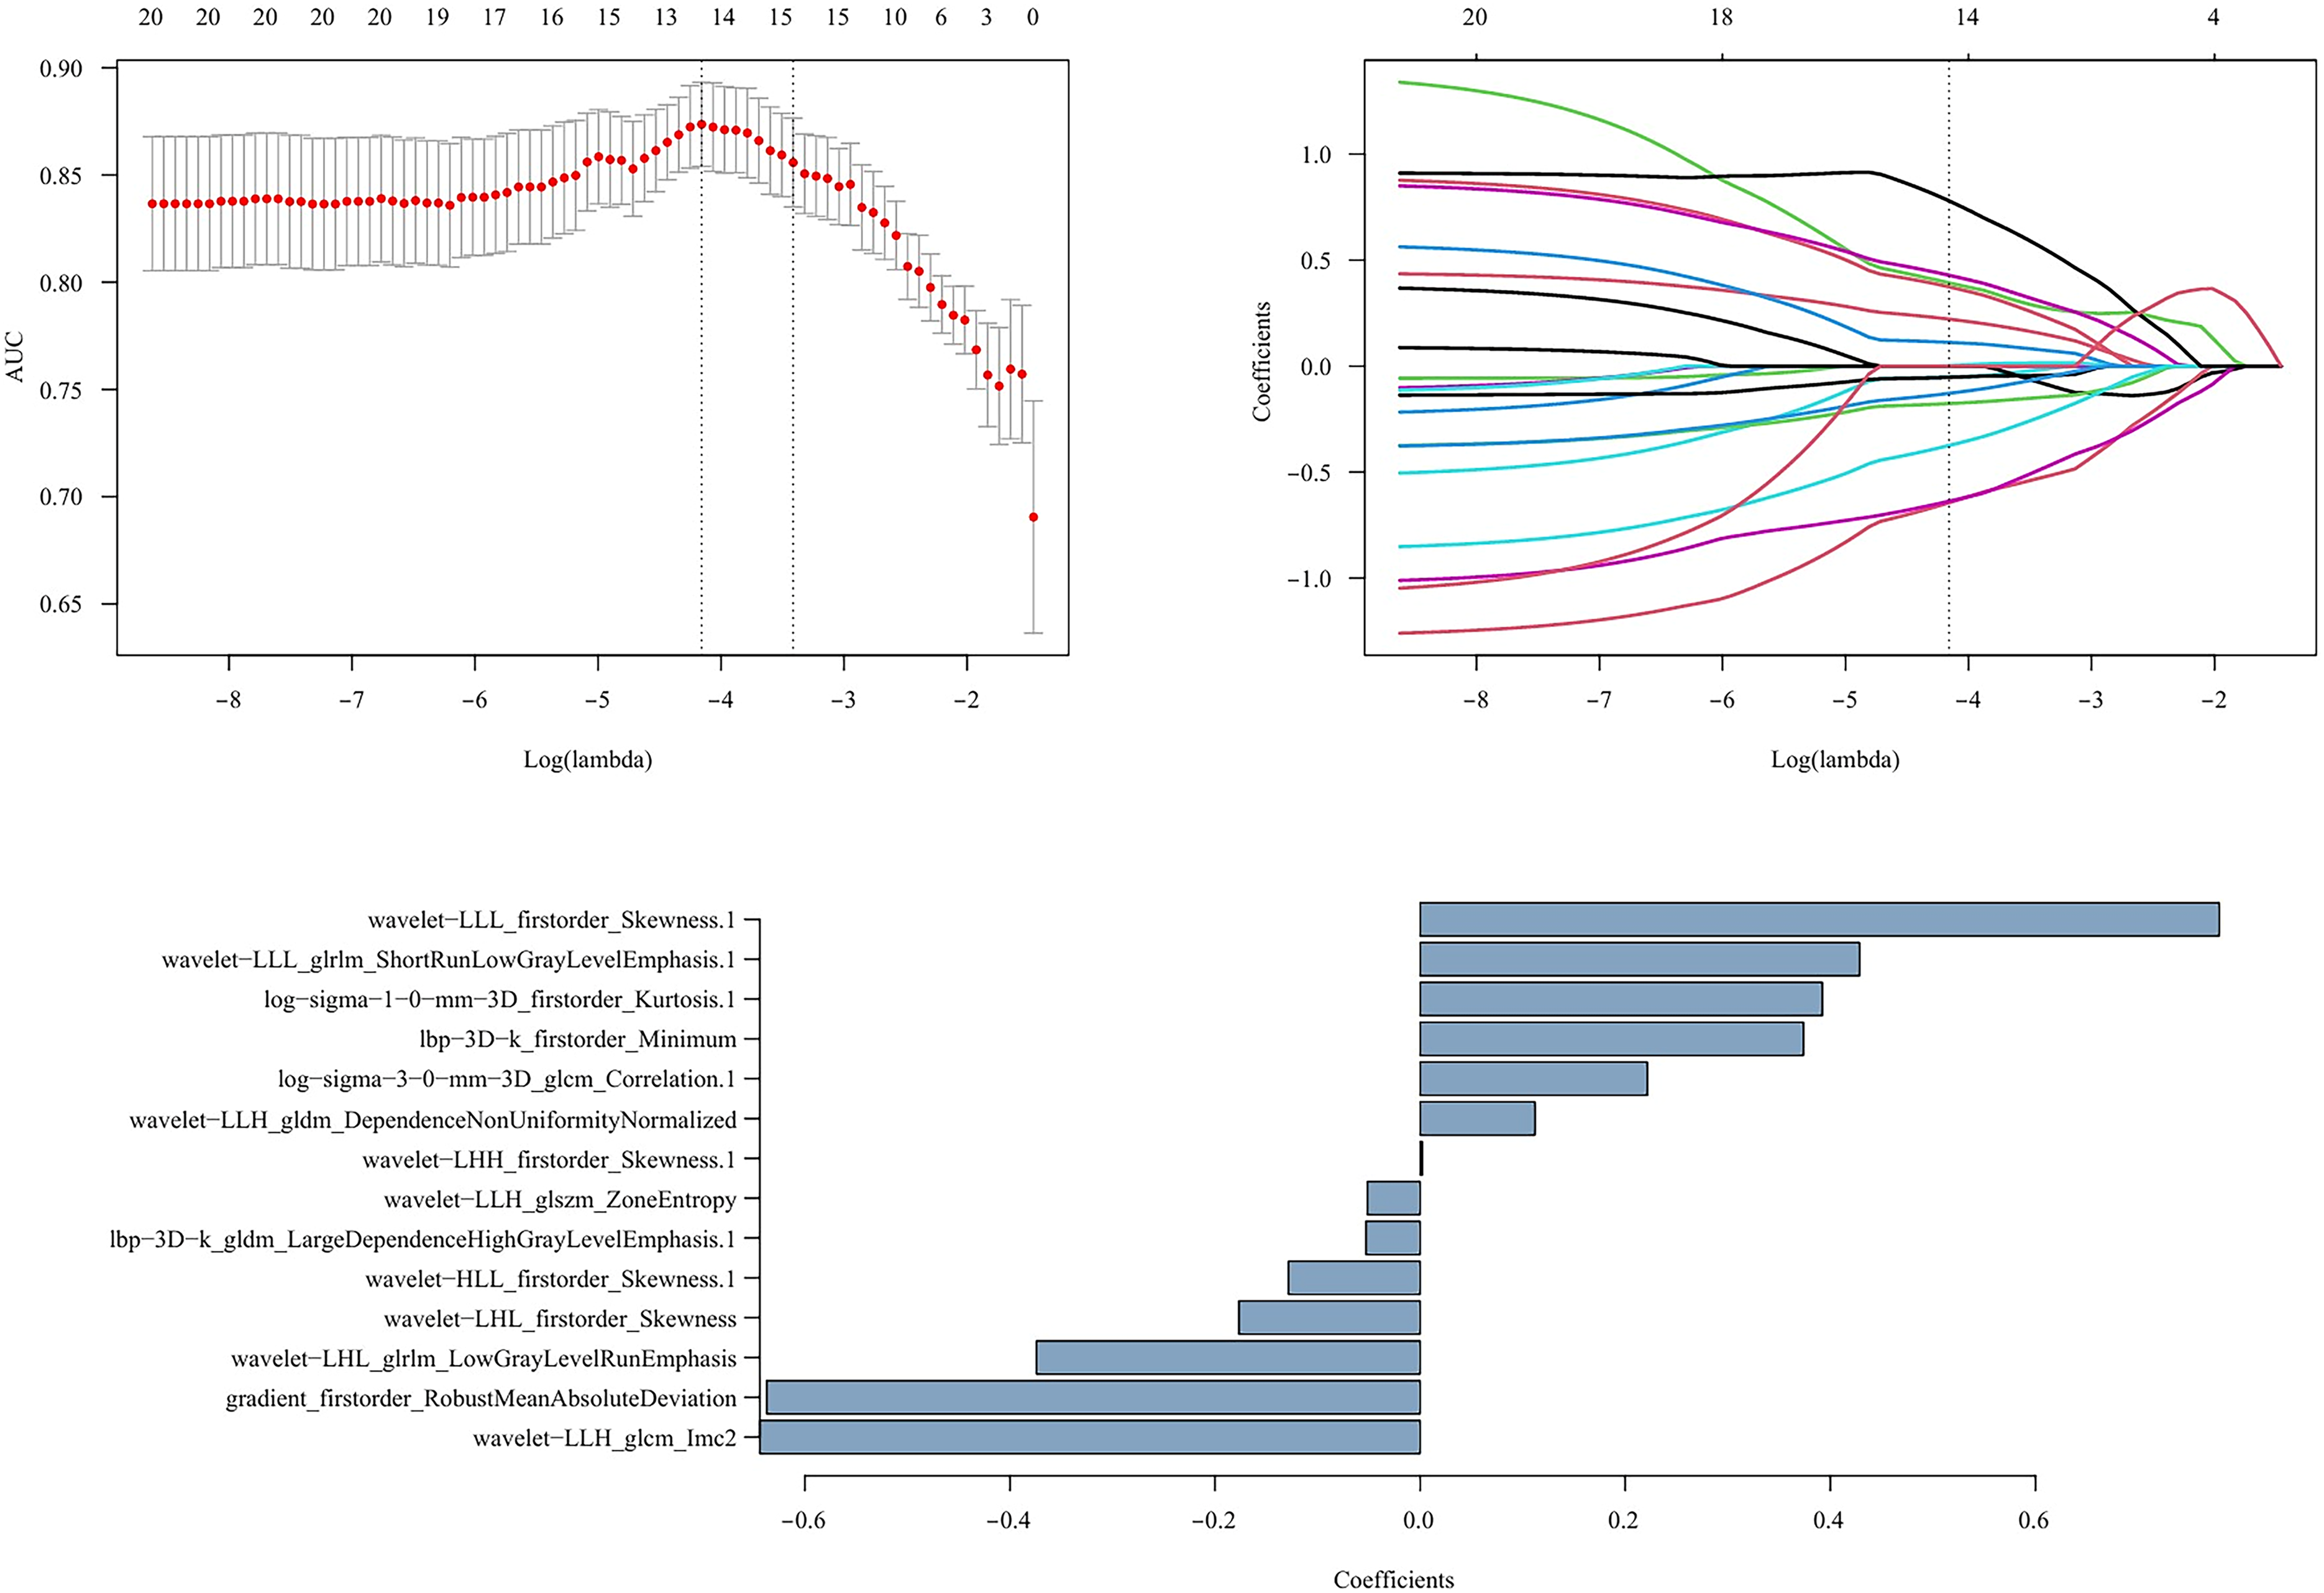
NCECT combined radiomics features determined by the lasso algorithm.
Performance of single and combined models
The AUC values of each model in the training set and the testing set are shown in S4 Table and S5 Table, respectively. LR model showed optimal performance among all classifiers. Figure 5 presents the ROC curves of logistic regression models based on features from different regions. In the testing dataset, the AUC values for the non-contrast-enhanced intranodal (NCE-T), non-contrast-enhanced perinodal (NCE-P), contrast-enhanced intranodal (CE-T) and contrast-enhanced perinodal (CE-P) were 0.83 (95% CI: 0.708, 0.952), 0.797 (95% CI: 0.677, 0.917), 0.897 (95% CI: 0.812, 0.983) and 0.827 (95% CI: 0.72, 0.935), respectively.

The average ROC curves in the training and testing cohorts represent the discriminatory ability of six feature sets from different tumor regions. a. Logistic regression model for the training set; b. Logistic regression model for the testing group. NCE-T: Non-contrast-enhanced CT intranodal model; NCE-P: Non-contrast-enhanced CT perinodal model; NCE-C: Non-contrast-enhanced CT combined model; CE-T: Contrast-enhanced CT intranodal model; CE-P: Contrast-enhanced CT perinodal model; CE-C: Contrast-enhanced CT combined model.
Specifically, in terms of individual feature regions, the CE-T model demonstrated the most outstanding AUC value; the AUC value of the CE-T model was 0.067 higher than that of the NCE-T model, and the AUC value of the CE-P model was 0.030 higher than that of the NCE-P model. Moreover, the AUC values of models constructed based on intra-nodular features were consistently higher than those of models built based on peri-nodular features. Among all feature regions, the multi-region feature model performed the best, and the performance of the CE-C and NCE-C models was similar, with AUC values in the training group and testing group being 0.928 (95% CI: 0.884, 0.956) and 0.947 (95% CI: 0.912, 0.981) for the CE-C model, and 0.901 (95% CI: 0.816, 0.986) and 0.901 (95% CI: 0.820, 0.982) for the NCE-C model, respectively, indicating that the CE-C model did not provide additional diagnostic value. Table 2 provides a detailed and comprehensive assessment of the accuracy, sensitivity, specificity, positive predictive value, and negative predictive value of the models established by logistic regression.
The predictive performance of the logistic regression model on the training cohort and testing cohort.

NCE-T: Non-contrast-enhanced CT intranodal model; NCE-P: Non-contrast-enhanced CT perinodal model; NCE-C: Non-contrast-enhanced CT combined model; CE-T: Contrast-enhanced CT intranodal model; CE-P: Contrast-enhanced CT perinodal model; CE-C: Contrast-enhanced CT combined model.
The diagnostic performance of the multi-region combination model
Figure 6 shows the calibration curves for the NCE-C and CE-C models. The Brier score is a commonly used metric to assess the accuracy of probabilistic predictions. The Brier scores for the two models on the training set were 10.0% and 9.0%, respectively, indicating that the average deviation between the predicted probabilities and the actual outcomes for the models were 10% and 9%.

The calibration curves for the NCE-C and CE-C models. a, b, c, and d show the comparison of predicted probabilities and actual outcomes for the non-contrast-enhanced CT combined model and the contrast-enhanced CT combined model on the training set and testing set, respectively. The horizontal axis of each graph represents predicted risk, and the vertical axis represents observed frequency.
Figure 7 depicts the clinical decision analysis curves for the NCE-C and CE-C models. Overall, both the NCE-C and CE-C models demonstrated higher net benefits in the medium threshold probability range, superior to the “treat all” and “treat none” strategies. However, the NCE-C model showed slightly better performance than the CE-C model at certain thresholds. This suggests that at these specific thresholds, the non-contrast-enhanced CT model may provide better decision support. In addition, we also evaluated the NRI and IDI for both models. The results are shown in Table 3. The NRI quantifies the proportion of patients correctly reclassified into higher or lower risk categories by the new model (CE-C) compared to the reference model (NCE-C). The IDI measures the average increase in predicted probability for malignant nodules minus the increase for benign nodules, reflecting overall discriminative improvement. An IDI of 0.0754 suggests a trend toward enhanced separation of malignant from benign nodules, however, this improvement did not reach statistical significance.
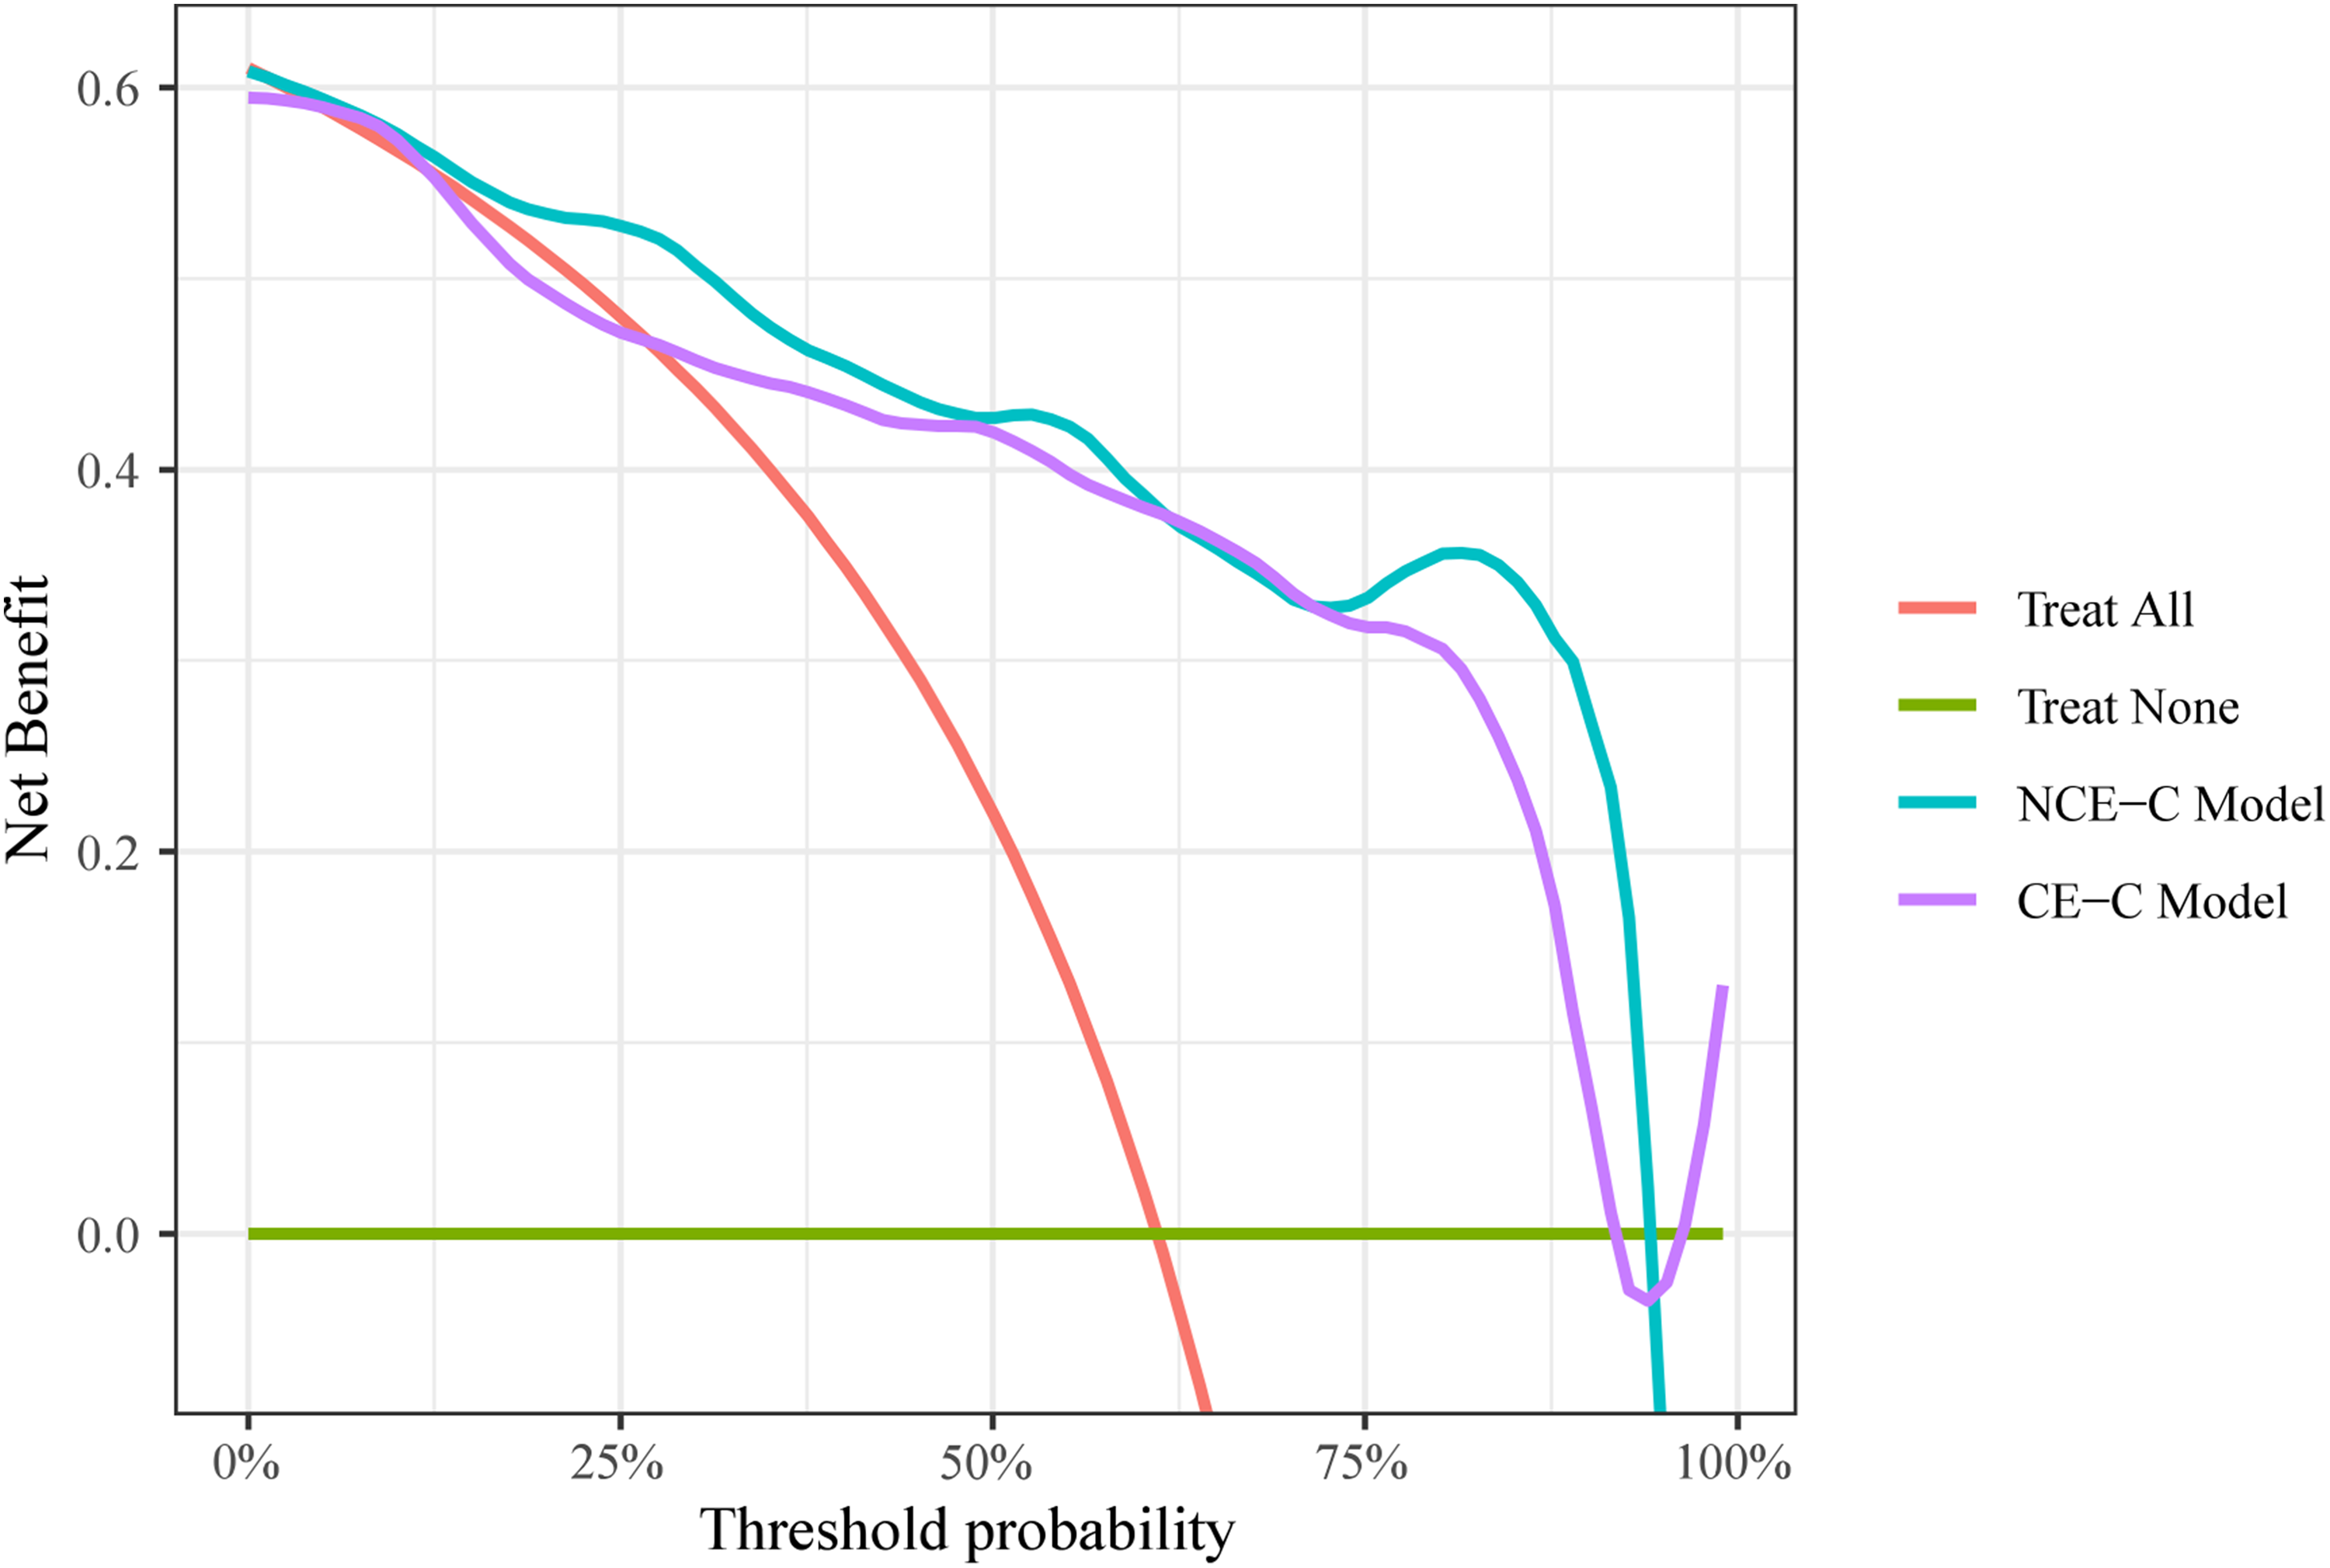
Decision curves analysis for the NCE-C model and the CE-C model.
IDI and NRI for the comparison of NCE-C model and CE-C model.

Continuous NRI: continuous net reclassification improvement;
Categorical NRI: categorical net reclassification improvement;
IDI: integrated discrimination improvement.
External verification cohort
To further assess the generalizability of our non-contrast-enhanced CT (NCECT) radiomics model, external validation was performed using cases from the LUNA16 dataset and The Cancer Imaging Archive (TCIA).28,29 A total of 78 eligible patients were selected, constituting an independent external validation cohort. The ROC curve and calibration curve of the NCECT model on this external cohort are presented in Figure 8 and Figure 9, respectively. The results indicate that the model maintains favorable discriminatory ability and calibration in an independent population, supporting its robustness and potential for broader clinical application.
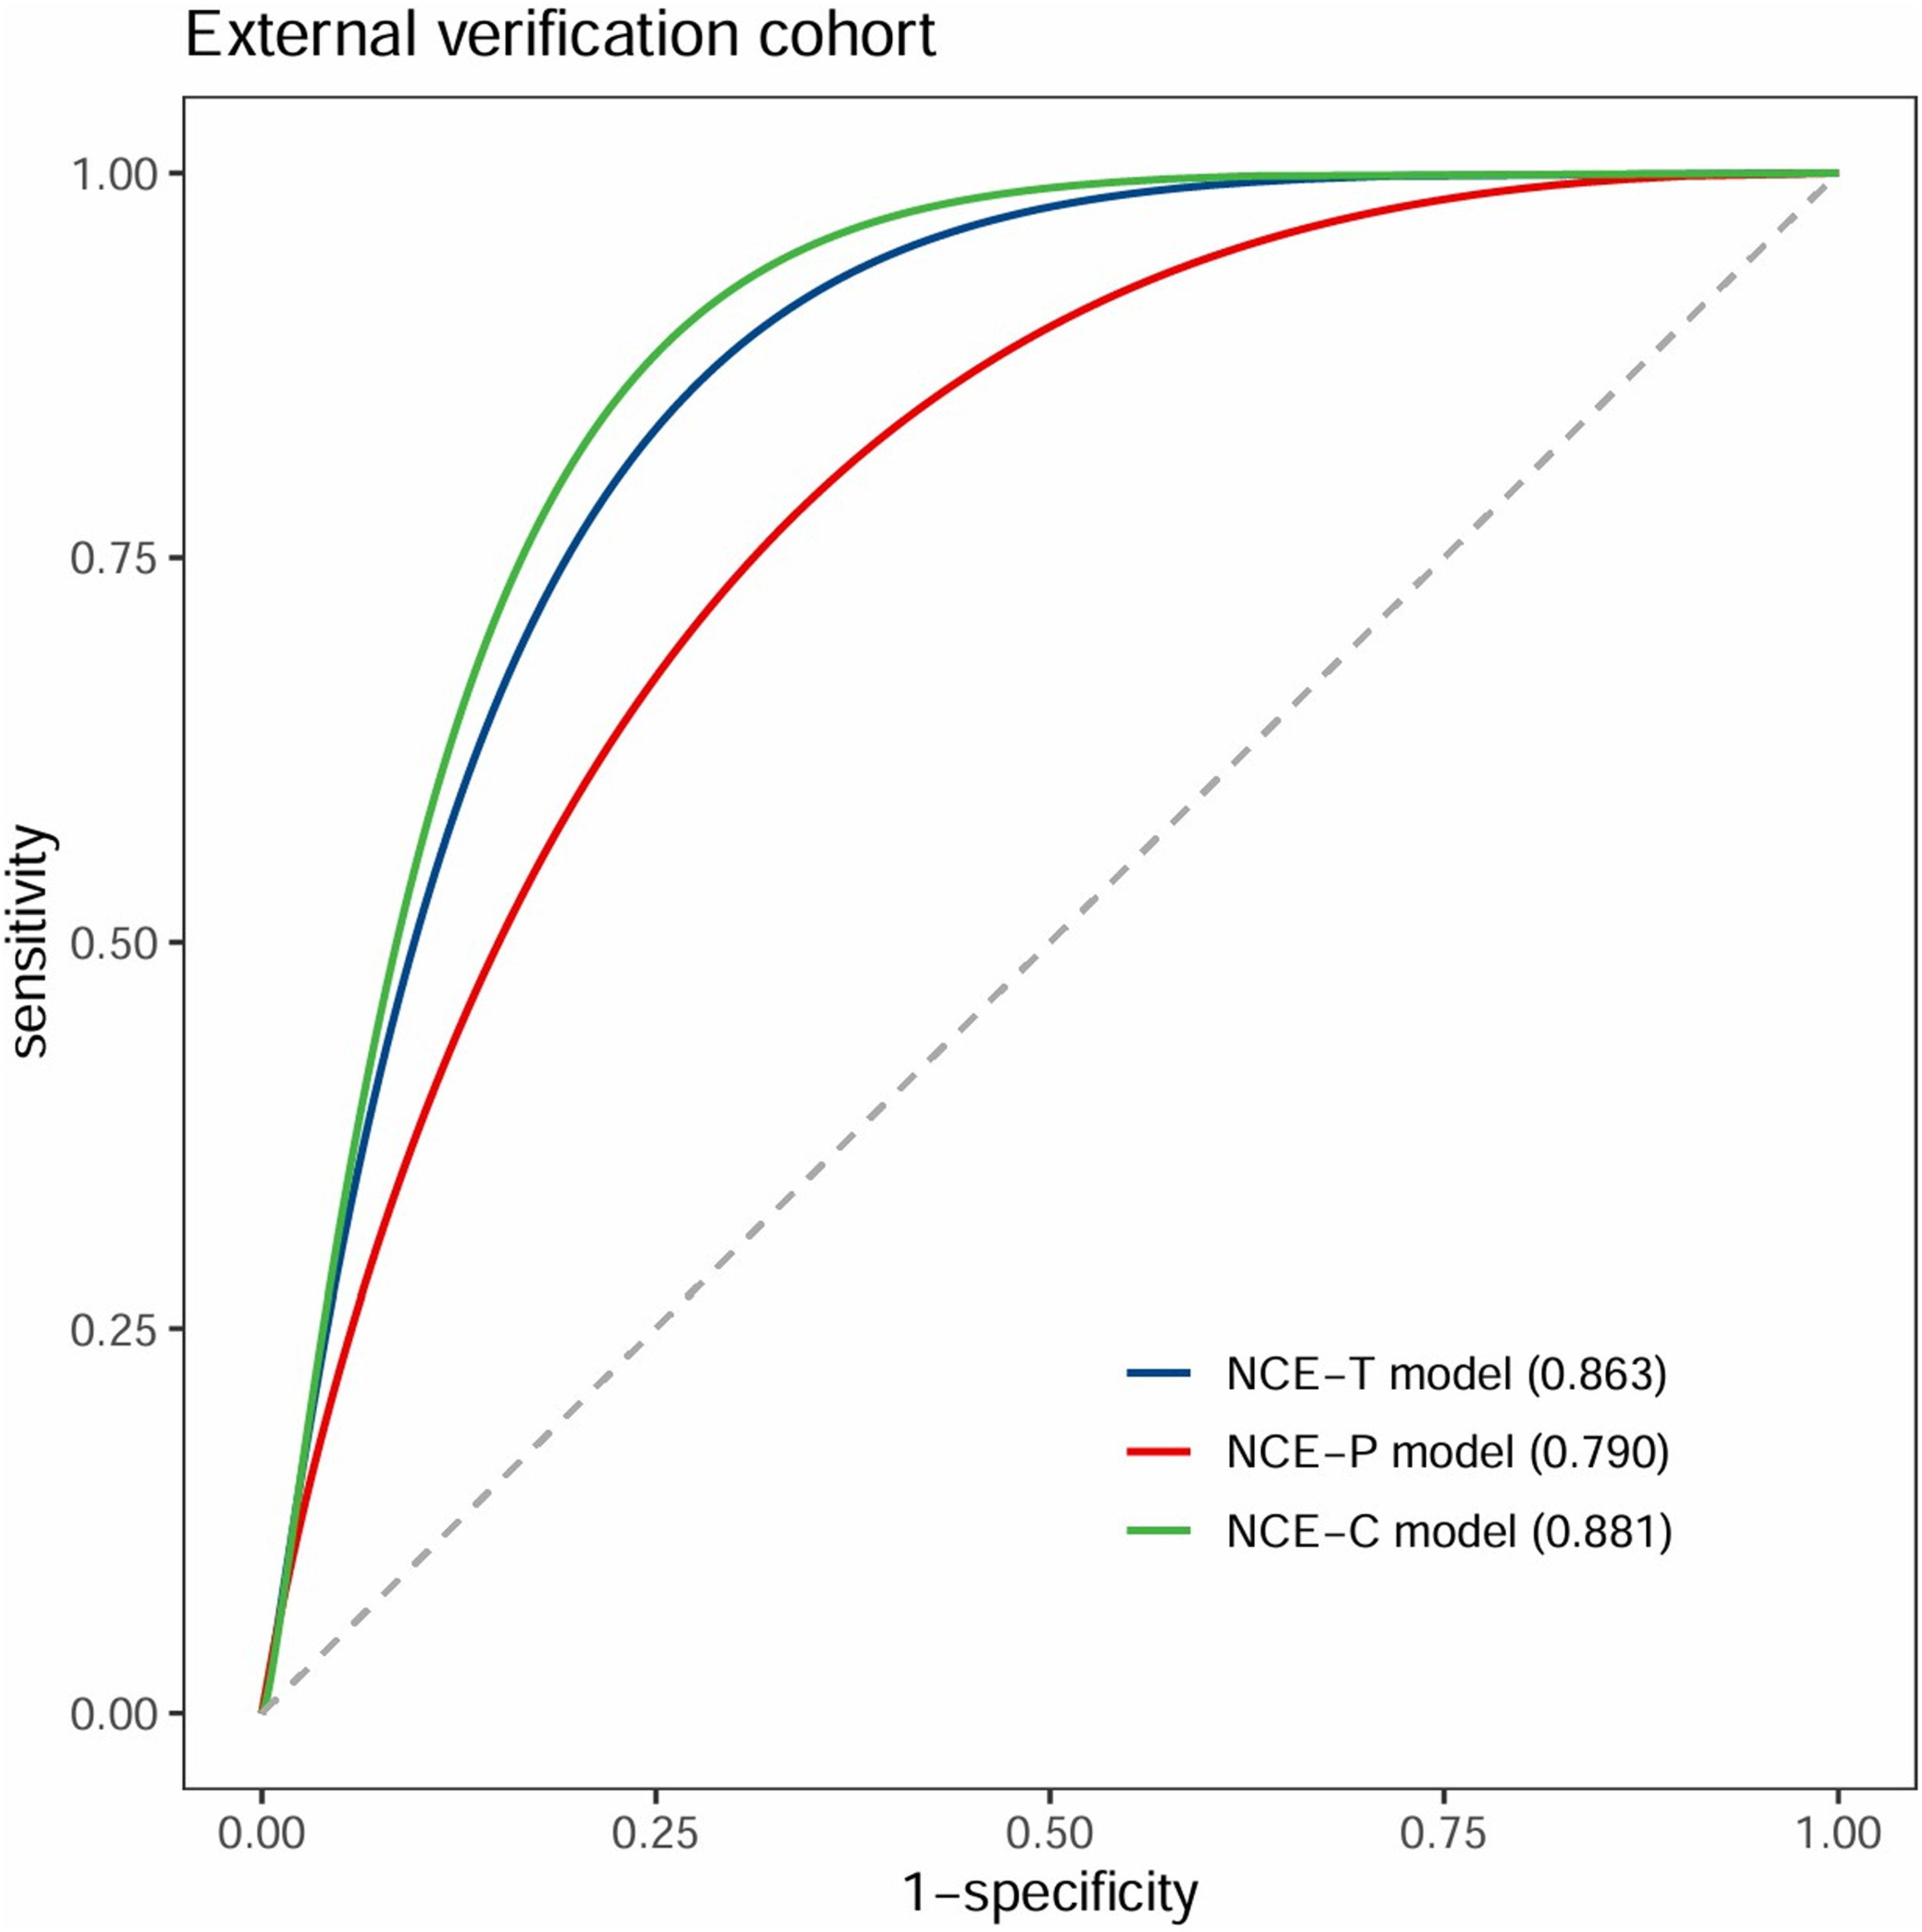
ROC curves of NCECT model in the external validation cohort.

Calibration curve of NCECT model in the external validation cohort.
Discussion
This study evaluated the value of radiomics features extracted from intra-nodular, peri-nodular single regions, and combined regions based on NCECT and CECT images in the differential diagnosis of benign and malignant pulmonary nodules. The results showed that the model constructed using a logistic regression classifier performed the best in determining the nature of the nodules. In the test set of single-region studies, the diagnostic efficiency of the CE-T model was superior to that of NCE-T, NCE-P, and CE-P, and the AUC values of the models based on intra-nodular regions were higher than those based on peri-nodular regions. Additionally, the AUC values of the combined regions in both contrast-enhanced CT and non-contrast-enhanced CT surpassed those of the single regions. The diagnostic efficiency of the non-contrast-enhanced combined region was equivalent to that of the contrast-enhanced CT, demonstrating its potential clinical application value. Furthermore, the NCECT model achieved an AUC of 0.863 in external validation, further confirming its robustness. For clinical translation, an output probability threshold of 0.54 from the NCE-C model is proposed, whereby nodules scoring above this value are considered high-risk and may warrant invasive diagnostic procedures, while those below could be managed conservatively, given the model's high specificity of 95.7%.
In the study focusing on single-region models, we observed that CECT demonstrated higher AUC than NCECT, indicating superior accuracy in characterizing intra- and peri-nodular features. This advantage is likely attributable to enhanced depiction of vascular and tissue microstructures via contrast agent injection, which provides richer diagnostic information in CT imaging. Yang et al. 30 demonstrated superior predictive performance of CE-CT over NCECT for EGFR mutation status in non-small cell lung cancer using radiomics approaches. Chen et al. 31 demonstrated that CECT radiomics features provide incremental value over NCECT for preoperative invasiveness prediction in subcentimeter lung adenocarcinomas. Regardless of imaging technique, peri-nodular radiomics models underperformed intra-nodular models in diagnostic efficacy. This may be due to the fact that the intra-nodular region is the core area of heterogeneity, containing more features related to the nature of the nodule, while the peri-nodular region is relatively complex and may be influenced by surrounding normal tissue, making feature extraction more challenging. Similarly, Wu et al. 32 demonstrated that peri-nodular radiomics features did not significantly improve diagnostic models for malignancy in solid pulmonary nodules measuring less than 2 cm.
Our analysis of contrast-enhanced CT and non-contrast-enhanced CT revealed that multi-regional features combining intra- and peri-nodular data yielded substantially higher AUC than single-region models. This reflects comprehensive characterization of both nodular properties and their interactions with adjacent tissues, providing richer diagnostic information for improved efficiency. Similarly, Calheiros et al. 33 found that combining peri- and intra-nodular radiomics features from a large public dataset improved accuracy, sensitivity, and specificity compared to analyzing intra-nodular features alone. Wang et al. 34 applied a radiomics model using intra-tumoral (GTV) and peritumoral (PTV) CT images to predict preoperative lymph node metastasis in clinical T1 stage peripheral lung adenocarcinoma, finding that feature fusion from both regions increased the model's AUC. These studies confirmed the significant importance of combined features in enhancing model performance, therefore, future research should comprehensively consider the information of the nodule and its surrounding tissues.
It is noteworthy that this study is the first to compare the performance of non-contrast-enhanced CT (NCECT) and contrast-enhanced CT (CECT) in constructing combined models that integrate features within and around the nodule. The results demonstrate that the combined regional NCECT model is comparable to the CECT model in AUC value. Decision curve analysis indicates that the net benefit of the NCE-C model equals or surpasses that of the CE-C model across all thresholds. This phenomenon may stem from the efficient utilization of multi-dimensional features in the combined regional analysis of NCECT, despite NCECT lacking the tissue enhancement provided by contrast agents. Furthermore, the optimization and weighting of features within the combined model are also key factors. By appropriately weighting features, the effective information in NCECT is better integrated, further boosting model performance. This finding provides new insights for clinical diagnosis, aiding in the precise selection of more appropriate imaging modalities for patients.
Feature selection revealed that Gray-Level Co-occurrence Matrix (GLCM) features played a dominant role within the pulmonary nodule regions. GLCM captures spatial relationships between voxels, effectively describing image texture. Tumor growth patterns and cellular distribution within a nodule create unique textures that GLCM features can effectively identify. Contrast-enhanced CT has more GLCM features compared to non-contrast-enhanced CT, demonstrating its superiority in capturing texture and contrast. 7 First-order features primarily play a crucial role in the peri-nodular regions. This is likely because they analyze the image's gray-level histogram, directly reflecting the surrounding tissue's gray-level distribution. These features focus on the intensity distribution of image voxels, revealing the nodule's contrast with adjacent normal tissue, boundary clarity, and morphological characteristics. GLSZM features are richer in non-contrast CT, while NGTDM features are observed only in contrast-enhanced CT. In summary, the full implementation of these features could provide clinicians with a more precise diagnostic tool, optimizing treatment plans for patients.
This study is subject to several limitations. Initially, this study involved only hospitalized patients, who may be subject to selection bias, and the applicability of its findings to the general screening population requires further validation. Furthermore, the mean nodule diameter of 12.2 ± 5.4 mm suggests that the study population had a relatively high baseline risk of malignancy, which may limit the generalizability of the model to lower-risk groups. Future studies should focus on prospective data collection and external validation in more representative populations to further evaluate the clinical applicability of the model. Second, the analysis was limited to intravenous phase images of enhanced CT scans, and future studies could improve the radiomics analysis by including multiphase images. 35 Third, to balance the group sizes, we employed propensity score matching. While this improved comparability, the inherent selection bias may compromise the generalizability of our findings. Future studies could explore alternative methods, such as multivariable regression adjustment or inverse probability weighting, to control for key confounders while maximizing sample size retention, thereby enhancing the clinical applicability and external validity of the results. Finally, the use of semi-automated methods to delineate the region of interest improves labeling accuracy but reduces efficiency. Future studies should consider fully automated techniques to speed up data processing and reduce variability to improve the efficiency and consistency of results.
Conclusion
Compared with single-region feature models, combining features from within and around pulmonary nodules enhances diagnostic accuracy for distinguishing benign from malignant nodules. The diagnostic performance of non-contrast-enhanced CT (NCECT) with combined regions is similar to that of contrast-enhanced CT (CECT), indicating that CECT may not offer additional diagnostic benefits, highlighting the value and potential of NCECT with combined regions in lung nodule differentiation.
Supplemental Material
sj-pdf-1-dhj-10.1177_20552076261420278 - Supplemental material for Multimodal CT radiomics combined with machine learning algorithms to differentiate benign from malignant pulmonary nodules
Supplemental material, sj-pdf-1-dhj-10.1177_20552076261420278 for Multimodal CT radiomics combined with machine learning algorithms to differentiate benign from malignant pulmonary nodules by Ling Liu, Jiaheng Xu, Yang Ji, Tiancai Yan, Hong Pan, Shuting Wang, Zhenzhou Shi, Yuxin Li, Chunxiao Wang and Tong Zhang in DIGITAL HEALTH
Footnotes
Abbreviations
Acknowledgments
Thank Dr Siyun Liu from the Department of Pharmaceutical Diagnostics, GE Healthcare, Beijing, China, for her help in the statistical analysis of this article.
Ethical considerations
This retrospective study was approved by the Research Ethics Committee of the fourth affiliated hospital of Harbin Medical University (Approved No. of Ethics Committee: 2024–26).Owing to the retrospective nature of the study, informed consent was waived by the Research Ethics Committee of the fourth affiliated hospital of Harbin Medical University, and all clinical data were anonymized during analysis to maintain patient privacy.
Consent to participate
Given the retrospective nature of the study, the requirement for written informed consent was waived.
Consent for publication
Not applicable
Author contributions
(I) Conception and design: Ling Liu, Tong Zhang; (II) Administrative support: Tong Zhang; (III) Provision of study materials or patients: Tong Zhang; (IV) Collection and assembly of data: Ling Liu, Jiaheng Xu, Yang Ji, Tiancai Yan; Chunxiao Wang(V) Data analysis and interpretation: Hong Pan, Shuting Wang, Zhenzhou Shi, Yuxin Li; (VI) Manuscript writing: Ling Liu, Tong Zhang; (VII) Final approval of manuscript: All authors
Funding
The authors disclosed receipt of the following financial support for the research, authorship, and/or publication of this article: This work was supported by the National Natural Science Foundation of China, (grant number No.62376078).
Declaration of conflicting interests
The authors declared no potential conflicts of interest with respect to the research, authorship, and/or publication of this article.
Data availability
Supplemental material
Supplemental material for this article is available online.
References
Supplementary Material
Please find the following supplemental material available below.
For Open Access articles published under a Creative Commons License, all supplemental material carries the same license as the article it is associated with.
For non-Open Access articles published, all supplemental material carries a non-exclusive license, and permission requests for re-use of supplemental material or any part of supplemental material shall be sent directly to the copyright owner as specified in the copyright notice associated with the article.