
Abstract
Background
Differentiating between benign and malignant breast masses is critical for clinical decision-making. Automated breast volume scanning (ABVS) provides high-resolution three-dimensional imaging, addressing the limitations of conventional ultrasound. However, the impact of peritumoral region size on predictive performance has not been systematically studied. This study aims to optimize diagnostic performance by integrating radiomics features and clinical data using multiple machine-learning models.
Methods
This retrospective study included ABVS images and clinical data from 250 patients with breast masses. Radiomics features were extracted from both intratumoral and peritumoral regions (5, 10, and 20 mm). These features, combined with clinical data, were used to develop models based on four algorithms: Support vector machine, random forest, extreme gradient boosting, and light gradient boosting machine (LGBM). Model performance was evaluated using area under the receiver operating characteristic curve (AUC), calibration curves, and decision curves, with SHapley Additive exPlanations (SHAP) analysis employed for interpretability.
Results
The inclusion of peritumoral features improved the diagnostic performance to varying degrees, with the model incorporating a 10 mm peritumoral region achieving the highest overall accuracy. Combining radiomics with clinical features further enhanced predictive performance. The LGBM model outperformed the other algorithms across subgroups, achieving a maximum AUC of 0.909, an accuracy of 0.878, and an F1-score of 0.971. SHAP analysis revealed the contribution of key features, improving model interpretability.
Conclusion
This study demonstrates the value of integrating radiomics and clinical features for breast mass diagnosis, with optimized peritumoral regions enhancing model performance. The LGBM model emerged as the preferred algorithm due to its superior performance. These findings provide strong support for the clinical application of ABVS imaging and future multicenter studies, highlighting the importance of microenvironmental features in diagnosis.
Background
Breast cancer is the most common malignancy among women worldwide, with approximately 2.26 million new cases reported in 2020, surpassing lung cancer to become the leading cancer type globally.1–3 Given the high metastatic risk and poor prognosis associated with breast cancer, early diagnosis of breast lesions is essential to improving patient outcomes. Therefore, non-invasive and accurate preoperative differentiation between benign and malignant breast lesions is a critical aspect of clinical decision-making. 4
Ultrasound imaging, with its efficiency, low cost, and radiation-free nature, is widely used for the detection of breast lesions. However, conventional ultrasound imaging has inherent limitations, such as dependence on operator experience and a lack of standardization, which can hinder consistent and reliable assessment of tumor characteristics. Automated breast volume scanning (ABVS) overcomes some of these challenges by providing three-dimensional (3D) reconstructed images of the breast, offering high-resolution, standardized multiplanar views, making it more suitable for radiomics analysis.5,6 Nevertheless, ABVS has its shortcomings, particularly in capturing peritumoral information that could provide crucial insights into the tumor microenvironment.
In recent years, the rapid advancement of artificial intelligence (AI) and radiomics has opened new avenues for the early diagnosis and precise treatment of breast cancer.7–9 Radiomics extracts high-dimensional quantitative features from medical images, enabling the evaluation of tumor heterogeneity and complexity beyond human visual perception.10–12 Machine-learning models such as support vector machine (SVM), random forest (RF), extreme gradient boosting (XGBoost) and light gradient boosting machine (LGBM) have demonstrated significant potential in various diagnostic applications, including breast cancer classification. Integrating radiomics features with these models can provide valuable non-invasive biomarkers to support clinical decision-making.
Despite the progress made in AI-based radiomics techniques for breast cancer diagnosis, most studies have focused solely on intratumoral features while neglecting the significance of peritumoral regions. The peritumoral area contains stromal cells and reflects interactions such as cytokine release, edema, and angiogenesis, all of which play critical roles in tumor progression and invasion. 13 Including peritumoral features in analysis can enhance the predictive power of radiomics models. Some scholars conducted radiomics research on 233 breast lesions in 190 patients based on contrast-enhanced spectral mammography images, extracted features from the intratumoral and 1, 3, and 5 mm peritumoral regions, and constructed 7 radiomics models. The results demonstrated that the model combining the intratumoral and 3 mm peritumoral regions of interest (ROIs) achieved the highest area under the receiver operating characteristic curve (AUC) of 0.940, suggesting that peritumoral radiomics analysis is helpful for early diagnosis of breast cancer. 14 There were also studies that extracted texture features in the intratumoral and 3, 6, 9, 12, and 15 mm peritumoral regions based on DCE-MRI images of 209 patients. The results showed that the texture features obtained in the 9–12 mm peritumoral region have better discrimination ability for HER-2 positive breast cancer than the intratumoral and other ranges of peritumoral features. 15 However, no systematic studies have explored the optimal size of the peritumoral region in ABVS imaging for differentiating between benign and malignant breast lesions.
This study aims to assess the clinical value of machine-learning models in differentiating benign and malignant breast masses using radiomics features extracted from both intratumoral and peritumoral regions in ABVS images. Furthermore, we systematically compare different peritumoral region sizes to identify the optimal selection that enhances model performance. In addition, we employ SHapley Additive exPlanations (SHAP) 16 to reveal the contribution of individual features, thereby improving the interpretability of the developed models for clinical applications.
Methods
Patient enrollment
This study is a retrospective study that collected ABVS imaging data and related clinical data of 250 patients with breast lesions confirmed by surgery and pathology at Third Xiangya Hospital of Central South University from January 2021 to November 2023. All patients were divided into benign and malignant groups based on postoperative pathological results and randomly divided into a training set and a validation set in a 7:3 ratio.
The inclusion criteria are: (1) ABVS examination must be completed within 2 weeks before histological biopsy; (2) obtained biopsy or surgical pathology results; (3) preoperative ABVS images are clear and complete, and clinical data is complete; (4) breast lesions are all solid mass type lesions, which are convenient for image segmentation; (5) for patients with multifocal lesions, only the largest lesion with clear pathological results is selected for analysis. Exclusion criteria include: (1) poor ABVS image quality; (2) non mass breast lesions; (3) incomplete clinical data or lack of clear pathological results; (4) the patient has received neoadjuvant chemotherapy or radiotherapy.
The collected baseline characteristics include age, menopause status, family history of breast cancer and histological type for further analysis and model construction. All patient data has been anonymized and approved by the Ethics Committee of Third Xiangya Hospital of Central South University (Quick 23190), in compliance with the ethical requirements of the Helsinki Declaration. Due to the retrospective nature of the study, the requirement for informed consent was waived.
Image acquisition
This study used the Siemens Acuson S2000 ABVS ultrasound diagnostic instrument, equipped with a 14L5BV probe with a frequency range of 5.0–12.0 MHz. During the examination, patients were instructed to raise both arms above their head and maintain a supine position, and evenly apply a sufficient amount of coupling agent to the surface of the breast. To achieve optimal image quality, adjust parameters such as depth and overall gain before scanning. During the scanning process, patients need to maintain normal breathing to reduce artifact interference. Perform scans of both breasts in the midline, lateral, and medial positions, and if necessary, include scans in other non-standard directions. The maximum volume for each scan is 5.4 cm × 16.8 cm × 6.0 cm, followed by marking the nipple position and uploading the images to the data processing system for 3D reconstruction to obtain cross-sectional, sagittal, and coronal images. All ABVS images were blindly reviewed by two experienced ultrasound physicians with 10 years of experience, without prior knowledge of the patient's clinical and pathological information. The evaluation includes the location of the lesion (left or right, whether it is located in the upper inner quadrant), size (whether it is greater than 20 mm), blood flow (present or absent), calcification (present or absent), Breast Imaging Reporting and Data System (BI-RADS) score etc. It is combined with ultrasound elastography (using a 5-point elasticity score) to accurately classify the malignant risk of the lesion. If there is a disagreement in the evaluation results, the final diagnosis was determined through consultation with senior doctors.
Manual annotation
Due to the uneven growth of tumors, automatic segmentation may be difficult to achieve the accuracy of manual segmentation when the difference in grayscale values between the lesion area and the background is small. In this study, the ROI was determined by an ultrasound specialist with 10 years of experience in the field of ABVS. The ITK-SNAP software (version 3.8.0) 17 was used to manually delineate the ROI layer by layer, generating tumor masks stored in NII format. For breasts with multiple lumps, only the largest lump with clear pathological results is selected for analysis. Subsequently, all ROIs were reviewed and revised by another senior ultrasound specialist. In order to further analyze the peritumoral region, an image processing dilation algorithm, which is a morphological dilation technique based on a disk-shaped structuring element, was used to expand the intratumoral ROI by 5, 10, and 20 mm, respectively, to obtain different sizes of peritumoral regions. Therefore, four ROIs (intratumoral, intratumoral + 5 mm peritumoral, intratumoral + 10 mm peritumoral, intratumoral + 20 mm peritumoral) were identified from the ABVS images of each patient.
Radiomics feature extraction and selection
Radiomics feature extraction was performed using the Pyradiomics Python package, a comprehensive opensource platform that enables processing and extraction of radiomics features from medical imaging data using a large panel of engineered hard-coded feature algorithms. 18 High-dimensional quantitative radiomics features were extracted from each defined ROI, including first-order statistical features, shape features, texture features, and wavelet-based features. These features provided a comprehensive quantitative description of lesion morphology, density distribution, and texture complexity, reflecting the heterogeneity and microenvironmental changes within the intratumoral and peritumoral regions. After feature extraction, z-score standardization was applied to all features to eliminate bias from differences in feature scales. This method ensures that each feature is centered around zero with a standard deviation of one, making them comparable across features.
During feature selection, the intraclass correlation coefficient was first calculated to assess feature reproducibility, and only highly reproducible features were retained. Next, low-variance features were removed through variance filtering, and the least absolute shrinkage and selection operator (LASSO) regression method was employed to further refine the features. LASSO introduces a regularization term that effectively reduces model complexity, prevents overfitting, and improves model stability and interpretability. The final set of selected features was used for machine-learning model construction and validation.
Machine-learning model construction
After feature selection, the retained radiomics features were used to develop four different classification models: SVM, RF, XGBoost, and LGBM. These classifiers were chosen for their distinct characteristics, allowing for a comprehensive evaluation of model performance. SVM is known for its robustness and strong performance in high-dimensional feature spaces, making it suitable for complex nonlinear classification tasks. RF leverages multiple decision trees to provide high noise resistance and generalization ability. XGBoost is an efficient gradient boosting algorithm with fast computation and effective overfitting control. LGBM, an improved gradient boosting model, offers high computational efficiency, the ability to handle large-scale data, and a good balance between performance and resource consumption.19–22 By using these four algorithms, the study aims to compare the performance, robustness, and efficiency of these algorithms in predicting the malignancy of breast masses.
Statistical analysis
Descriptive statistics were first used to summarize the baseline characteristics of the patients. To assess the performance of each machine-learning model in distinguishing between benign and malignant breast lesions, a range of commonly used evaluation metrics were applied, including accuracy, recall, precision, F1 score, and the AUC. These metrics measured the overall performance of the models and their sensitivity to different types of errors. Five-fold cross-validation was used for model evaluation. In this approach, the dataset was divided into five equal parts, with four parts used for model training and the remaining part for validation in each iteration. This process was repeated five times, ensuring that each subset was used as a validation set once. This method enhances the robustness and reproducibility of the results by reducing the potential for overfitting and providing a more comprehensive evaluation of the model's performance across different data splits.
The experimental workflow was divided into two parts. The first part focused on the analysis of radiomics feature sets, further subdivided into intratumoral and peritumoral groups (intratumoral + 5 mm, intratumoral + 10 mm, intratumoral + 20 mm). By comparing the impact of different peritumoral regions on model performance, the optimal peritumoral region size was determined. The second part involved the combined analysis of radiomics and clinical features, constructing a radiomics + clinical feature model and comparing it with the radiomics-only model. This layered comparison evaluated whether the inclusion of clinical features could further enhance the diagnostic performance of the model, providing a more comprehensive reference for distinguishing between benign and malignant breast lesions.
Results
Patient enrollment and baseline data statistics
According to the enrollment flowchart shown in Figure 1, a total of 250 patients with breast masses were included in this study. These patients underwent ABVS examinations at the Third Xiangya Hospital of Central South University between January 2021 and November 2023. Of the initially collected 346 patients, 96 were excluded for not meeting the inclusion criteria: 16 cases were excluded due to poor image quality, 50 cases were non-mass lesions, and 30 cases were excluded due to incomplete clinical data or lack of definitive pathology results. In the end, 250 patients were included, with 125 having malignant masses and 125 having benign masses.

Patient enrollment process of this study.
The baseline characteristics of the patients are summarized in Table 1. The mean age of patients in the malignant group was 52.8 years (standard deviation 10.9), significantly higher than that in the benign group, which was 39.6 years (standard deviation 11.8) (p < 0.001). Benign masses were mostly located in the right breast (55.2%), while malignant masses were mainly located in the left breast (62.4%) (P = 0.005). However, there was no significant difference in the distribution of lesions in the upper inner quadrant of the breast between the two groups (P = 0.862). The mean diameter of malignant masses was significantly larger than that of benign masses (22.0 vs. 18.6 mm, P = 0.005). In addition, the proportion of malignant masses with a diameter ≥ 20 mm was higher than that of benign masses (54.4% vs. 37.6%, P = 0.008). In terms of vascular features, 82.4% of malignant masses exhibited blood flow signals, whereas only 39.2% of benign masses showed such signals (p < 0.001). Additionally, malignant masses were more frequently accompanied by calcification (45.6% vs. 13.6%, p < 0.001). Significant differences were observed in both elasticity scores and BI-RADS classifications between the two groups, with a higher proportion of malignant masses receiving high elasticity scores (4–5 points) and the majority being classified as BI-RADS 4b–5 (88.8%) compared to benign masses (p < 0.001). Menopausal status also varied significantly between the groups, with 44.8% of patients in the malignant group being postmenopausal, compared to only 10.4% in the benign group (p < 0.001). This study highlights significant differences between malignant and benign breast masses in terms of age, lesion size, blood flow signals, calcification, elasticity scores, menopausal status and BI-RADS category providing a solid foundation for the subsequent model development.
Clinical baseline data of the patients.
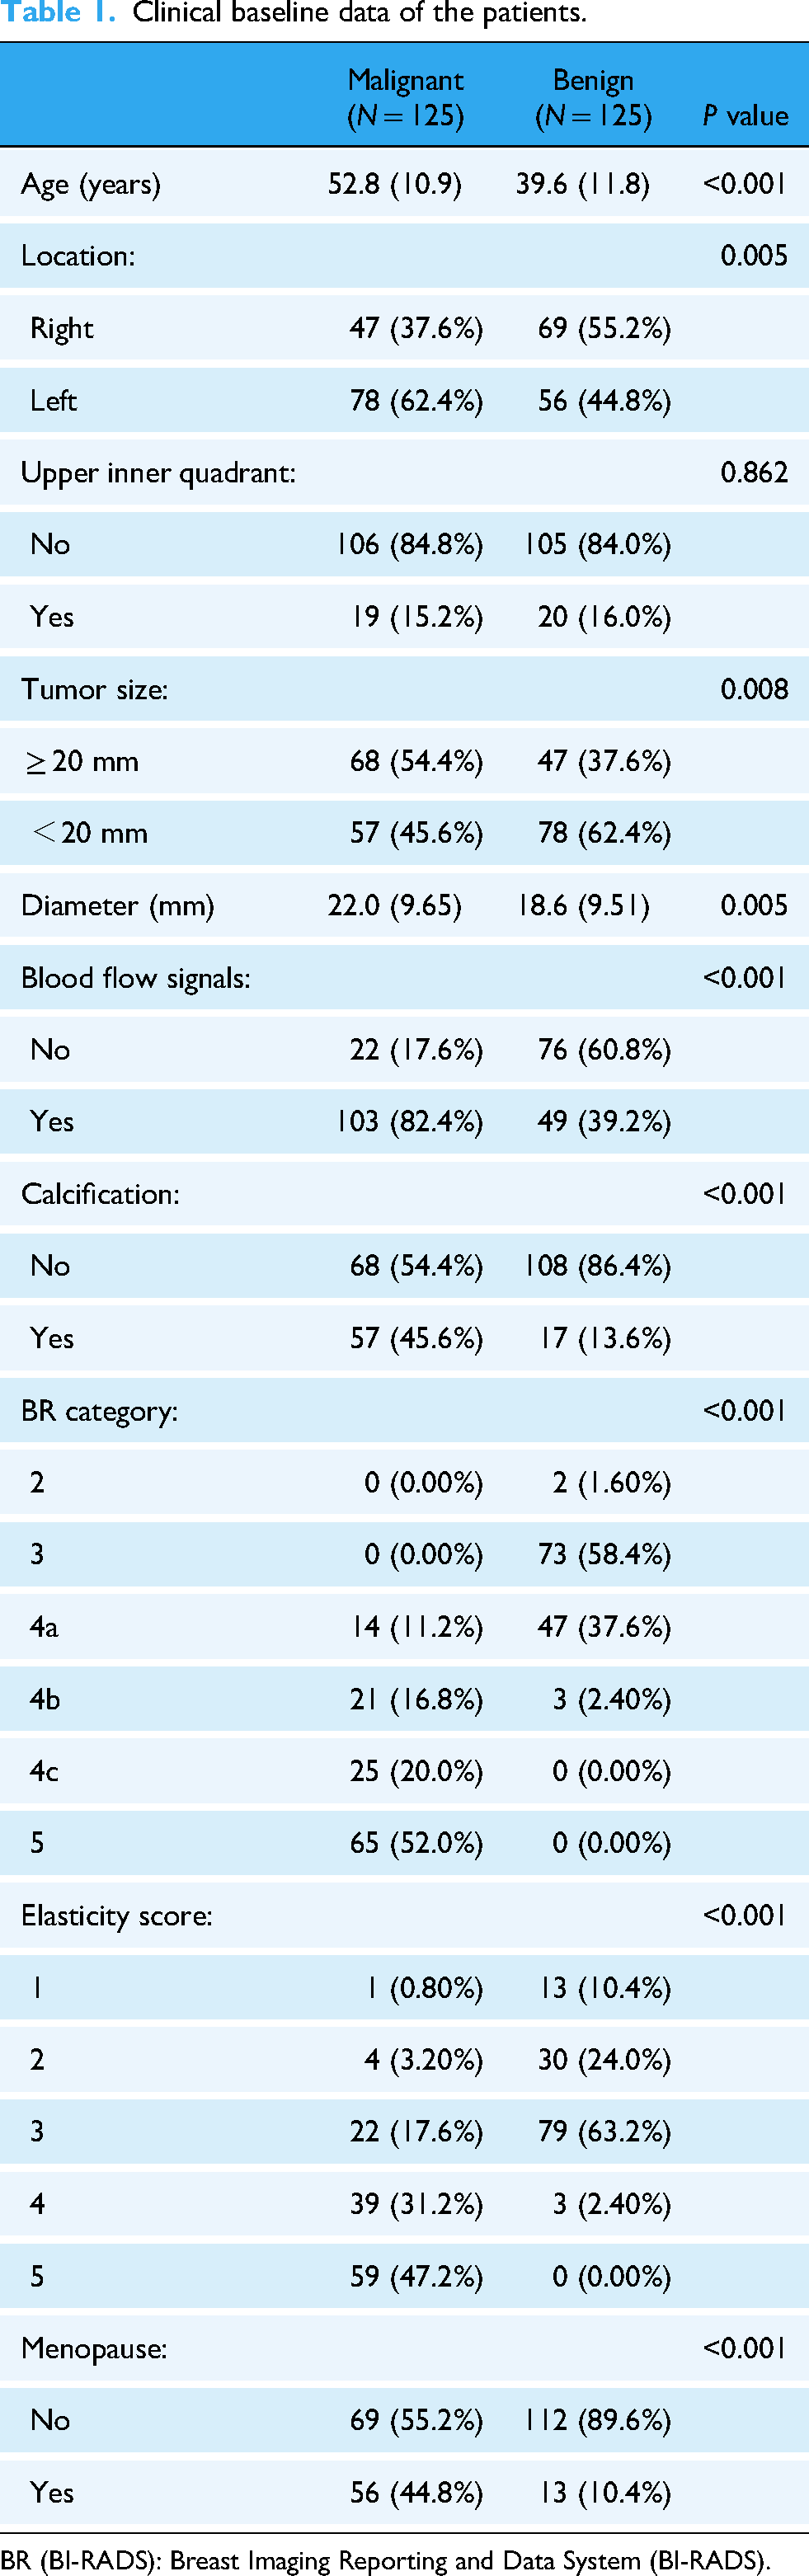
BR (BI-RADS): Breast Imaging Reporting and Data System (BI-RADS).
Results of radiomics feature extraction and selection
In this study, a total of 980 radiomics features were extracted from both intratumoral and peritumoral regions, including peritumoral expansions of 5, 10, and 20 mm. The extracted features encompassed first-order statistical features, shape features, and texture-based features, including gray-level co-occurrence matrix, gray-level run length matrix, gray-level size zone matrix, and neighboring gray tone difference matrix (NGTDM) features, along with wavelet-based features. These features provided a comprehensive quantitative description of tumor shape, density distribution, texture complexity, and the peritumoral microenvironment, aiming to capture the heterogeneity and underlying biological characteristics of both the breast masses and their surrounding regions.
After feature extraction, the LASSO regression method was applied to perform feature selection for each subgroup. Specifically, we conducted an initial screening of the features extracted from each subgroup, including the intratumoral region and peritumoral regions (5, 10, and 20 mm), retaining the most representative features. For each subgroup, the 20 most predictive features were ultimately selected. These features not only reflected the intrinsic biological properties of the tumors but also revealed the potential role of the peritumoral microenvironment. These selected features were subsequently used for training and validating the machine-learning models. Figure 2 illustrates the correlations among the selected features in the cross validation.
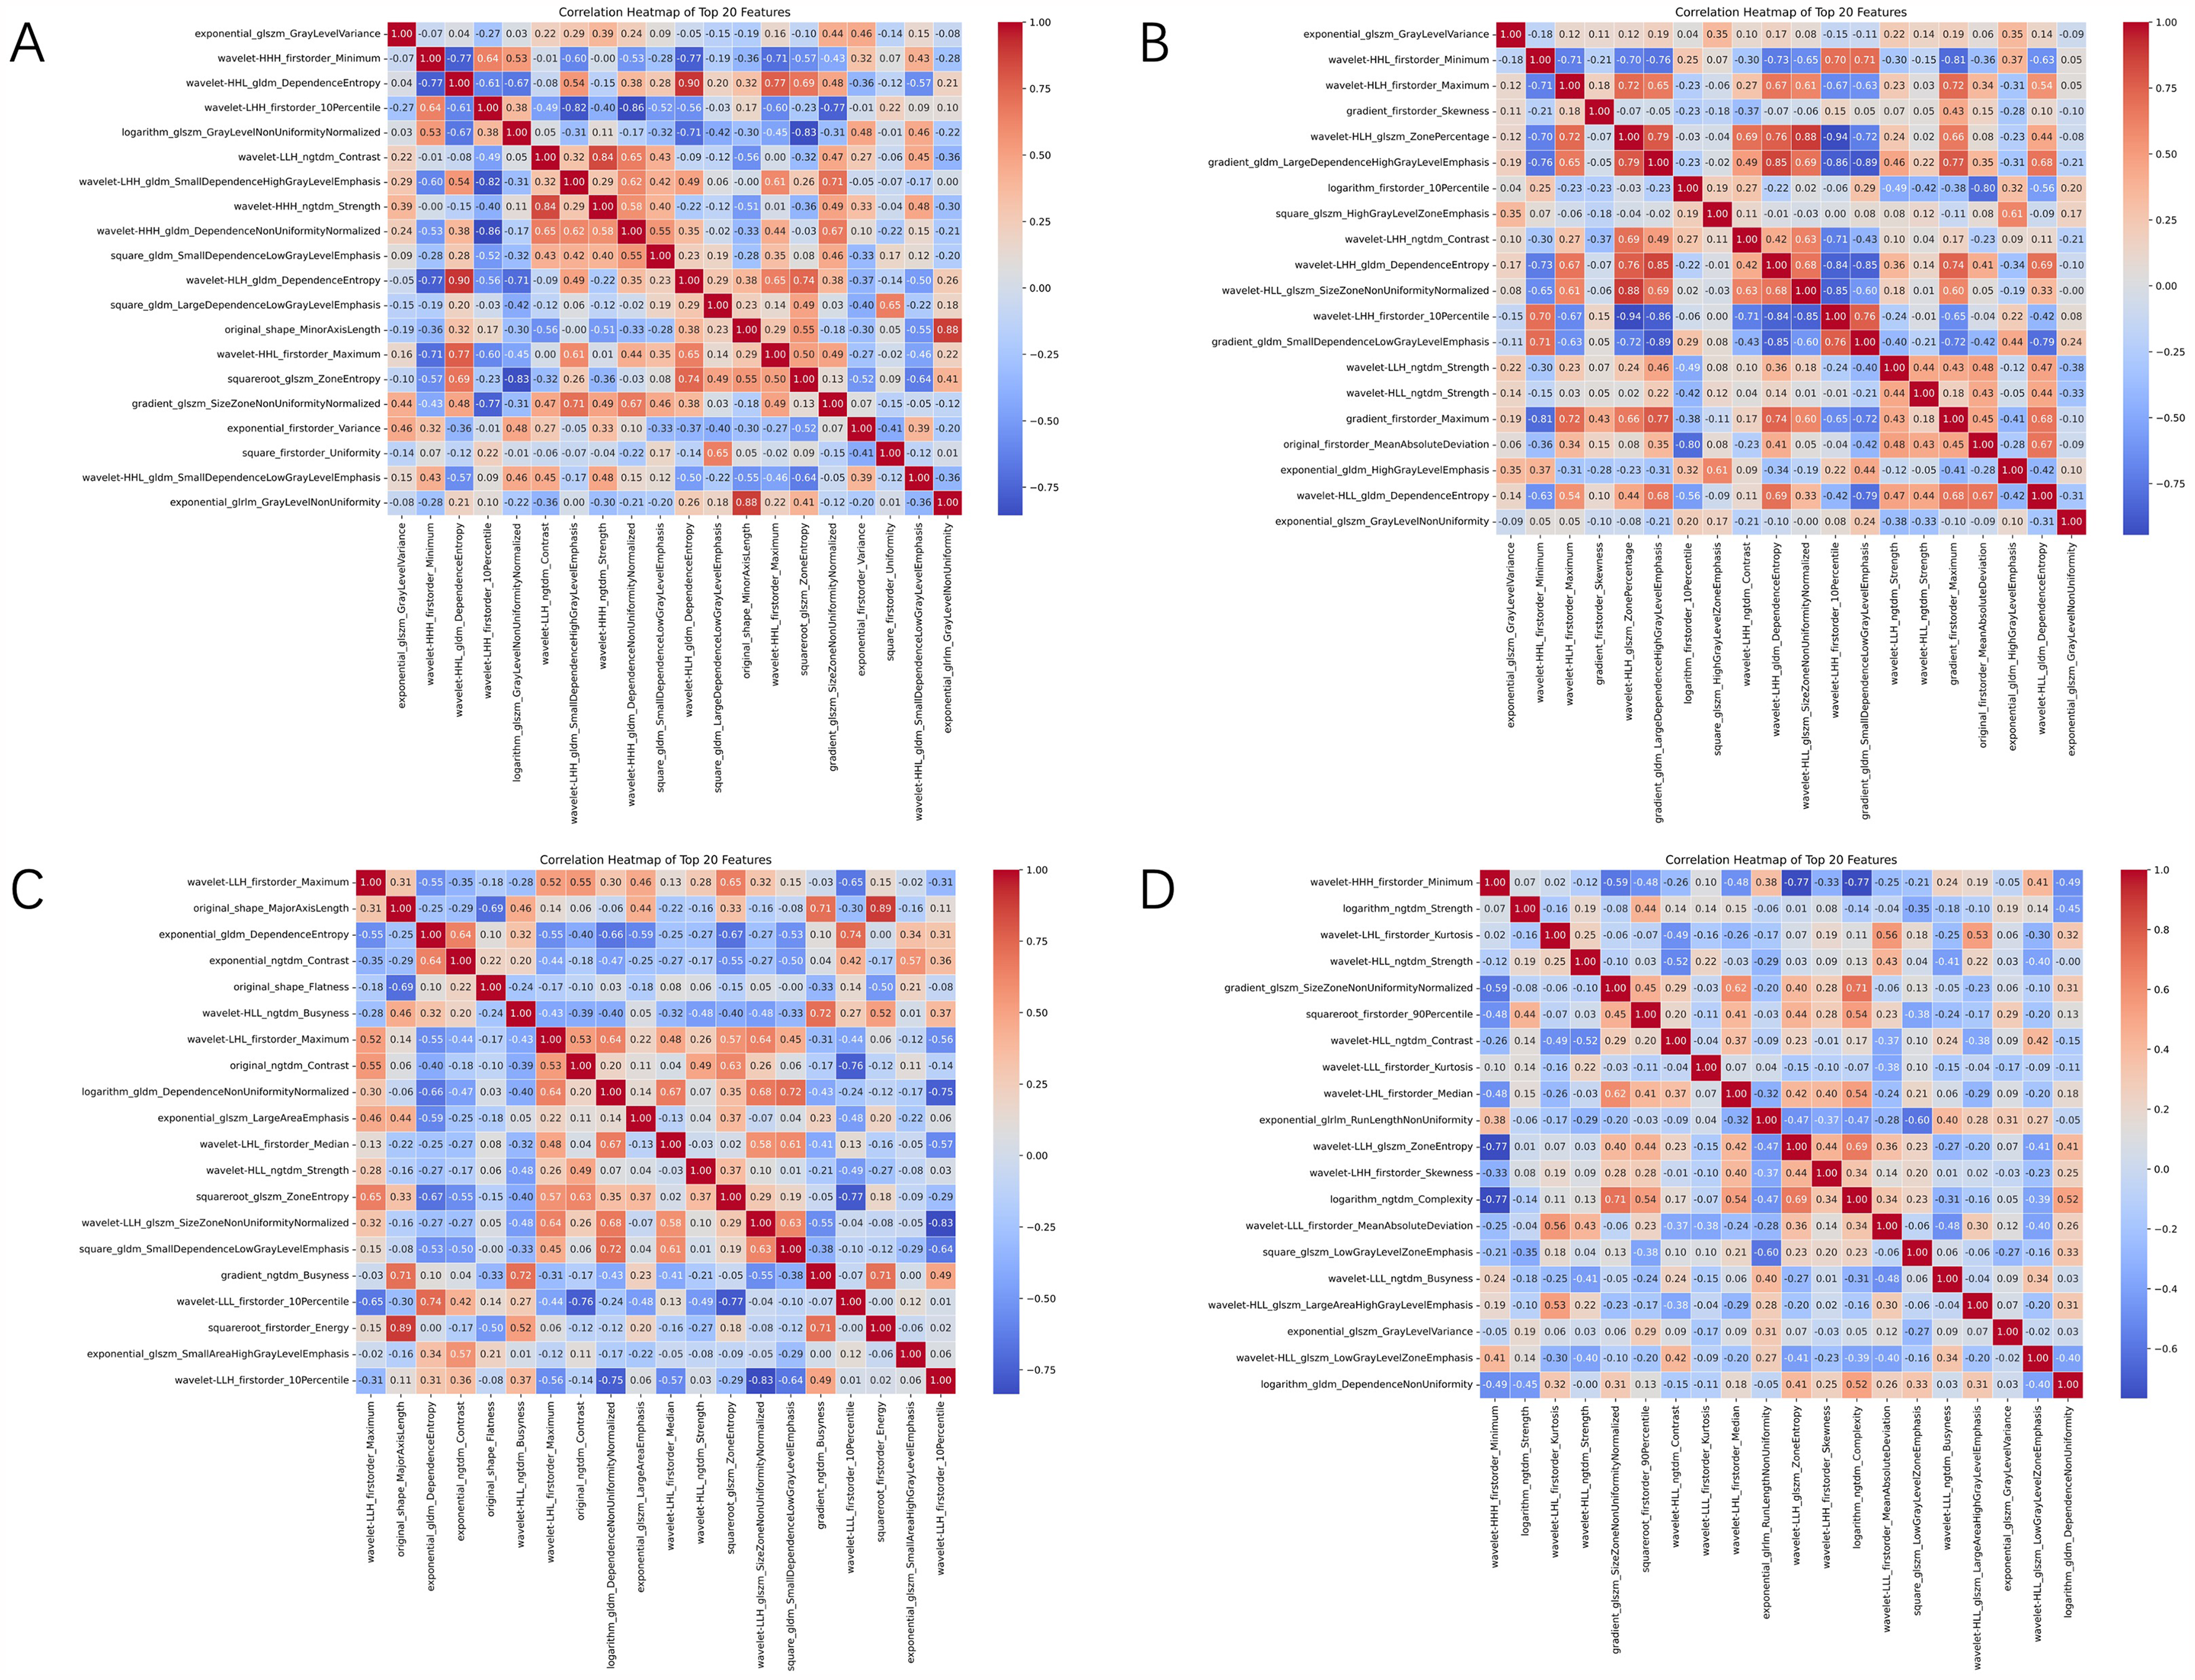
Correlation matrix between imaging features. (A)–(D) represent the lesion group, lesion + 5 mm peritumoral group, lesion + 10 mm peritumoral group, and lesion + 20 mm peritumoral group, respectively.
Comparison of machine-learning models
This section presents a detailed comparison between radiomics-only models and combined radiomics-clinical models. By displaying the receiver operating characteristic (ROC) curves, calibration curves, and decision curves of the five subgroups, we visually analyze the diagnostic performance of the different models (Figures 3 and 4). Additionally, Supplemental Material 1 provides specific performance parameters for the models within each subgroup, offering comprehensive support for our study.

Performance comparison of each model in the imaging group. (A)–(C) represent the receiver operating characteristic (ROC) curve, calibration curve, and DCA curve of the model, respectively. Among them, from left to right, they represent the results of the lesion group, lesion + 5 mm peritumoral group, lesion + 10 mm peritumoral group, and lesion + 20 mm peritumoral group.

Performance comparison of models in the imaging combined with clinical group. (A)–(C) represent the receiver operating characteristic (ROC) curve, calibration curve, and DCA curve of the model, respectively.
Results of radiomics-only models
In the analysis of radiomics-only models, we primarily compared the performance of four classifiers: SVM, RF, XGBoost, LGBM. These models were built using a combination of intratumoral and peritumoral features, including the intratumoral region alone, as well as peritumoral expansions of 5, 10, and 20 mm. The results showed that including peritumoral features significantly improved the predictive performance. For example, the accuracy of the SVM model increased from 63.01% (intratumoral features only) to 66.67% when combined with the intratumoral + 10 mm peritumoral features. Similarly, the F1-score increased from 0.5846 to 0.6762, indicating better balance between precision and recall. Additionally, the results show that the model's diagnostic performance was optimal in the intratumoral + 10 mm peritumoral combination, achieving the highest values for accuracy (LGBM: 0.701, XGBoost: 0.696, RF: 0.651, SVM: 0.666), precision (LGBM: 0.693, XGBoost: 0.871, RF: 0.633, SVM: 0.656), and F1-score (LGBM: 0.693, XGBoost: 0.726, RF: 0.663, SVM: 0.676). The calibration curve indicated that the predicted probabilities of the intratumoral + 10 mm peritumoral model aligned most closely with the actual probabilities, further validating the importance of peritumoral features in radiomics models. Decision curve analysis demonstrated that this model provided favorable net benefits, suggesting its potential for clinical application.
Results of combined radiomics-clinical models
In the analysis of combined radiomics-clinical models, clinical features were integrated with the radiomics-only models to explore the added value of clinical information. The combined models were built using the previously discussed intratumoral + 10 mm peritumoral features, and their AUC, calibration, and clinical utility were evaluated. After incorporating clinical features, the diagnostic performance of the models improved further. The AUCs of the four classifiers were as follows: SVM 0.730, RF 0.774, XGBoost 0.905, and LGBM 0.909, demonstrating the superior performance of LGBM and XGBoost models when combining radiomics and clinical features. The calibration curves indicated that the predictions of the combined models demonstrated reasonable stability, contributing to predictive accuracy. Decision curve analysis showed that these combined models provided higher net benefits across various threshold probabilities, confirming the value of integrating clinical information.
Interpretability analysis of the models
To quantify the importance of features and their contributions to the model outputs, we employed the SHAP method. In this section, we selected the LGBM model, which exhibited the best diagnostic performance (Supplemental Material 1) in the combined radiomics-clinical models, to conduct an interpretability analysis on the results of each subgroup. Figure 5 presents the SHAP analysis results for the five subgroups, clearly demonstrating the roles of various features in different combinations. The SHAP analysis of the LGBM model provided detailed information on the positive and negative contributions of individual features to the predictions. In the SHAP plots, red dots represent high feature values, while blue dots indicate low feature values. The horizontal axis reflects the magnitude of the SHAP value, indicating the specific impact of each feature on the model's output. Higher SHAP values suggest that the feature contributes more to predicting malignancy, whereas negative SHAP values indicate a tendency to support benign predictions. Through SHAP analysis of the intratumoral + 10 mm peritumoral combination, we found that features such as wavelet-LHL_gldm_DependenceEntropy and wavelet-HHL_firstorder_Skewness played a significant role in the model's predictive performance. Moreover, in the combination of intratumoral + 10 mm peritumoral + clinical features, lower values of wavelet-LLL_ngtdm_Contrast were more closely associated with malignant tumors, further validating the importance of the peritumoral region in the predictive model.

SHapley Additive exPlanations (SHAP) interpretability analysis of the model. Among them, (A)–(E) represent the lesion group, lesion + 5 mm peritumoral group, lesion + 10 mm peritumoral group, lesion + 20 mm peritumoral group, and imaging + clinical group, respectively.
In the combined radiomics-clinical analysis, we further observed that clinical features such as age, the maximum diameter of the lump (Maximum_diameter_of_the_lump), blood flow status (Mass_blood_flow) and elasticity scoring (Flex_scoring) also made significant contributions to the predictions. The SHAP values highlighted the indispensable role of clinical information in model predictions, especially when combined with radiomics features, providing a more comprehensive interpretation. High blood flow, greater hardness, and larger tumor diameters were often associated with malignancy, as confirmed in the SHAP plots. The SHAP summary plots not only allowed us to evaluate the effect of individual features but also revealed interactions between different features. For example, in certain subgroups, combinations of features such as original_shape_MajorAxiLength and squareroot_firstorder_Energy exhibited synergistic effects on the model predictions, further enhancing the accuracy and reliability of the predictions.
Discussion
This study systematically evaluated the clinical value of ABVS imaging in distinguishing between benign and malignant breast masses by developing machine-learning models based on intratumoral and peritumoral radiomics features. Building on this, we further integrated clinical features to construct combined radiomics-clinical models, exploring the impact of multimodal features on diagnostic performance. The results indicated that incorporating peritumoral features significantly improved the predictive performance of radiomics models, with the intratumoral + 10 mm peritumoral model showing the best performance. When clinical features were further included, the predictive performance of the models improved substantially. The LGBM model achieved the best performance, with an AUC of 0.9097, alongside notable metrics such as accuracy (0.8788), precision (0.871), recall (0.871), and F1-score (0.971), demonstrating its superior diagnostic utility in integrating clinical and imaging features. SHAP interpretability analysis revealed the importance of peritumoral and clinical features in predicting malignant masses, providing deeper insights into their contributions.
This study employed four classic machine-learning algorithms—SVM, RF, XGBoost, and LGBM—each demonstrating unique strengths. SVM excels at handling nonlinear relationships but is sensitive to parameter settings and data scale, with relatively low computational efficiency. The relatively modest performance of the SVM model (accuracy of 0.712 and AUC of 0.730) can be attributed to its sensitivity to feature scaling and class overlap, which may be pronounced in a heterogeneous imaging dataset. Additionally, SVM's reliance on a predefined kernel function may limit its ability to capture complex, non-linear relationships in the data. These challenges highlight the potential benefits of exploring ensemble methods or deep-learning approaches for improved performance.
Our results showed that while RF is robust at handling noisy data and imbalances, it underperformed in comparison to XGBoost and LGBM on more complex datasets. This is likely due to RF's tree growth strategy, which is random and not as optimized for capturing intricate patterns in data. RF's reliance on a simple majority-vote decision mechanism can limit its ability to model the nuanced relationships between features, which are critical in medical image classification tasks. XGBoost, on the other hand, outperformed RF due to its gradient boosting technique and the ability to perform parallel computing, which allowed for better handling of complex, high-dimensional relationships between radiomics and clinical features. In this study, XGBoost demonstrated superior accuracy and an improved ability to control overfitting by using regularization and advanced tree pruning techniques. LGBM provided the best performance across all subgroups, especially in models integrating both radiomics and clinical data. In the study by Xinkang Li et al. on predicting the ADMET properties of anti-breast cancer compounds, the LGBM model also demonstrated excellent performance (accuracy > 0.87, precision > 0.72, recall > 0.73, and F1-score > 0.73). 23 LGBM's optimization of split strategies and its efficient use of resources, particularly in large datasets, contributed to its superior predictive power. By reducing the computational burden through its histogram-based approach to decision tree learning, LGBM is able to process large amounts of data more quickly and accurately than other models. This comparison provided valuable insights for selecting the optimal predictive model.
In machine learning, many complex models are often difficult to interpret and are commonly referred to as “black box” models. However, SHAP analysis enhances model transparency by quantifying the contribution of each feature to the prediction outcome. For instance, in the intratumoral + 10 mm peritumoral combination LGBM model, the wavelet-LHL_gldm_DependenceEntropy texture feature played a crucial role in diagnostic performance. This feature represented the entropy value of the gray level dependence matrix in the LHL frequency band of the wavelet transform. Its lower values tended to be associated with malignant tumors, possibly due to the higher cell density and tighter cellular arrangement in malignancies, leading to increased local uniformity (lower entropy). Additionally, processes such as cell proliferation and necrosis may have further enhanced local texture regularity. Similarly, in the intratumoral + peritumoral + clinical feature combination LGBM model, wavelet-LLL_ngtdm_Contrast had the greatest impact, as it described local grayscale contrast. This may have been attributed to the infiltrative growth and indistinct boundaries of malignant tumors, resulting in lower grayscale differences between the tumor margins and surrounding tissues, thus reflecting lower NGTDM values. Similar features have also been confirmed in some studies24,25 to be associated with malignant breast tumors. These findings further highlighted the critical role of the peritumoral microenvironment in predictive modeling. This study not only improved the interpretability and personalization of the predictive model but also significantly enhanced its clinical applicability.
ABVS offers a 3D imaging pattern similar to MRI, overcoming the limitations of conventional ultrasound, such as dependence on operator experience and lack of standardization, while offering lower costs and greater accessibility, making it highly advantageous for clinical use.26,27 Unlike two-dimensional (2D) ultrasound, ABVS captures multiplanar imaging information from transverse, sagittal, and coronal views, enabling comprehensive 3D evaluations of breast masses. 28 However, most existing studies still focus on 2D image analysis, overlooking the spatial complexity and specificity of tumors. In fact, the presentation of tumors in 3D space often reflects their internal heterogeneity and changes in the surrounding microenvironment, which are critical for early identification and accurate classification of malignant tumors. Through 3D radiomics analysis of ABVS images, we can extract high-dimensional features beyond human visual perception. These features not only provide information on tumor morphology and density but also reveal the texture complexity and dynamic changes in both intratumoral and peritumoral regions, leading to more precise assessments of mass malignancy.
This study is the first to systematically explore the impact of peritumoral region size on predictive performance using ABVS imaging. We selected peritumoral thicknesses of 5, 10, and 20 mm and analyzed them together with intratumoral and clinical features within the radiomics pipeline. The results demonstrated that the inclusion of peritumoral features significantly enhanced the predictive performance of radiomics models, with the intratumoral + 10 mm peritumoral model achieving the best results. These findings are consistent with previous radiomics studies, reinforcing the clinical value of peritumoral features. For example, Wang et al. 29 reported that combining intratumoral and peritumoral features increased the AUC from 0.715 to 0.847 in the training set and from 0.647 to 0.844 in the validation set. Similarly, Zhong et al. 30 found that integrating 18 intratumoral features with 21 peritumoral features improved the AUC from 0.797 to 0.910 in the training set and from 0.780 to 0.840 in the test set. These studies indicate that peritumoral features not only supplement the information missed by intratumoral features but also reveal interactions between tumors and their surrounding microenvironment, which are essential for improving diagnostic efficiency. Our study further found that the choice of peritumoral region size is critical. A 5 mm peritumoral region may not capture key microenvironmental features, while a 20 mm region may introduce too much irrelevant information, reducing model performance. Therefore, the 10 mm peritumoral model demonstrated the best performance in this study, proving that an appropriate peritumoral range can better reflect the biological properties and invasiveness of tumors.
From the perspective of clinical application, these machine-learning models can provide strong support for the early screening of breast lumps, especially in distinguishing benign and malignant lumps. By automatically analyzing the imaging features both inside and outside the tumor, as well as the relevant clinical information, the model can reduce the deviation and error in the manual interpretation process and improve the consistency and accuracy of diagnosis. Specifically, based on the integration of imaging and clinical information, the model can not only help doctors detect malignant lumps early, but also provide reference for individualized treatment plans. Especially when faced with blurred boundaries or early tumors, it can effectively assist clinical decision-making.
This study has certain limitations. First, we used manual segmentation to delineate the lesions. Although this approach ensures accurate ROI definitions, it is labor-intensive and time-consuming, with limited reproducibility. Second, this study is a single-center retrospective study, lacking external validation with prospective data from multiple centers, which limits the generalizability and applicability of the model across different medical institutions. Finally, the optimal peritumoral region size may vary depending on specific clinical applications, necessitating further studies to explore and validate the impact of different peritumoral region sizes on radiomics analysis and model performance.
Conclusion
This study developed four machine-learning models for the preoperative prediction of benign and malignant breast masses by utilizing intratumoral and peritumoral features from ABVS imaging, combined with clinical information. The results indicated that incorporating peritumoral features improved model performance to some extent, with the intratumoral + 10 mm peritumoral combination model showing the best performance. The integration of radiomics and clinical features further enhanced diagnostic efficiency. Among the models, the LGBM model demonstrated the best performance across multiple metrics. SHAP analysis revealed the contributions of key features, enhancing the interpretability and clinical value of the model.
Supplemental Material
sj-docx-1-dhj-10.1177_20552076251332738 - Supplemental material for Machine-learning models for differentiating benign and malignant breast masses: Integrating automated breast volume scanning intra-tumoral, peri-tumoral features, and clinical information
Supplemental material, sj-docx-1-dhj-10.1177_20552076251332738 for Machine-learning models for differentiating benign and malignant breast masses: Integrating automated breast volume scanning intra-tumoral, peri-tumoral features, and clinical information by Meixue Dai, Yueqiong Yan, Zhong Li and Jidong Xiao in DIGITAL HEALTH
Footnotes
Acknowledgements
The authors thank all the participating patients and doctors.
Ethical approval
The study was conducted in accordance with the Declaration of Helsinki,and approved by the Ethics Committee of the ThirdXiangya Hospital(Quick 23190,approval date:4 Apr 2023).
Contributorship
MD researched literature and designed the study. MD, YY, and JX collected ABVS images and patient information. MD and ZL conducted the data analysis. MD wrote and edited the paper. JX and ZL directed the writing. All authors contributed to the article and approved the submitted version.
Funding
The authors disclosed receipt of the following financial support for the research, authorship, and/or publication of this article: This work was supported by the Hunan Provincial Natural Science Foundation of China, (grant number (No. 2019JJ40459)).
Conflicting interests
The authors declared no potential conflicts of interest with respect to the research, authorship, and/or publication of this article.
Guarantor
Jidong Xiao is guarantor for this study.
Supplemental material
Supplemental material for this article is available online.
References
Supplementary Material
Please find the following supplemental material available below.
For Open Access articles published under a Creative Commons License, all supplemental material carries the same license as the article it is associated with.
For non-Open Access articles published, all supplemental material carries a non-exclusive license, and permission requests for re-use of supplemental material or any part of supplemental material shall be sent directly to the copyright owner as specified in the copyright notice associated with the article.