
Abstract
Objective
The invasiveness of lung adenocarcinoma significantly impacts clinical decision-making. However, assessing this invasiveness preoperatively, especially when it manifests as pure ground-glass nodules (pGGN) on CT scans, poses challenges. This study aims to quantify intratumor heterogeneity (ITH) and determine whether the ITH score can enhance the accuracy of invasiveness predictions.
Methods
A total of 524 patients with lung adenocarcinomas presenting as pGGN were enrolled in the study, with 177 (33.78%) receiving a pathologic diagnosis of invasiveness. Four diagnostic approaches were developed to predict the invasiveness of lung adenocarcinoma presenting as pGGN: (1) conventional lesion size, (2) ITH score, (3) clinical-radiological features (ClinRad), and (4) integration of the ITH score with ClinRad. ClinRad alone or in combination with the ITH score served as the input for 11 machine learning approaches. The trained models were evaluated in an independent validation cohort, and the area under the curve (AUC) was calculated to assess classification performance.
Results
The conventional lesion size showed the lowest performance, with an AUC of 0.826 (95% confidence interval [CI]: 0.758–0.894), while the ITH score outperformed it with an AUC of 0.846 (95% CI: 0.787–0.905). The CatBoost model performed best when the ITH score and ClinRad were both used as input features, leading to the development of an ITH-ClinRad-guided CatBoost classifier. CatBoost also excelled with ClinRad alone, resulting in a ClinRad-guided CatBoost classifier with an AUC of 0.830 (95% CI: 0.764–0.896), surpassed by the ITH-ClinRad-guided CatBoost classifier with an AUC of 0.871 (95% CI: 0.818–0.924).
Conclusion
The ITH-ClinRad-guided CatBoost classifier emerges as a promising tool with significant potential to revolutionize the management of lung adenocarcinomas presenting as pGGNs.
Keywords
Introduction
With advancements in lung cancer screening, lung adenocarcinomas can be detected earlier using computed tomography (CT). Ground glass nodules (GGNs) are focal nodular areas that exhibit increased lung attenuation, pulmonary vessels, and bronchial structures within the nodule, as defined by the Fleischner Society. GGNs are classified based on the presence of solid components into mixed GGNs and pure GGNs (pGGNs). pGGNs are characterized by the absence of solid components1–3 and demonstrate a more indolent growth pattern and slow progression.4,5 Even in cases where pGGNs are diagnosed as malignant after surgery, pathology is more likely to reveal atypical adenomatous hyperplasia (AAH), adenocarcinoma in situ (AIS), or minimally invasive adenocarcinoma (MIA), rather than invasive adenocarcinoma (IAC).6,7 However, while many pGGNs follow an indolent course, a significant number are diagnosed pathologically as IAC, with incidence rates ranging from 35.4% to 44.2%.8–10 AIS and MIA exhibit 10-year disease-free survival rates of 100% after complete resection, 11 whereas IAC has a 5-year survival rate of 89% after complete resection. 12 Consequently, while segmentectomy or wedge resection is often adequate for AAH/AIS or MIA, IAC is typically treated with lobectomy.13,14 Preoperative assessment of the invasiveness of lung adenocarcinoma on CT significantly affects clinical decision-making and ensures appropriate management. 15 However, this assessment can be challenging owing to overlapping CT features among pGGNs, potentially leading to overdiagnosis and overtreatment.
Previous studies have shown that the invasiveness of pGGNs is primarily associated with the lesion size rather than the clinical-radiological features (ClinRad), such as age, margin, bubble lucency, or pleural indentation.16–19 Consequently, management of pGGNs is based on the lesion size, following the guidelines of the 8th edition of TNM staging, in which lesion size is defined as the maximum diameter in the axial plane on CT.20,21 Although lesion size is a convenient and straightforward method for assessing invasiveness, its utility is limited due to insufficient objectivity and inability to fully reflect biological properties. Lesion size overlooks intratumor heterogeneity (ITH) within the lesion, thus constraining diagnostic efficacy. ITH arises from various factors such as angiogenesis, metabolism, and proliferation, as well as diverse cell populations and their uneven distribution within different intratumoral subregions. 22 Currently, multi-scale information captured through the simultaneous integration of local and global pixel data on CT images that considers pixel characteristics and their spatial distribution can quantify ITH on CT images.23,24 The ITH score has been reported to be useful for prognosis assessment 23 and distinguishing histological subtypes. 25 Therefore, it is crucial to determine whether ITH score can aid in the assessment of the invasiveness of pGGNs and compare its efficacy with that of traditional diagnostic approaches, and whether it can be integrated into a new diagnostic biomarker.
Machine learning algorithms primarily achieve the mapping function from the input to the output by adjusting their parameters based on the given dataset, aiming to make the output as close as possible to the expected objective function. This approach has been widely applied in lung cancer diagnosis, treatment, and prognosis. 26 Given the lack of reliable, accurate, and efficient predictive models or diagnostic biomarkers, this study employed 11 machine learning algorithms to evaluate the invasiveness of pGGNs, with ClinRad and ITH scores as the input features. The primary objective of this study was to identify a new diagnostic biomarker capable of accurately predicting the invasiveness of adenocarcinoma on chest CT, thereby providing scientific evidence for clinical decision-making.
Methods
Study population
Ethical approval for this multicenter population-registry cancer study was obtained from the institutional ethics committees of the participating institutions (project approval number: No. 2021-07-009, No. KY2020147). Given the retrospective nature of the study, the requirement for written informed consent was waived. The study was conducted from January 2021 to June 2022 and included individuals with a pathological diagnosis of lung adenocarcinoma, which was categorized as AIS, MIA, or IAC, according to the IASLC/ATS/ERS classification. 13
Inclusion Criteria: (1) lung lesions that manifested as pGGNs on preoperative CT scans with a thin slice thickness of ≤ 1.5 mm. (2) The pGGN lesion size had to exceed 5 mm and be less than 30 mm in diameter on CT imaging. (3) Patients with no history of biopsy, chemotherapy, or radiotherapy prior to CT evaluation were included. Exclusion Criteria: (1) Patients with CT scans of poor image quality that significantly affected the observation and measurement of pGGNs; (2) Patients with a time gap of more than 14 days between the CT scan and surgery; (3) Patients with concurrent severe chronic conditions, such as other malignancies or significant comorbidities that could affect their overall health status and surgical outcomes.
Ultimately, 524 patients with persistent pGGNs were enrolled in the study. For cases with multiple lesions, representative lesions with a definitive pathological diagnosis were selected for inclusion. The procedural flow of this study is illustrated in Supplemental Figure 1. Patients were randomly assigned to either the training cohort (70%, n=366) or the validation cohort (30%, n=158). The training cohort was utilized to develop and optimize the predictive model, while the validation cohort was employed to independently assess the model's performance and generalizability.
CT examination
Preoperative chest CT was conducted at the participating hospitals using a multi-detector row CT system (Revolution CT [GE Healthcare], MX16 CT [Philips Healthcare], uCT550 or uCT760 [Shanghai United Imaging Healthcare]). The imaging procedure involved breath-hold helical scanning in the supine position, which covered the area from the lung apex to below the costophrenic angle. The volumetric CT scan parameters included a tube voltage of 120 kV, tube current-time product ranging from 180 to 280 mA, matrix size of 512×512, and image preprocessing. Reconstruction of the CT image was performed using a standard algorithm with the layer thickness/interval set at 0.55 to 0.625 mm.
Clinrad features
The medical records, including clinical characteristics (age and sex), pathological findings, and preoperative chest CT scans, were comprehensively reviewed. An experienced thoracic radiologist (H.L.) with over 10 years of experience assessed all lung lesions on the CT images and was blinded to most study information except for the presence of the lesion. pGGNs were assessed using a picture archiving and communication system with a lung window setting, and Hounsfield units (HU) of 1600 and window level of −600 HU. The CT value was measured three times using a region-of-interest (ROI) cursor to calculate the mean CT value and measure portions of the pGGN away from the air space and blood vessels. The maximum diameter in the axial plane determined the lesion size on CT images, following the guidelines of the 8th edition of the TNM staging system.20,21 Additionally, CT morphological features, such as tumor location, margins, lobulation, spiculation, vacuole sign, vascular convergence sign, and pleural indentation, were documented.
ITH score calculation
ITH score acquisition involved three steps, in accordance with previous literature23–25 nodule region segmentation, subregion clustering within the pGGN, and ITH score calculation.
First, we used ITK-SNAP software version 3.6.0 (www.itksnap.org) to segment the nodules in all CT images. A cardiothoracic radiologist (Z.Z.) manually delineated the ROI along the tumor border across each two-dimensional lesion section. The delineation was then reviewed by another radiologist (H.L.) with over 10 years of experience in the field, and adjustments were made, if required.
In the second step, we integrated both the local and global radiomic features. This involved a meticulous analysis of the variability in radiomic attributes within the tumor, considering both the localized and overall characteristics. We computed consistent radiomic properties for each pixel within the nodule region to capture intricate localized details. Subsequently, we employ clustering techniques based on the inherent local characteristics of the pixels to generate an informative visual map. The distribution patterns of clusters on the label map indicate the level of heterogeneity within the nodule, with pixels sharing the same cluster labels exhibiting similarities in intensity and neighboring textures.
In the third and final step, we set the optimal number of clusters to five based on previous research to precisely segment the intratumoral subregions.23,25 The ITH score was used as an evaluative metric to quantify the diversity level within the label maps (Fig. 1).
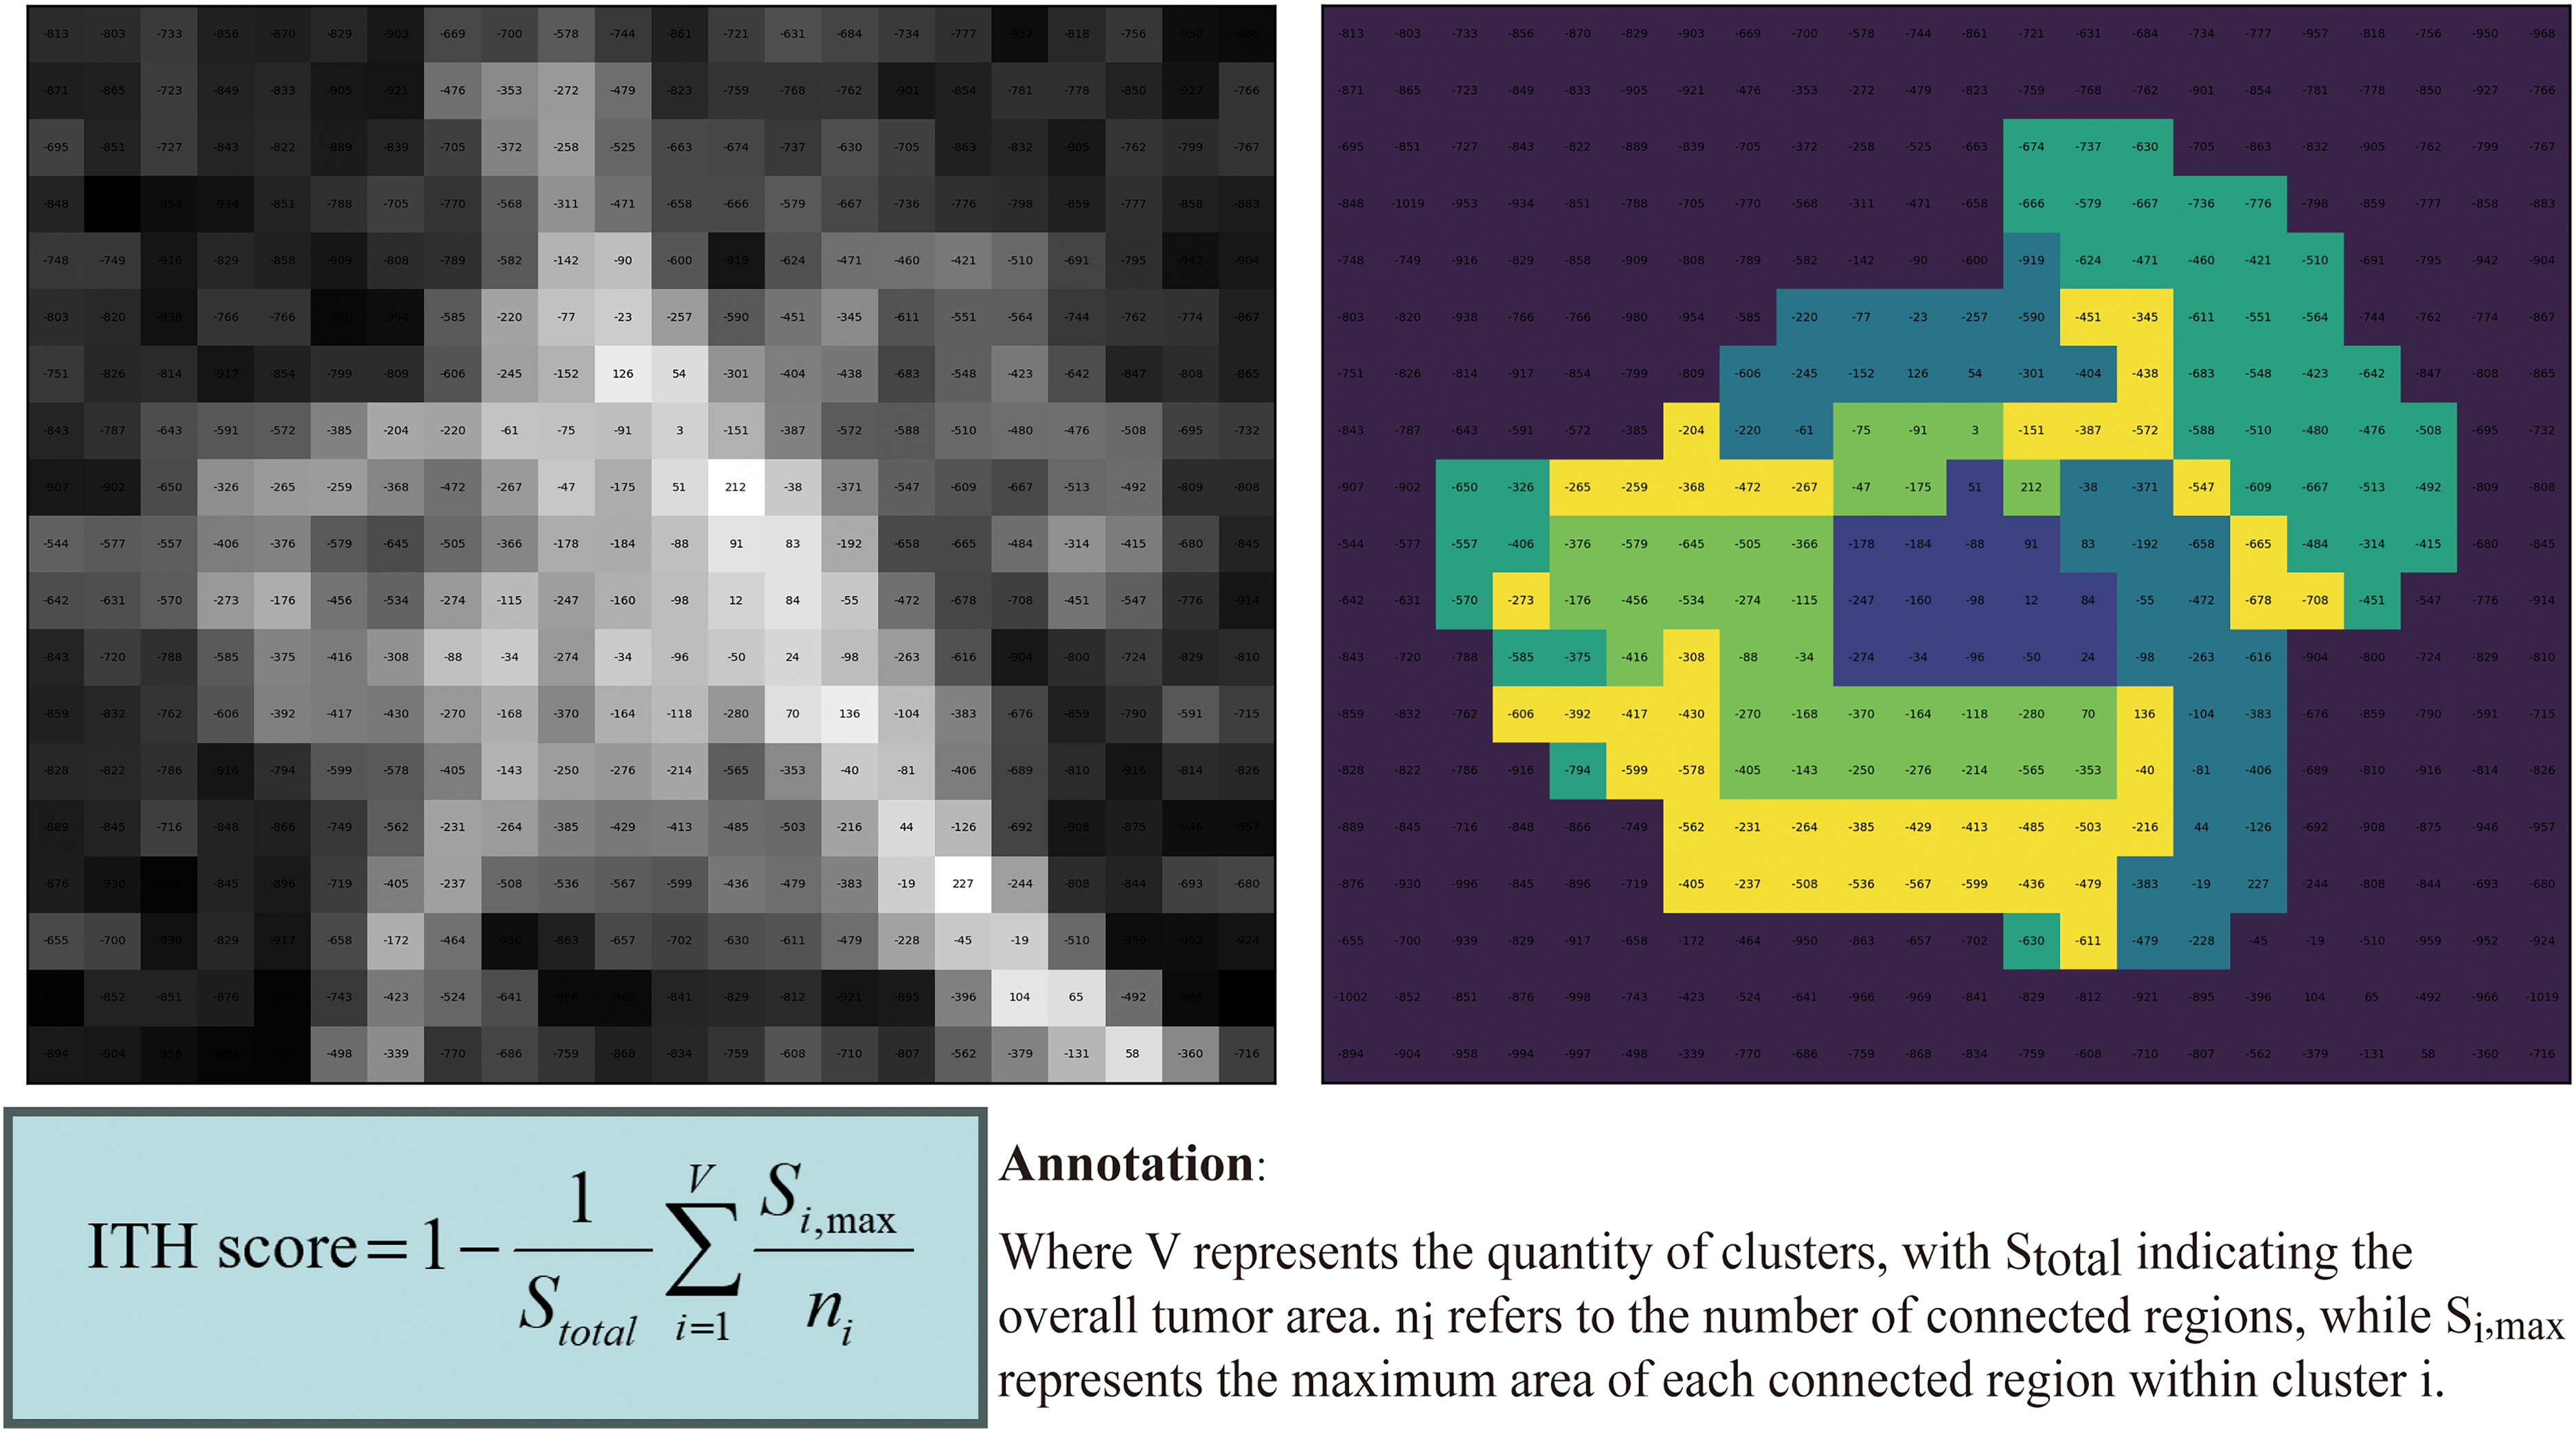
Acquisition and calculation process of the ITH score.
ITH-ClinRad-guided machine learning
We used 11 supervised machine-learning algorithms to integrate the ITH score with ClinRad and develop an optimal model. These algorithms, including logistic regression, gaussian naive bayes (Gaussian NB), k-nearest neighbor (KNN), support vector machine (SVM), multi-layer perceptron (MLP), classification and regression trees (CART), random forest (RF), gradient boosting machine (GBM), extreme gradient boosting (XGBoost), light gradient boosting machine (LightGBM), and categorical boosting (CatBoost), were imported from the scikit-learn machine learning package (version 1.4.2) in Python (version 3.12.1). 27 Subsequently, the models were developed using the training cohort, and a 10-fold cross-validation hyperparameter adjustment area under the curve (AUC) was used to optimize the model parameters. By employing 10-fold cross-validation on the training cohort to select the optimal parameters for each model, we effectively mitigated the risk of overfitting. Comprehensive parameters are detailed in Supplemental Material File 1.
The predictive performance of all machine learning classifiers was evaluated using the AUC. The trained models were tested on an independent validation cohort, and the AUC of their classification performance was calculated. The model with the highest AUC value in the validation cohort was selected as the final model. 28 To further evaluate the selected model, confusion matrix-driven metrics, including accuracy, sensitivity (SEN), specificity (SPE), positive prediction value (PPV), and negative prediction value (NPV), were used, along with the corresponding 95% confidence intervals (95% CI).
Statistical analysis
We used descriptive statistics for the demographic characteristics of the study participants. The normality of continuous variables was assessed using the Kolmogorov–Smirnov test. Continuous variables with a normal distribution were described using means ± standard deviations and compared using the independent samples t-test. Non-normally distributed data were reported as medians (interquartile ranges) and analyzed using the Mann–Whitney U test. Categorical variables were evaluated using the chi-squared test, and statistical significance was set at p < 0.05.
Results
Demographic characteristics
The demographic characteristics of the study participants, all of whom were confirmed to have either IAC or AIC/MIA based on postoperative pathology, are summarized in Table 1. The training and validation cohorts did not differ significantly. A total of 524 participants were included in the final analysis; 143 (27.2%) were men, and the median age was 55 years (interquartile range: 47–64 years). Among them, 177 (33.7%) were diagnosed with IAC. pGGN with corresponding pathologic diagnosis are provided in Supplemental Material File 2.
Baseline characteristics of the training, and validation cohort.

Abbreviation: LUL, left upper lobe; LLL, left lower lobe; RUL, right upper lobe; RML, right middle lobe; RLL, right lower lobe; IAC, invasive lung adenocarcinoma; AIS, adenocarcinoma in situ; MIA, minimally invasive adenocarcinoma; ITH, intratumor heterogeneity.
Machine learning models for identifying IAC
The general strategy for identifying IAC in pulmonary adenocarcinomas presenting as pGGNs using machine learning models is shown in Figure 2. We employed 11 supervised machine learning algorithms to merge the ITH score with ClinRad and developed an optimal approach. The trained models included logistic regression, Gaussian NB, KNN, SVM, MLP, CART, RF, GBM, XGBoost, LightGBM, and CatBoost, and each was cross-validated with 10-fold validation to determine the optimal model parameters in the training cohort. Model performance was assessed using the AUC in the validation cohort, with CatBoost achieving the highest AUC of 0.871 (95% CI: 0.818–0.924), as illustrated in the receiver operating characteristic (ROC) curve in Figure 3. Detailed performance metrics, such as AUC, ACC, SEN, SPE, PPV, and NPV, are outlined in Table 2 and Figure 4, confirming the suitability of the CatBoost model for classification modeling. Consequently, we developed an ITH-ClinRad-guided CatBoost classifier for IAC identification.

Study framework of enrolled cases, including CT scan, diagnosis approaches, the ITH-clinRad guided catBoost classifier, and comparison of diagnosis efficacy.
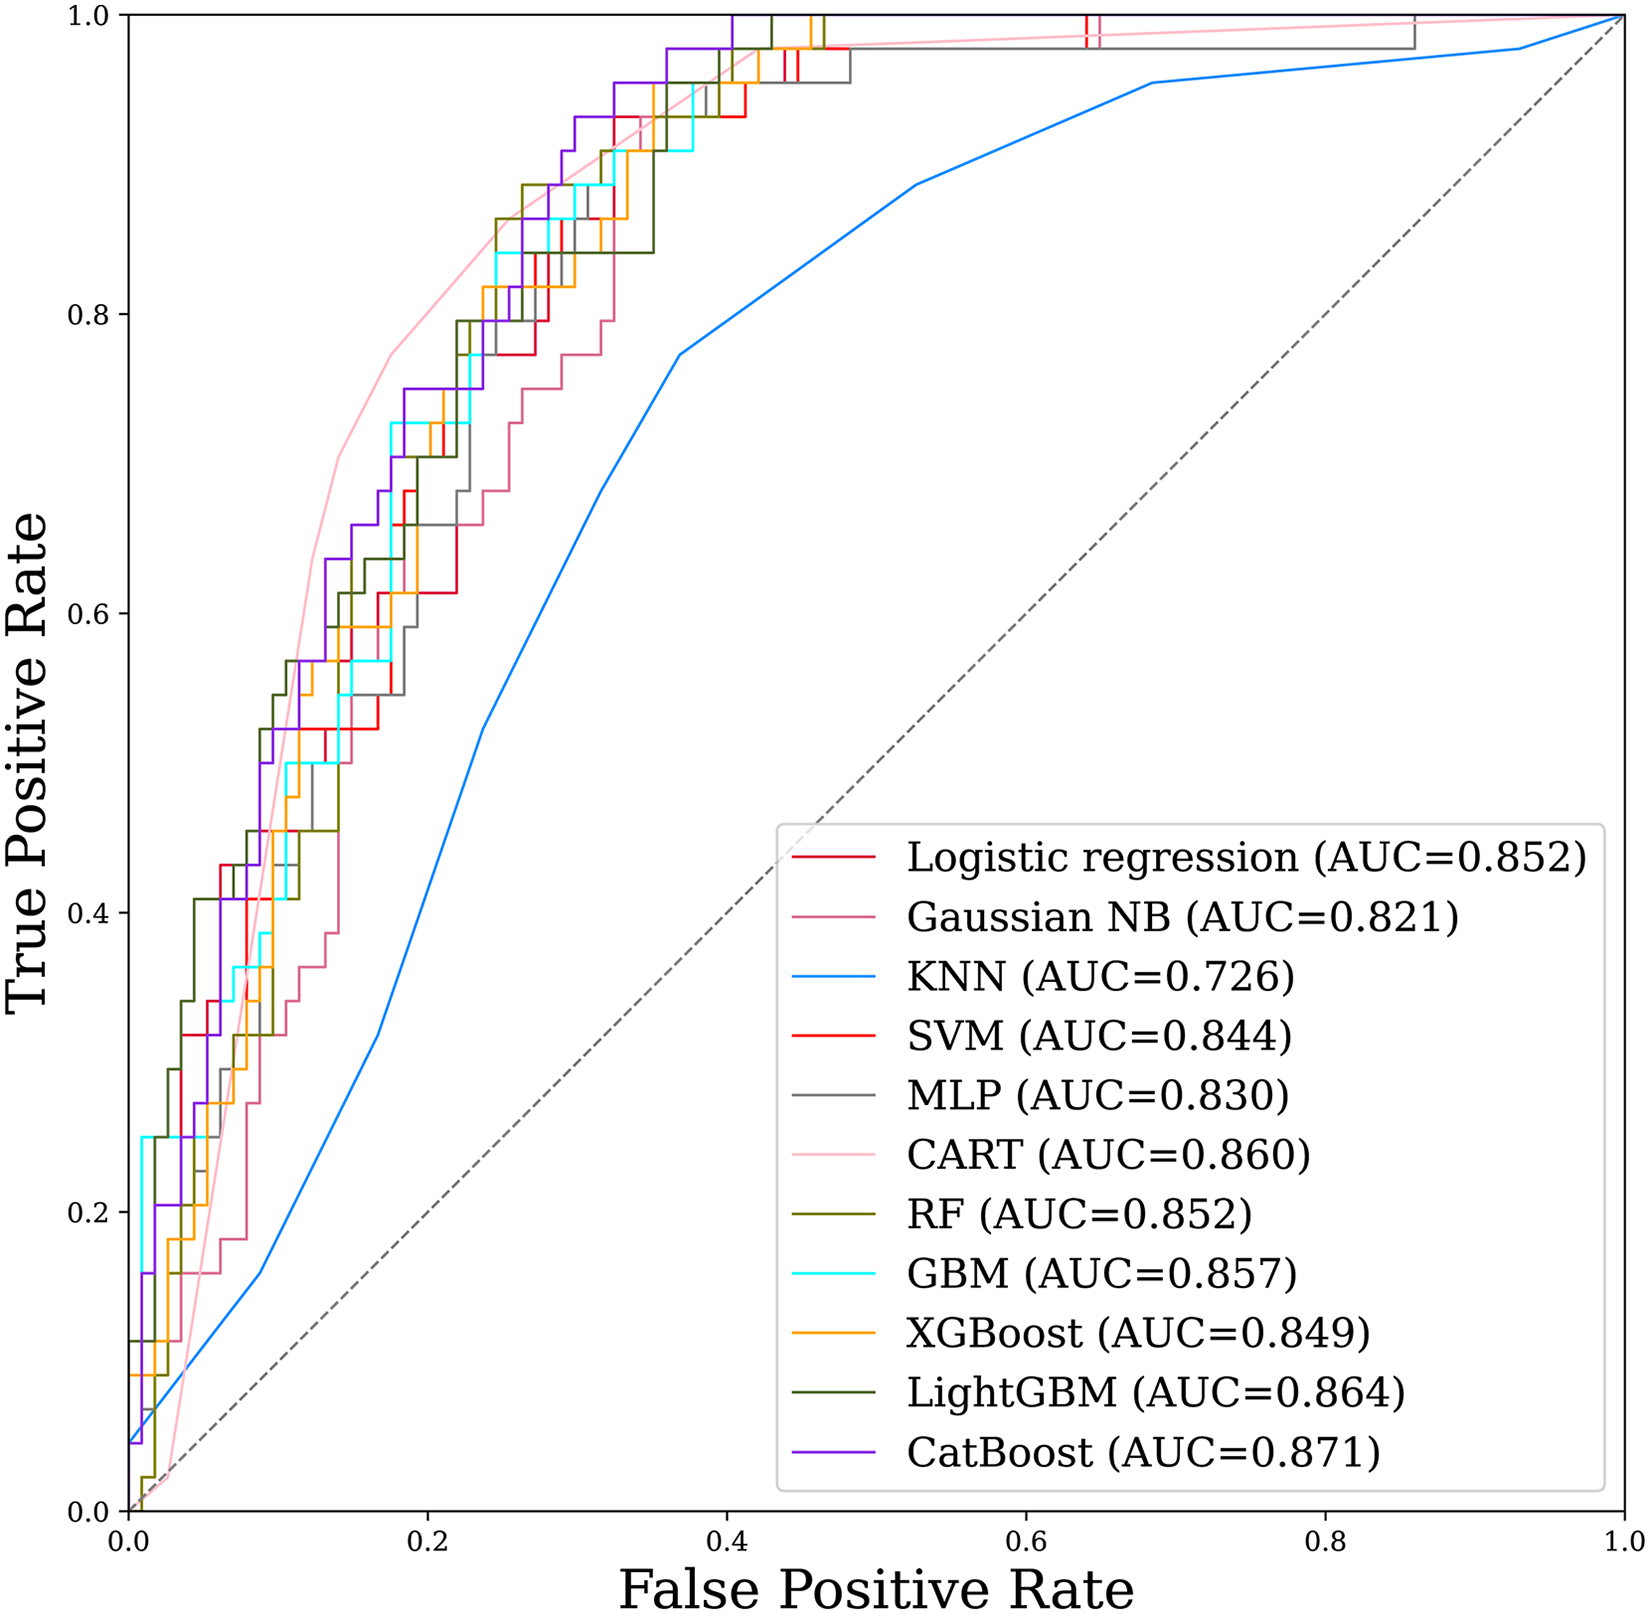
ROC curve analysis of 11 machine learning algorithms with the merge of the ITH score with clinRad.

AUC, ACC, SEN, SPE, PPV, and NPV of 11 machine learning algorithms.
Diagnostic efficacy across Various machine learning models.

Abbreviation: Gaussian NB, Gaussian Naive Bayes; KNN, K-nearest neighbor; SVM, support vector machine; MLP, multi-layer perceptron; CART, classification and regression trees; RF, random forest; GBM, gradient boosting machine; XGBoost, eXtreme gradient boosting; LightGBM, light gradient boosting machine; CatBoost, categorical boosting..
AUC, area under the curve; SEN, sensitivity; SPE, specificity; PPV, positive predictive value; NPV, negative predictive value.
According to further investigation of the ClinRad-guided machine learning for IAC prediction, the input variables consisted solely of ClinRad and the ITH score was excluded. CatBoost still outperformed the other models with an AUC of 0.830 (95% CI: 0.764–0.896), as shown in Supplemental Fig. 2. Accordingly, we established a ClinRad-guided CatBoost classifier for IAC classification.
Model interpretation
The SHapley Additive exPlanations (SHAP) method was used to visualize the selected variables in the ITH-ClinRad-guided CatBoost classifier for predicting IAC in pulmonary adenocarcinomas presenting as pGGNs and to explain their impact. 29 The results are presented as beeswarm plots, heatmaps, and force plots.
In Figure 5(a), the beeswarm plot illustrates the 13 most crucial features of the model. Each feature's importance line shows how all patients contributed to the results, with various colored dots indicating high- and low-risk values. The ITH score holds the highest importance in the model, followed by lesion size and mean CT value. The colored dots indicate that a higher ITH score, lesion size, and mean CT value correlate with a greater risk of IAC.
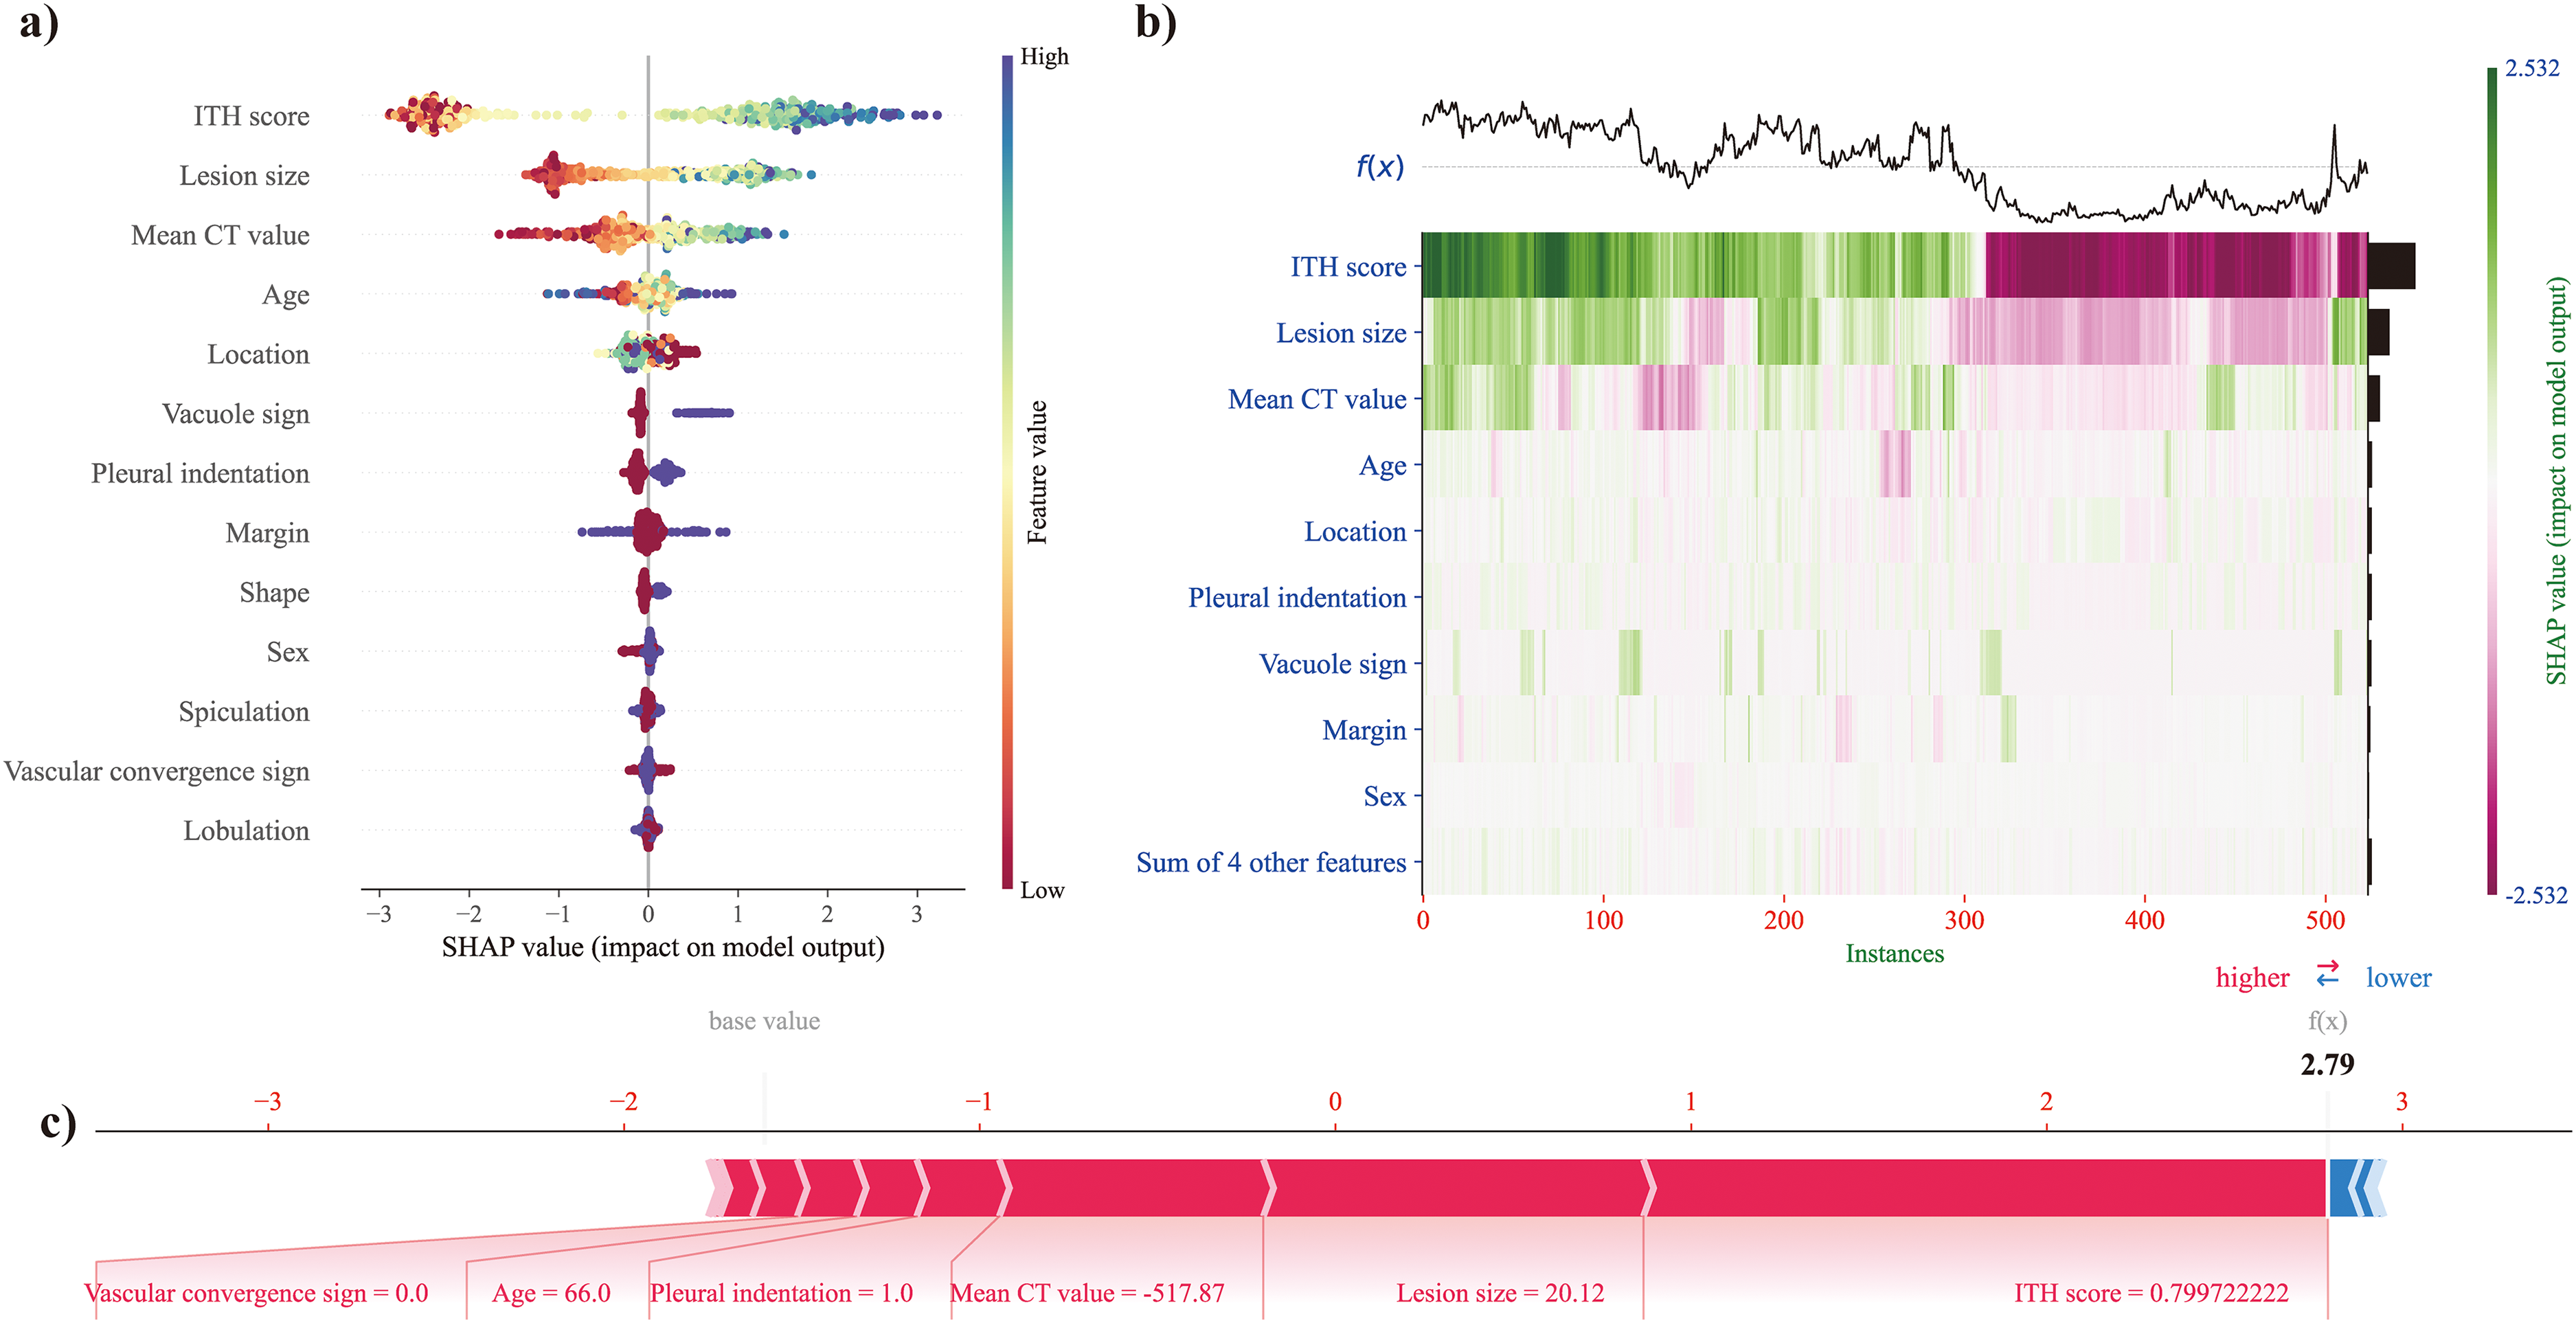
SHAP for model interpretation, including beeswarm plot (a), heatmap (b), and force plot (c).
Figure 5(b) presents a heatmap showing the attributes of the SHAP values using different colored dots. Patients are arranged based on hierarchical clustering according to the similarity of explanations. The output of the ITH-ClinRad-guided CatBoost classifier is displayed above the heatmap matrix, with the gray dashed line denoting the baseline value. The bar chart on the right side of the figure highlights the global importance, reaffirming that the ITH score had the greatest significance, followed by lesion size and mean CT value.
In Figure 5(c), the force plot demonstrates the prediction explanation for a specific instance. Positive and negative impacts are shown in red and blue, respectively. The length of the arrow signifies the magnitude of the feature's impact on the output. It is evident that the highest ITH score (0.800), followed by lesion size (20.12 mm) and mean CT value (–517.87 HU), positively influenced IAC risk in pulmonary adenocarcinomas presenting as pGGNs.
In real-world clinical decision-making, when applying the ITH-ClinRad-guided CatBoost classifier to predict the risk of IAC in pulmonary adenocarcinomas presenting as pGGNs, the classifier integrates ClinRad features such as lesion size and mean CT value, along with the ITH score. As illustrated in Figure 5, for a patient with a persistent pGGN, if the ITH-ClinRad-guided CatBoost classifier predicts a high risk of IAC, the recommended surgical approach would be lobectomy. Conversely, if the classifier predicts a low risk of IAC, the patient would typically undergo segmentectomy or wedge resection, which is often sufficient.
Various diagnostic models for IAC prediction
The ITH-ClinRad-guided CatBoost classifier, ClinRad-guided CatBoost classifier, ITH score, and lesion size were utilized to predict IAC in pulmonary adenocarcinomas presenting as pGGNs. Among these models, conventional lesion size demonstrated the lowest performance with an AUC of 0.826 (95% CI: 0.758–0.894), which is lower than the AUC of 0.846 (95% CI: 0.787–0.905) for the ITH score. Figure 6 illustrates that the ITH-ClinRad-guided CatBoost classifier exhibited the highest performance, followed by the ITH score, ClinRad-guided CatBoost classifier, and lesion size. Detailed performance metrics, including AUC, ACC, SEN, SPE, PPV, and NPV, are presented in Table 3. Subgroup analyses were conducted to further explore the ability of the ITH-ClinRad-guided CatBoost classifier to differentiate between AIS from MIA/IAC. The results are provided in Supplemental Material File 3.
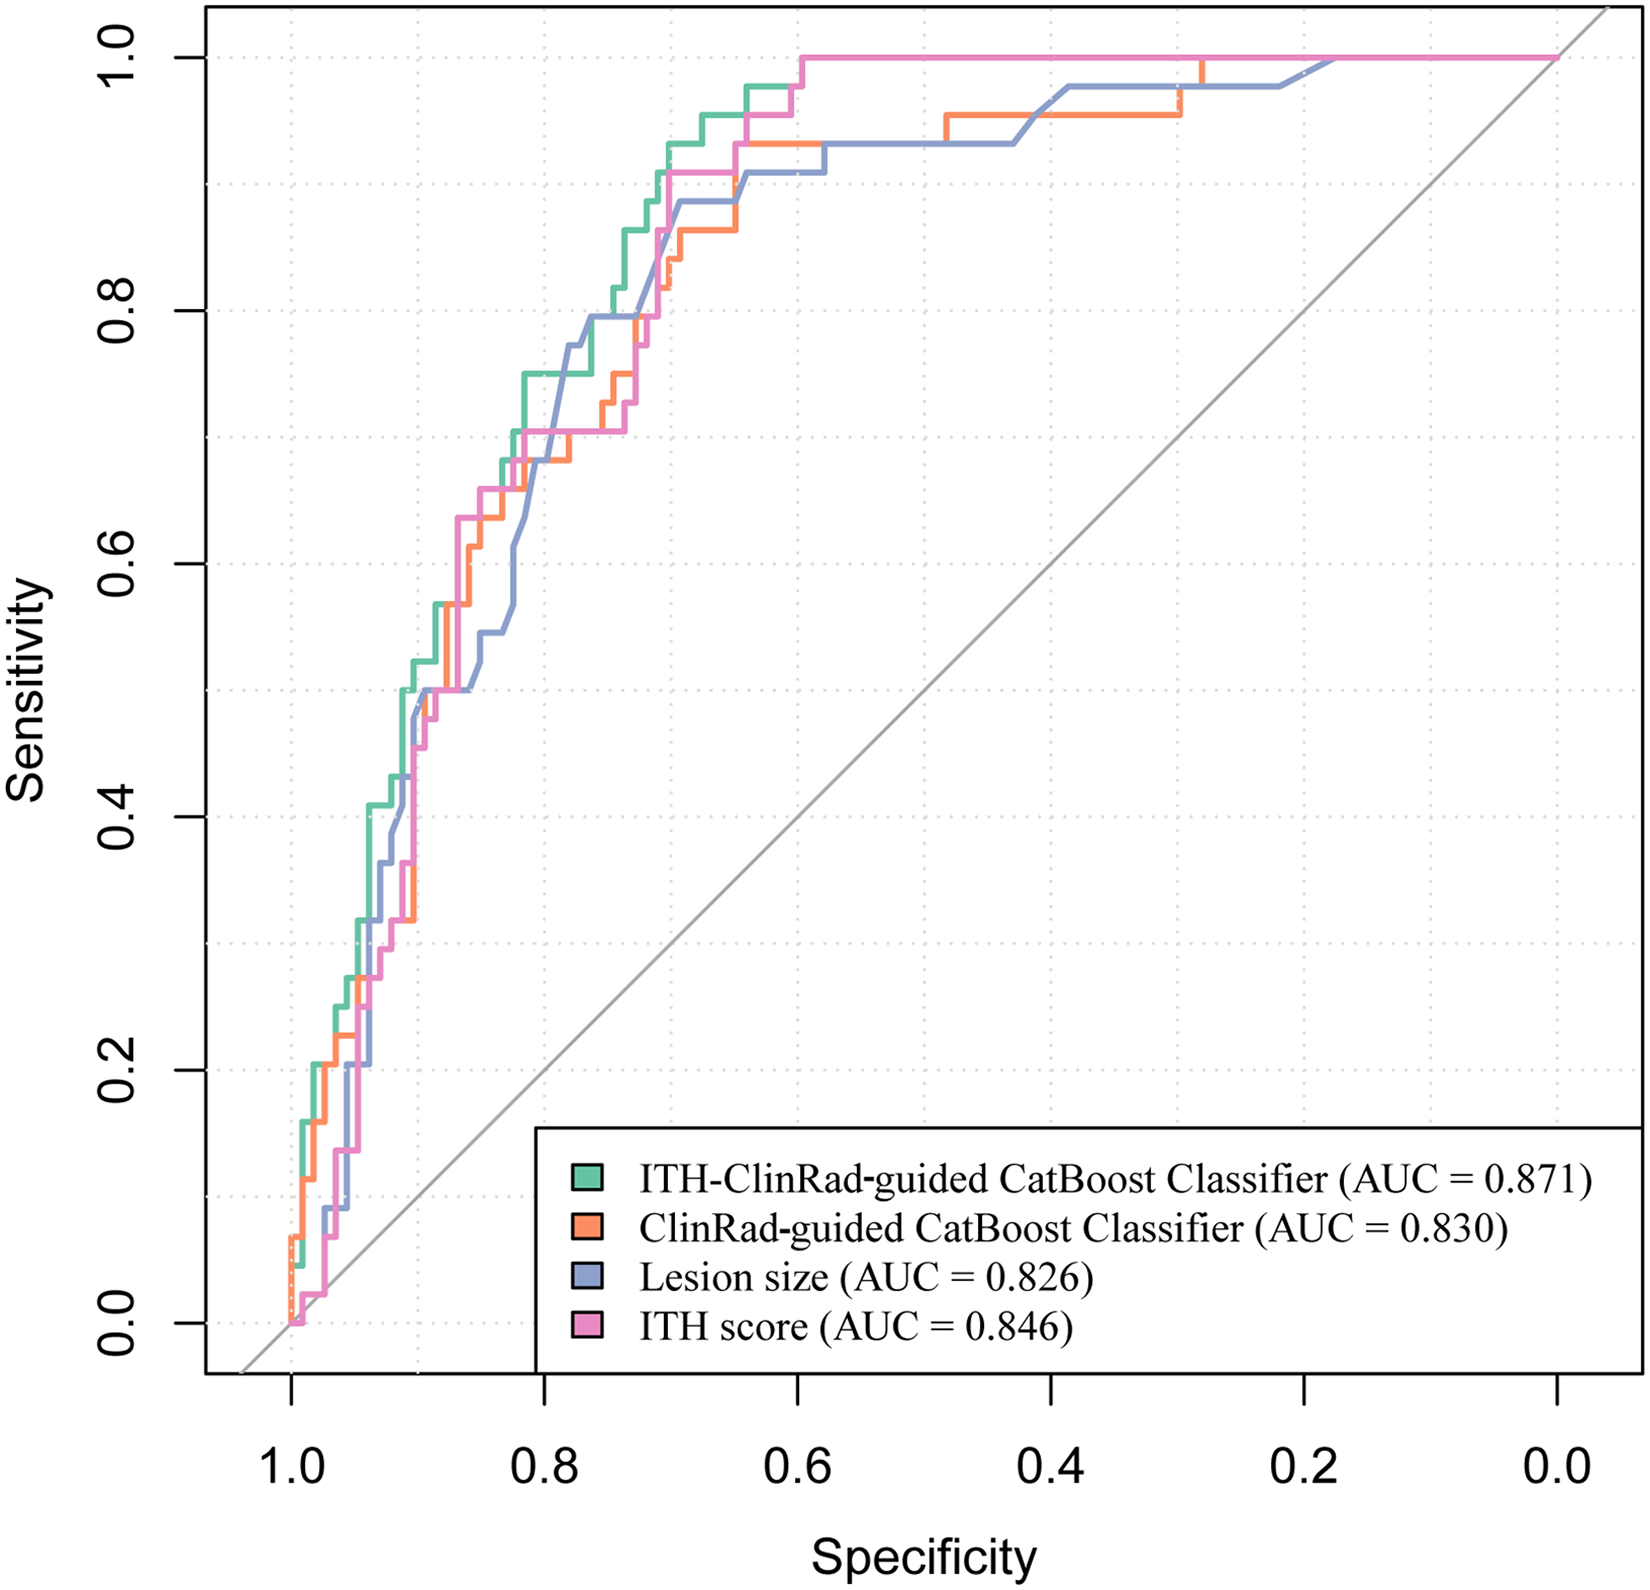
ROC curve across the ITH-clinRad-guided catBoost classifier, ITH score, clinRad-guided catBoost classifier, and lesion size.
Diagnostic efficacy across Various diagnosis approaches.

Abbreviation: AUC, area under the curve; SEN, sensitivity; SPE, specificity; PPV, positive predictive value; NPV, negative predictive value; ClinRad, clinical-radiological features; CatBoost, categorical boosting; ITH, intratumor heterogeneity.
Correlation between ITH score and clinRad
The relationship between ITH score and ClinRad is depicted in a chord diagram (Figure 7(a)) and matrix plot (Figure 7(b)), where dark green signifies a positive correlation and khaki indicates a negative correlation. The intensity of the color or thickness of the line reflects the strength of the correlation. Specifically, the ITH score was positively correlated with various radiographic features associated with the degree of malignancy, such as the mean CT value, lesion size, male sex, pleural indentation, vacuole sign, spiculation, and lobulation.

Correlation between the ITH score and clinRad, including a chord diagram (a) and matrix plot (b).
Discussion
In the current study, we conducted an in-depth exploration by employing 11 supervised machine learning algorithms to merge the ITH score with ClinRad for the preoperative differentiation of IAC from AIS/MIA in pulmonary adenocarcinomas presenting as pGGNs. Among the models, the CatBoost algorithm showed the best performance; therefore, we built an ITH-ClinRad-guided CatBoost classifier for IAC identification, which outperformed the ITH score, ClinRad-guided CatBoost classifier, and lesion size.
Prior investigations have revealed that the degree of invasiveness of pGGNs is predominantly associated with the lesion size rather than ClinRad parameters such as age, margin characteristics, bubble lucency, or pleural indentation.16–19 To enhance the objectivity and fully capture intertumoral heterogeneity, we developed an ITH score that integrates local and global radiomic information, considering both pixel characteristics and their spatial distributions. This represents a significant advancement in the comprehensive capture of multiscale heterogeneity information.23–25 In the current study, the ITH score achieved an AUC of 0.846 (95% CI: 0.787–0.905), outperforming lesion size, which had an AUC of 0.826 (95% CI: 0.758–0.894). Previous studies have used ITH score for prognostic assessment 23 and differentiation of histological subtypes. 25 Zhang et al. further demonstrated that the ITH score surpassed conventional radiomic analysis in distinguishing histological subtypes of clinical T1 stage lung adenocarcinoma presenting as pGGNs. 25 The ITH score, computed by using clustering label maps, assists in reducing variations among images of diverse tumors while maintaining intrinsic heterogeneity within the same tumor. Additionally, the application of unsupervised machine-learning techniques to generate the ITH score offers quantitative data derived from intuitive cluster patterns, effectively addressing potential biases stemming from the intricate reduction of feature dimensionality in radiomic analysis.
The ITH-ClinRad-guided CatBoost classifier integrates the ITH score and ClinRad for IAC identification. CatBoost combines categorical and boosting techniques, analyzes categorical features by calculating category frequencies, and incorporates hyperparameters to generate new numerical features. It utilizes oblivious trees as the base learner with fewer parameters, support for categorical variables, and use of combination categories to exploit feature relationships, thereby significantly enhancing feature dimensionality. By implementing sorted boosting, CatBoost reduces noise in the training process, prevents gradient bias and prediction shift issues, reduces overfitting, and improves the algorithm accuracy and generalization capabilities.30,31
This study investigated the potential of further leveraging the ITH score to enhance the prediction of the invasiveness of adenocarcinomas presenting with pGGNs. When the input variables solely consisted of ClinRad, excluding the ITH score, the ClinRad-guided CatBoost classifier achieved an AUC of 0.830 (95% CI: 0.764–0.896), which was lower than the AUC of 0.871 (95% CI: 0.818–0.924) obtained by the ITH-ClinRad-guided CatBoost classifier. Furthermore, to deepen our understanding of the relationship between the ITH score and ClinRad, we utilized correlation chord diagrams and matrix plots and found that an increased ITH score was associated with various radiographic features of malignancy levels.
This study has several limitations. First, the retrospective nature of the study may have introduced potential selection bias because the analysis was limited to patients with accessible postoperative pathological findings. Second, the calculation of the ITH score can be enhanced further by considering the entire tumor volume rather than relying solely on the most extensive CT slice. Finally, the findings indicate a correlation between the ITH score and invasiveness of lung adenocarcinoma presenting as pGGNs. Exploring the broad clinical applications of the ITH score, including its significance in selecting surgical plans, predicting patient outcomes, and potentially generalizing it across different cancer types could provide valuable insights.
In conclusion, this study focused on the preoperative prediction of the invasiveness of pulmonary adenocarcinomas presenting as pGGNs with promising results. The ITH-ClinRad-guided CatBoost classifier, ClinRad-guided CatBoost classifier, ITH score, and lesion size exhibited satisfactory performances in predicting IAC in pulmonary adenocarcinomas with pGGNs. Notably, the ITH-ClinRad-guided CatBoost classifier, which combines the ITH score and ClinRad using the CatBoost algorithm, may potentially aid physicians in formulating comprehensive treatment strategies.
Supplemental Material
sj-docx-1-dhj-10.1177_20552076241289181 - Supplemental material for Enhancing the prediction of the invasiveness of pulmonary adenocarcinomas presenting as pure ground-glass nodules: Integrating intratumor heterogeneity score with clinical-radiological features via machine learning in a multicenter study
Supplemental material, sj-docx-1-dhj-10.1177_20552076241289181 for Enhancing the prediction of the invasiveness of pulmonary adenocarcinomas presenting as pure ground-glass nodules: Integrating intratumor heterogeneity score with clinical-radiological features via machine learning in a multicenter study by Hong Zheng, Wei Chen, Wanyin Qi, Haibo Liu and Zhichao Zuo in DIGITAL HEALTH
Supplemental Material
sj-docx-2-dhj-10.1177_20552076241289181 - Supplemental material for Enhancing the prediction of the invasiveness of pulmonary adenocarcinomas presenting as pure ground-glass nodules: Integrating intratumor heterogeneity score with clinical-radiological features via machine learning in a multicenter study
Supplemental material, sj-docx-2-dhj-10.1177_20552076241289181 for Enhancing the prediction of the invasiveness of pulmonary adenocarcinomas presenting as pure ground-glass nodules: Integrating intratumor heterogeneity score with clinical-radiological features via machine learning in a multicenter study by Hong Zheng, Wei Chen, Wanyin Qi, Haibo Liu and Zhichao Zuo in DIGITAL HEALTH
Supplemental Material
sj-docx-3-dhj-10.1177_20552076241289181 - Supplemental material for Enhancing the prediction of the invasiveness of pulmonary adenocarcinomas presenting as pure ground-glass nodules: Integrating intratumor heterogeneity score with clinical-radiological features via machine learning in a multicenter study
Supplemental material, sj-docx-3-dhj-10.1177_20552076241289181 for Enhancing the prediction of the invasiveness of pulmonary adenocarcinomas presenting as pure ground-glass nodules: Integrating intratumor heterogeneity score with clinical-radiological features via machine learning in a multicenter study by Hong Zheng, Wei Chen, Wanyin Qi, Haibo Liu and Zhichao Zuo in DIGITAL HEALTH
Supplemental Material
sj-docx-4-dhj-10.1177_20552076241289181 - Supplemental material for Enhancing the prediction of the invasiveness of pulmonary adenocarcinomas presenting as pure ground-glass nodules: Integrating intratumor heterogeneity score with clinical-radiological features via machine learning in a multicenter study
Supplemental material, sj-docx-4-dhj-10.1177_20552076241289181 for Enhancing the prediction of the invasiveness of pulmonary adenocarcinomas presenting as pure ground-glass nodules: Integrating intratumor heterogeneity score with clinical-radiological features via machine learning in a multicenter study by Hong Zheng, Wei Chen, Wanyin Qi, Haibo Liu and Zhichao Zuo in DIGITAL HEALTH
Footnotes
Acknowledgments
We would like to extend our sincere appreciation to Editage for their meticulous language editing services, which have significantly enhanced the quality and readability of this manuscript.
Contributorship
(I) Conception and design: Hong Zheng, Zhichao Zuo; (II) Administrative support: Wei Chen, Zhichao Zuo; (III) Provision of study materials or patients: Hong Zheng, Wanyin Qi, Haibo Liu; (IV) Collection and assembly of data: Wanyin Qi, Haibo Liu; (V) Data analysis and interpretation: Hong Zheng, Zhichao Zuo; (VI) Manuscript writing: All authors; (VII) Final approval of manuscript: All authors
Consent to participate
Given the retrospective nature of the study, the requirement for written informed consent was waived.
Consent for publication
Not applicable.
Data availability
The data for this study are available by contacting the corresponding author upon reasonable request.
Declaration of conflicting interests
The authors declared no potential conflicts of interest with respect to the research, authorship, and/or publication of this article.
Ethical approval
Ethical approval for this multicenter population-registry cancer study was obtained from the institutional ethics committees of the participating institutions (project approval number: No. 2021-07-009, No. KY2020147).
Funding
The authors disclosed receipt of the following financial support for the research, authorship, and/or publication of this article: This work was supported by Scientific Research Project of Hunan Provincial Health Commission, Changsha, China (Grant Number: B202309017964).
Guarantor
Wei Chen(weichen.work@hotmail.com)
Supplemental material
Supplemental material for this article is available online.
References
Supplementary Material
Please find the following supplemental material available below.
For Open Access articles published under a Creative Commons License, all supplemental material carries the same license as the article it is associated with.
For non-Open Access articles published, all supplemental material carries a non-exclusive license, and permission requests for re-use of supplemental material or any part of supplemental material shall be sent directly to the copyright owner as specified in the copyright notice associated with the article.