
Abstract
Objective
To develop an attention-based convolutional neural network (CNN) pipeline for early prediction of pathological complete response (pCR) to neoadjuvant chemotherapy (NAC) in breast cancer, improving feature selection and interpretability in whole slide image (WSI) analysis.
Methods
A retrospective analysis was conducted on 384,076 tiles extracted from 122 Hematoxylin and Eosin-stained WSIs, divided among an investigational cohort (IC, 82 patients enrolled at IRCCS Istituto Tumori “Giovanni Paolo II”), a validation cohort (VC, 20 patients, same Institution), and an external validation cohort (EVC, 20 patients belonging the Yale trastuzumab response cohort public dataset). WSIs were first annotated and then automatically segmented into tiles. Noninformative regions were filtered using Mini-Batch C-Fuzzy K-Means. Remaining tiles were analyzed using a CNN with a Convolutional Block Attention Module, prioritizing both histological features and tiles critical for predicting pCR.
Results
The model achieved robust performance: 81.4% AUC, 81.3% accuracy, 80.0% specificity, and 83.3% sensitivity in IC; 80.9% AUC, 80.0% accuracy, 85.78% specificity, and 66.7% sensitivity in VC; and 76.2% AUC, 70.0% accuracy, 71.4% specificity, and 66.7% sensitivity in EVC. The EVC, consisting of WSIs at 20× magnification compared to the 40× magnification of IC and VC, demonstrated the model's robustness to varying resolutions.
Conclusion
This is an innovative pipeline that not only improves prediction but also enhances the clinical utility of digital pathology.
Keywords
Introduction
Neoadjuvant chemotherapy (NAC), administered before surgery, plays a crucial role in the management of breast cancer by shrinking tumors to facilitate less invasive surgical options and improve overall outcomes.1,2 The effectiveness of NAC varies among the molecular subtypes: HER2-positive and triple-negative breast cancers typically respond more favorably to NAC, often achieving a higher rate of pathological complete response (pCR), 3 which is defined as the absence of detectable invasive cancer in the breast and lymph nodes after chemotherapy. It is a pivotal indicator of long-term prognosis, including survival rates and reduced risk of recurrence. 4 The ability to accurately predict pCR before completing the NAC regimen offers transformative potential in clinical decision-making. By identifying patients unlikely to achieve pCR early, clinicians can adapt treatment strategies in real-time, optimizing therapy regimens, and potentially sparing patients from unnecessary toxicity. 5
Early prediction of pCR can be achieved through advanced imaging techniques, including radiological exams such as MRI and PET scans, along with molecular biomarkers identified in digital pathology images. Digital pathology, a revolutionary approach in the field of pathology, leverages digital imaging and advanced computing techniques to transform traditional slide-based analyses into high-resolution, easily accessible digital formats, known as whole slide images (WSIs). 6 Within the breast cancer research field, digital pathology provides a powerful platform for examining biopsies, enabling detailed and automatized morphometric analyses and facilitating comprehensive tissue assessments. 7 Specifically, predicting pCR by analyzing digitized biopsies offers several compelling advantages over traditional imaging methods like MRI,8–10 and PET scans. 11 Indeed, WSIs provide a detailed view of tumor tissue at the microscopic level. This high-resolution analysis allows pathologists to closely examine cellular and molecular features of the tumor, such as cellularity and the presence of any residual tumor cells. This level of detail often surpasses what could be discerned from MRI or PET images, which tend to offer a more general view of the size and location of the tumor. The implementation of digital pathology in clinical workflows promises to complement existing diagnostic modalities, leveraging routinely collected biopsy samples to improve the precision of NAC outcome prediction. Moreover, unlike MRI and PET scans, which may require repeated exams and lead to significant additional financial expenses, biopsy is a standard part of clinical practice in NAC management. As such, analyzing digitized biopsies does not introduce extra costs for the patient, making it a cost-effective alternative for early pCR prediction.
In recent years, the integration of artificial intelligence (AI) into digital pathology has opened new frontiers in cancer diagnostics and prognostics.12,13 Beyond histopathological image analysis, machine learning frameworks have also been successfully applied to multiomics and spatial data for biomarker discovery in breast cancer, demonstrating the potential of integrating molecular and spatial information to predict clinical outcomes.14,15 Particularly, convolutional neural networks (CNNs) have demonstrated remarkable capabilities in analyzing complex medical images, identifying subtle patterns, and extracting quantitative features that might be overlooked by the human eye due to their ability to learn hierarchical feature representations from raw input data. 16 These capabilities are especially valuable in the context of breast cancer treatment, where an early prediction of pCR to NAC (before the beginning of NAC itself) could significantly impact clinical decision-making and patient outcomes.
However, using CNNs for WSIs has two main limitations, despite the promising advancements and potential they offer in this framework. Beyond the high computational cost required to process WSIs and the resulting small crops, i.e. tiles, in which they are usually divided, there are also inherent challenges related to the structure of traditional CNNs: these networks often struggle to effectively highlight and leverage the most critical features within an image.
Within this emerging scenario, to address these limitations, we propose a novel AI-based pipeline that integrates unsupervised clustering to discard non-informative tiles and incorporates an attention-enhanced CNN to prioritize relevant regions for pCR prediction. This dual approach improves computational efficiency while enhancing the model's ability to focus on key features. We validated our pipeline using Hematoxylin and Eosin (H&E) stained biopsy images from three distinct cohorts: an Investigational Cohort (IC) of 82 breast cancer patients treated with NAC at our institute (2018–2022), a Validation Cohort (VC) of 20 patients (2023–2024), and an external validation cohort (EVC) of 20 patients from the Yale trastuzumab response dataset (YTRC).17,18 By including slides with varying magnifications (20× and 40×), we evaluated the generalizability of our model across diverse clinical settings. This proposal not only holds promise for advancing breast cancer research but also sets the stage for clinical applications, where scalable, efficient, and interpretable AI systems can provide actionable insights to inform treatment decisions.
Materials and methods
Data collection
This retrospective study received approval from the Scientific Board of the Istituto Tumori “Giovanni Paolo II” in Bari, Italy (Prot. 1168/CE). The primary analysis included H&E slides from an IC of 82 breast cancer patients who received NAC at the institute between 2018 and 2022. Additionally, a VC of 20 breast cancer patients who also underwent NAC at the same institution between 2023 and 2024 was analyzed. Table 1 provides an overview of the clinical characteristics for both the IC and VC, dividing patients into two groups: those who achieved a pathological complete response (pCR class, 40.2% and 30%, respectively) and those who did not (non-pCR group, 59.8% and 70%, respectively). Pathological complete response was defined by the absence of residual invasive disease or metastatic lymph nodes at the end of chemotherapy and postsurgery, based on the examination of the surgical specimen. Estrogen receptor (ER, Clone EP1 DAKO) and progesterone receptor (PgR, Clone PgR636) statuses were classified as negative (0%) or positive (≥1%). Ki67 (Clone MIB1 DAKO) was recorded as a percentage. HER2 status (polyclonal Rabbit Anti-Human c-erb 2 Oncoprotein) was evaluated following ASCO-CAP guidelines, and tumor grading was assessed using the Elston Classification. Inclusion criteria comprised patients with histologically confirmed unilateral invasive breast carcinoma who underwent NAC, while those with metastatic disease or bilateral tumors were excluded.
Clinical characteristics of the investigational and validation cohorts.

Note: Absolute and percentage counts are reported (percentage counts in round brackets). For age and Ki67, the median value and first (q1) and third (q3) quartiles of the distribution are indicated in squared brackets.
We further assessed our model on an EVC of 20 patients selected from the YTRC, a public dataset containing digitized 20× magnification slides from patients who underwent NAC. 17 The YTRC includes 85 HER2-positive breast cancer patients who received trastuzumab, with or without pertuzumab, prior to definitive surgery. For the validation of our model, we selected a subset of 20 patients with a pCR to non-pCR ratio aligned with the VC (30% pCR class, 70% non-pCR class). Although this validation cohort consists only of HER2-positive cases and includes images obtained at a fixed 20× magnification, it was used to evaluate the model's generalizability under these specific conditions. Clinical characteristics of the EVC are summarized in Table 2.
Clinical characteristics of the external validation cohort.

Note: Absolute and percentage counts are reported (percentage counts in round brackets). For age and Ki67, the median value and first (q1) and third (q3) quartiles of the distribution are indicated in squared brackets.
Workflow of the proposed model
The proposed model aims to distinguish between two classes of breast cancer patients based on their response to NAC: those who achieve the response (pCR class) and those who did not (non-pCR). The workflow of this model is depicted in Figure 1 and organized into several key steps, as outlined below.

Workflow of the proposed analysis pipeline. (A) Image preprocessing: digital slides were acquired at 40× (IC/VC) and 20× (EVC) magnification, and regions of interest (ROIs) were manually identified by an expert pathologist. Each ROI was divided into tiles of 200 × 200 pixels corresponding to a 50 µm × 50 µm tissue area, followed by color normalization using the Macenko method. (B) Selection of significant tiles: noninformative tiles were filtered through a quality-based standard deviation thresholding strategy, yielding 287,782 (IC), 48,425 (VC), and 47,869 (EVC) valid tiles. (C) Learning model: filtered and resized tiles were processed using the CBAM-ResNet101 architecture to extract discriminative histological features. Tile-level predictions were aggregated via attention-weighted scoring to produce patient-level pCR outcomes.
Image preprocessing
Digital slides of biopsies from breast cancer patients belonging to IC and VC were acquired using a high-resolution scanner at 40× magnification (Aperio AT2, Leica Biosystems). The slides related to EVC were acquired at 20× using a Vectra Polaris, Perkin-Elmer scanner, as reported in the public dataset description. 17 An expert pathologist of our Institute identified relevant some Regions of Interest (ROIs) within each slide discarding any possible artifact due to slide staining and scanning. Due to the large size of the digitized slides, preprocessing was required to manage computational burden. Each ROI was divided into smaller 200 × 200-pixel tiles using QuPath software, 19 ensuring optimal input size for further analysis. To ensure spatial consistency across datasets acquired at different magnifications (40× and 20×), tile extraction was standardized according to physical dimensions rather than pixel count. Each tile corresponded to a 50 µm × 50 µm tissue region, resulting in tiles of 200 × 200 pixels at 40× and 100 × 100 pixels at 20× magnification. All extracted tiles were standardized using the widely adopted Macenko color normalization 20 to correct for staining differences. Tiles were filtered to retain only those that met specific size (squared) and quality criteria, with a final tile count of 287782, 48425, and 47869 for IC, VC and EVC, respectively. The quality criteria were designed to exclude tiles containing a significant portion of background. Specifically, for each patient, a quarter of the tiles were selected for an initial standard deviation computation. For each selected tile, we considered pixels with intensity values between the first and third quartile. The standard deviation was then calculated for the remaining pixels. As a threshold value, we chose the first quartile of all the computed standard deviations. Finally, we selected the tiles that met the pixel selection criteria and had a standard deviation greater than the threshold value.
Selection of significant tiles
To analyze WSIs, quantitative features were extracted from the retained tiles using a pretrained CNN, ResNet101. This deep architecture, consisting of 101 layers, employs residual connections to capture detailed feature representations across complex data. Tiles were resized to 224 × 224 pixels, the input dimension required by ResNet101, 21 and each tile's final output included 2048 features from the last frozen layer, representing high-level visual attributes critical for classification. We used the extracted features to find patterns in our data in an unsupervised manner. Specifically, we applied a Mini-Batch C-Fuzzy K-Means clustering algorithm, 22 which is an extension of the standard C-Fuzzy K-Means algorithm designed to improve efficiency and scalability. It processes the data in small, randomly selected subsets (mini batches) rather than the entire dataset at once. It initializes the cluster centers and membership matrices and iteratively updates them using randomly selected mini batches of the data. In summary, Mini-Batch C-Fuzzy K-Means combines the benefits of fuzzy clustering with the efficiency of mini-batch processing, making it a powerful tool for clustering large and complex datasets. Among the parameters required by the procedure, we set the fuzziness factor to 4 and the batch size to 2500. The fuzziness factor was empirically determined after preliminary experiments with values ranging from 2 to 5, as this range yielded stable clustering behavior and effectively filtered out noninformative tiles.
To determine the optimal number of clusters, we applied the well-known elbow method. 23 The elbow method involves the computation of the sum of the square distance between points in a cluster and the cluster centroid (or within-cluster sum of squares) against the number of clusters and looking for an “elbow” point, where the rate of decrease in the explained variance slows down significantly. The idea is that the optimal number of clusters corresponds to the point where adding more clusters does not provide a substantial improvement in the clustering quality. By calculating this for a range of cluster numbers, from two to ten, we identified the number of clusters that led to the most significant change in the variance explained, which was considered the optimal number. Then, we used it to implement another Mini-Batch C-Fuzzy K-Means clustering algorithm with the same hyperparameters set before. This algorithm returned the so-called membership matrix, that is a matrix indicates the degree to which each data point belongs to each cluster. Each row corresponds to a data point, and each column corresponds to a cluster. The values in the matrix represent membership probabilities or degrees (normalized), indicating how likely each data point belongs to each cluster. Finally, each data point is assigned to the cluster where it has the highest membership value. Unsupervised clustering was performed on IC and then applied to both VC and EVC. For these validation cohorts, each tile was assigned to the clusters previously identified using the data of IC.
We analyzed the obtained clusters to identify the most important features as potential earlier indicators of pCR. The statistical significance of the ith feature 
Learning model
The core of the prediction model is a CNN integrated with a Convolutional Block Attention Module (CBAM), which refines feature maps by focusing on both the most relevant channels and spatial regions.
Recently, CBAM architecture has been developed as a powerful mechanism to enhance CNNs’ performance by integrating attention mechanisms. 25 CBAM integrates seamlessly into existing CNN architectures and operates by sequentially applying channel and spatial attention modules to the feature maps. On the one hand, the channel attention module focuses on emphasizing important channels, thereby enhancing the network's sensitivity to the most informative features. On the other hand, the spatial attention module addresses the spatial dimension of the feature maps. Hence, this dual attention mechanism ensures that the network not only focuses on the most relevant features across channels but also on the most pertinent spatial locations within the input images.
Basically, we integrated CBAM into ResNet101 to enhance the ability of the network to capture and utilize relevant features more effectively: the attention modules were inserted into the residual blocks to refine feature maps by focusing on both channel-wise and spatial-wise important aspects. Specifically, CBAM was placed after the residual addition operation in each block, right before the final output of the block is passed to the next layer.
For each residual block in ResNet101, CBAM first applied the channel attention module (CAM). The feature map output from the residual block was processed to generate channel attention weights, which emphasize important channels. CAM was computed using global average pooling and global max pooling, followed by a shared multilayer perceptron (MLP) to produce a channel-wise attention map. This map scaled the feature map, focusing on the most informative channels. After CAM application, CBAM then computed the spatial attention module (SAM) to highlight crucial spatial regions. SAM was computed using average pooling and max pooling along the channel dimension to generate spatial context descriptors. These descriptors were concatenated and passed through a convolutional layer to produce a spatial attention map, which was used to scale the feature map and focus on important spatial areas. The resulting feature map of each residual block, after applying both channel and spatial attention via CBAM, was more discriminative and focused on relevant features. This refined feature map was then passed to the subsequent layers in ResNet101.
To evaluate the effectiveness of CBAM integration, we trained and compared the modified ResNet101 model (abbr. CBAM-net) against two competing baseline models: the standard ResNet101 with transfer learning (abbr. TL-net) and ResNet101 without CBAM or transfer learning (abbr. Original-net). Both baseline models served as control setups to assess the specific impact of CBAM on feature refinement and overall model performance.
Early stopping was implemented to force training to stop when no improvement was observed in the monitored metric for 10 consecutive epochs. The networks were trained by setting 32 as batch size and 100 as maximum number of epochs, with binary cross-entropy as loss function. As optimizer for the weights of the network, Adam optimization algorithm with a starting learning rate of 10–6 was performed. To overcome overfitting during the training phase, data augmentation was implemented. It included horizontal flipping to learn object orientation variations, and width/height shifts to introduce random translations within the image, helping the model generalize better. The fill mode was set to ‘nearest’ to fill gaps created by transformations, avoiding artifacts. The implementation codes were written in Python 3.9.19 with Tensorflow-keras and run using servers equipped with an NVIDIA GPU H100 PCIe 80 GB.
Statistical analysis
The patients of IC were split in training and test sets in turn according to a 5-fold cross-validation scheme. The splitting was stratified with respect to the label (pCR vs non-pCR). All the tiles associated to one patient were part either of the training set or the test set depending on whether the patient was assigned to the training set or the test set, respectively.
We evaluated the predictive performances of the learning model (CBAM-net) at patient level. The network returned the prediction for each tile corresponding to one patient (prediction at tile level). We proposed a method to obtain a single classification score 
For the sake of a fair comparison, for the competing models (TL-net and Original-NET), we used a simple unweighted mean of the scores 
The predictive performances were evaluated in terms of AUC, and after calculating the optimal threshold using Youden's index,
26
accuracy, specificity, sensitivity and G-mean (
All the models were further validated on VC and EVC. This validation process allowed for the assessment of model variability and performance consistency across different sets of data, providing a more comprehensive evaluation of the model's generalizability. Finally, the bootstrap paired t-test was specifically chosen to compare the AUC values of the proposed model with those of competing models across the three cohorts, as it offers a robust statistical approach suited for addressing the limitations imposed by the dataset size. 28 This analysis was performed over 50 iterations to ensure the stability of the results. Statistical significance was determined by a p-value less than 0.05.
Explainability
To ensure transparency in model predictions, an explainability technique, well known as Grad-CAM (Gradient-weighted Class Activation Mapping) was implemented. 29 It computes the gradient of the class score (the output of interest, such as the score for a specific class) with respect to the feature maps of a convolutional layer. These gradients indicate the importance of each neuron in the feature maps for the given class. The computed gradients are used to weight the feature maps. The weighted feature maps are then combined to produce a heatmap identifying areas of the input image that were most relevant for classification.
Results
Clustering and significant feature analysis
The application of the Elbow method determined that the optimal number of clusters for IC was two. This approach showed a clear elbow point in the explained variance curve, where adding more clusters did not result in significant improvements in clustering quality, as shown in Figure 2.

Within-cluster sum of squares versus number of clusters computed using the Elbow Method. The red dot indicates the elbow point corresponding to the selected k = 2, representing the balance between intracluster compactness and intercluster separation.
Subsequently, the implementation of the Mini-Batch C-Fuzzy K-Means clustering algorithm identified the tiles belonging to the two clusters. In Figure 3, the boxplots illustrate the distribution of the number of tiles per patient belonging to IC across the two identified clusters. To statistically compare these distributions, we applied the Wilcoxon signed-rank test for paired samples, obtaining a p-value = 0.16. This result confirms that the clustering process was not influenced by the quantity of tile representation per patient. Instead, the clustering likely relied on intrinsic features of the tiles, such as morphological or histological characteristics.

Boxplots showing the distribution of the percentage number of tiles per patient across the two identified clusters.
This ensures that the clustering reflects biologically or clinically relevant patterns rather than being driven by variations in tile counts across patients. As proof of concept, Cluster 1 predominantly contained tiles with fewer cells and a higher proportion of tissue, while Cluster 2 exhibited a greater cellular density. These findings were consistent across the different cohorts, suggesting the robustness of the model in identifying similar patterns across diverse cohorts, as illustrated in Figure 4, which shows representative tile examples for each cluster across the three cohorts. Tiles with fewer cells and a higher proportion of tissue, while Cluster 2 exhibited a greater cellular density.

Examples of tiles identified to belong to Cluster 1, including tiles with higher proportion of tissue, and Cluster 2, collecting tiles with a greater cellular density, for (A) investigational cohort, (B) validation cohort, and (C) external validation cohort, respectively.
Among the two clusters, Cluster 2 proved to be the most significant in the IC, strongly correlating with the outcome, i.e., the achievement or not of pCR. This is because, while for Cluster 1 no feature was found to have a significant DP, for Cluster 2, 42 features were found to be significant: an amount 19 features were identified for AUC values greater than 0.6, whereas a total of 22 features were selected with AUC values greater than 0.6).
The DP values for these 42 features are presented in Figure 5, highlighting their potential to be earlier indicator of pCR achievement. Finally, the high score tiles identified as described in Methods section were 74890, 14904, and 27721 in total for IC, VC, EVC, respectively.

Features identified to be significant for Cluster 1 and Cluster 2, according to the computation of their DP values and specifically max (AUC, 1-AUC).
The features used in our analysis were extracted from the layer immediately preceding the classification layer of the given pre-trained CNN architecture. A direct understanding of which image portion these features represent is made non-trivial due to the complex non-linear operations computed within the network architecture. We provided a visual cue of the features selected as the most important features on the activation map to which they belong. For the sake of a clear visualization, we generated heatmaps from the activations, which were further overlayed on the input image. Red color highlights the most informative areas of the image. Figure 6A-B illustrate examples of tiles from class 1 and class 0. Alongside the original tiles displayed in the left panels, the central and right panels present heatmaps corresponding to features selected based on high DP values, specifically those with max(AUC) and max(1-AUC), respectively. While all heatmaps highlight significant areas containing infiltrate or tumor cells, complementary regions of activation between the different types of heatmaps emerge. This phenomenon can be explained by the intrinsic nature of AUC and 1-AUC. Features with high AUC values are particularly effective at identifying patterns characteristic of class 1 (pCR class), while those with high 1-AUC values emphasize patterns more relevant for distinguishing class 0 (non-pCR class). Such complementary activation patterns may also reflect distinct biological or morphological characteristics associated with the two classes, which the model has learned to separate.

Examples of tiles from (A) pCR class and (B) non-pCR class, alongside heatmaps highlighting significant features. In the central panel, heatmaps correspond to features selected based on high DP values, specifically those with max(AUC), while in the right panel, heatmaps represent features with max(1-AUC). Complementary regions of activation between panels (A) and (B) emerge.
Classification results
The proposed model, CBAM-net, outperformed TL-net and Original-net across the three cohorts, IC, VC and EVC, as detailed in Table 3.
Performance evaluation of the CBAM-net and the competing models, TL-net and Original-net, on investigational cohort (IC), validation cohort (VC) and external validation cohort (EVC).

Note: The metric values for the IC cohort are expressed as median values and InterQuartile Ranges (IQRs) according to the evaluation using a cross-validation scheme. Additionally, the results of the bootstrap paired t-test are reported, with statistical significance indicated by * for p-value < .05 and ° for p-value > .05. CBAM: Convolutional Block Attention Module.
In the IC, CBAM-Net achieved a median AUC of 81.4% [80.4–85.3%], an accuracy of 81.3% [81.0–82.1%], and a G-mean of 81.7% [78.5–82.5%], surpassing TL-Net and Original-Net, particularly in sensitivity (83.3% [70.8–85.1%] compared to 57.1% [51.8–76.8%] for TL-net and 71.4% [62.5–80.4%] for Original-net). All three models shared the same median specificity of 80.0%, pointing out the consistent ability of each model to correctly identify negative cases in the IC dataset.
In the VC, CBAM-net maintained superior performance with an AUC of 80.9%, accuracy of 80.0%, and a G-mean of 75.6%, outperforming TL-net (66.7% AUC, 65.0% accuracy) and Original-net (77.3% AUC, 70.0% accuracy).
In the EVC, which presented images at a lower magnification (20×), CBAM-net performance was still higher with an AUC of 76.2%, accuracy of 70.0%, and a G-mean of 69.0%, exceeding TL-net and Original-net in sensitivity (66.7% vs. 50.0% and 33.3%, respectively). While specificity decreased slightly for CBAM-Net in the EVC (71.4%), its stable sensitivity across VC and EVC highlights its ability to adapt to variations in image magnification. These results are supported by the visualization in the receiver operating characteristic (ROC) curves, as shown in Figure 7. The bootstrap paired t-test results supported the robustness of CBAM-net's performance, showing statistically significant improvements (p-value < .05, marked as *) over TL-net and Original-net in most comparisons.
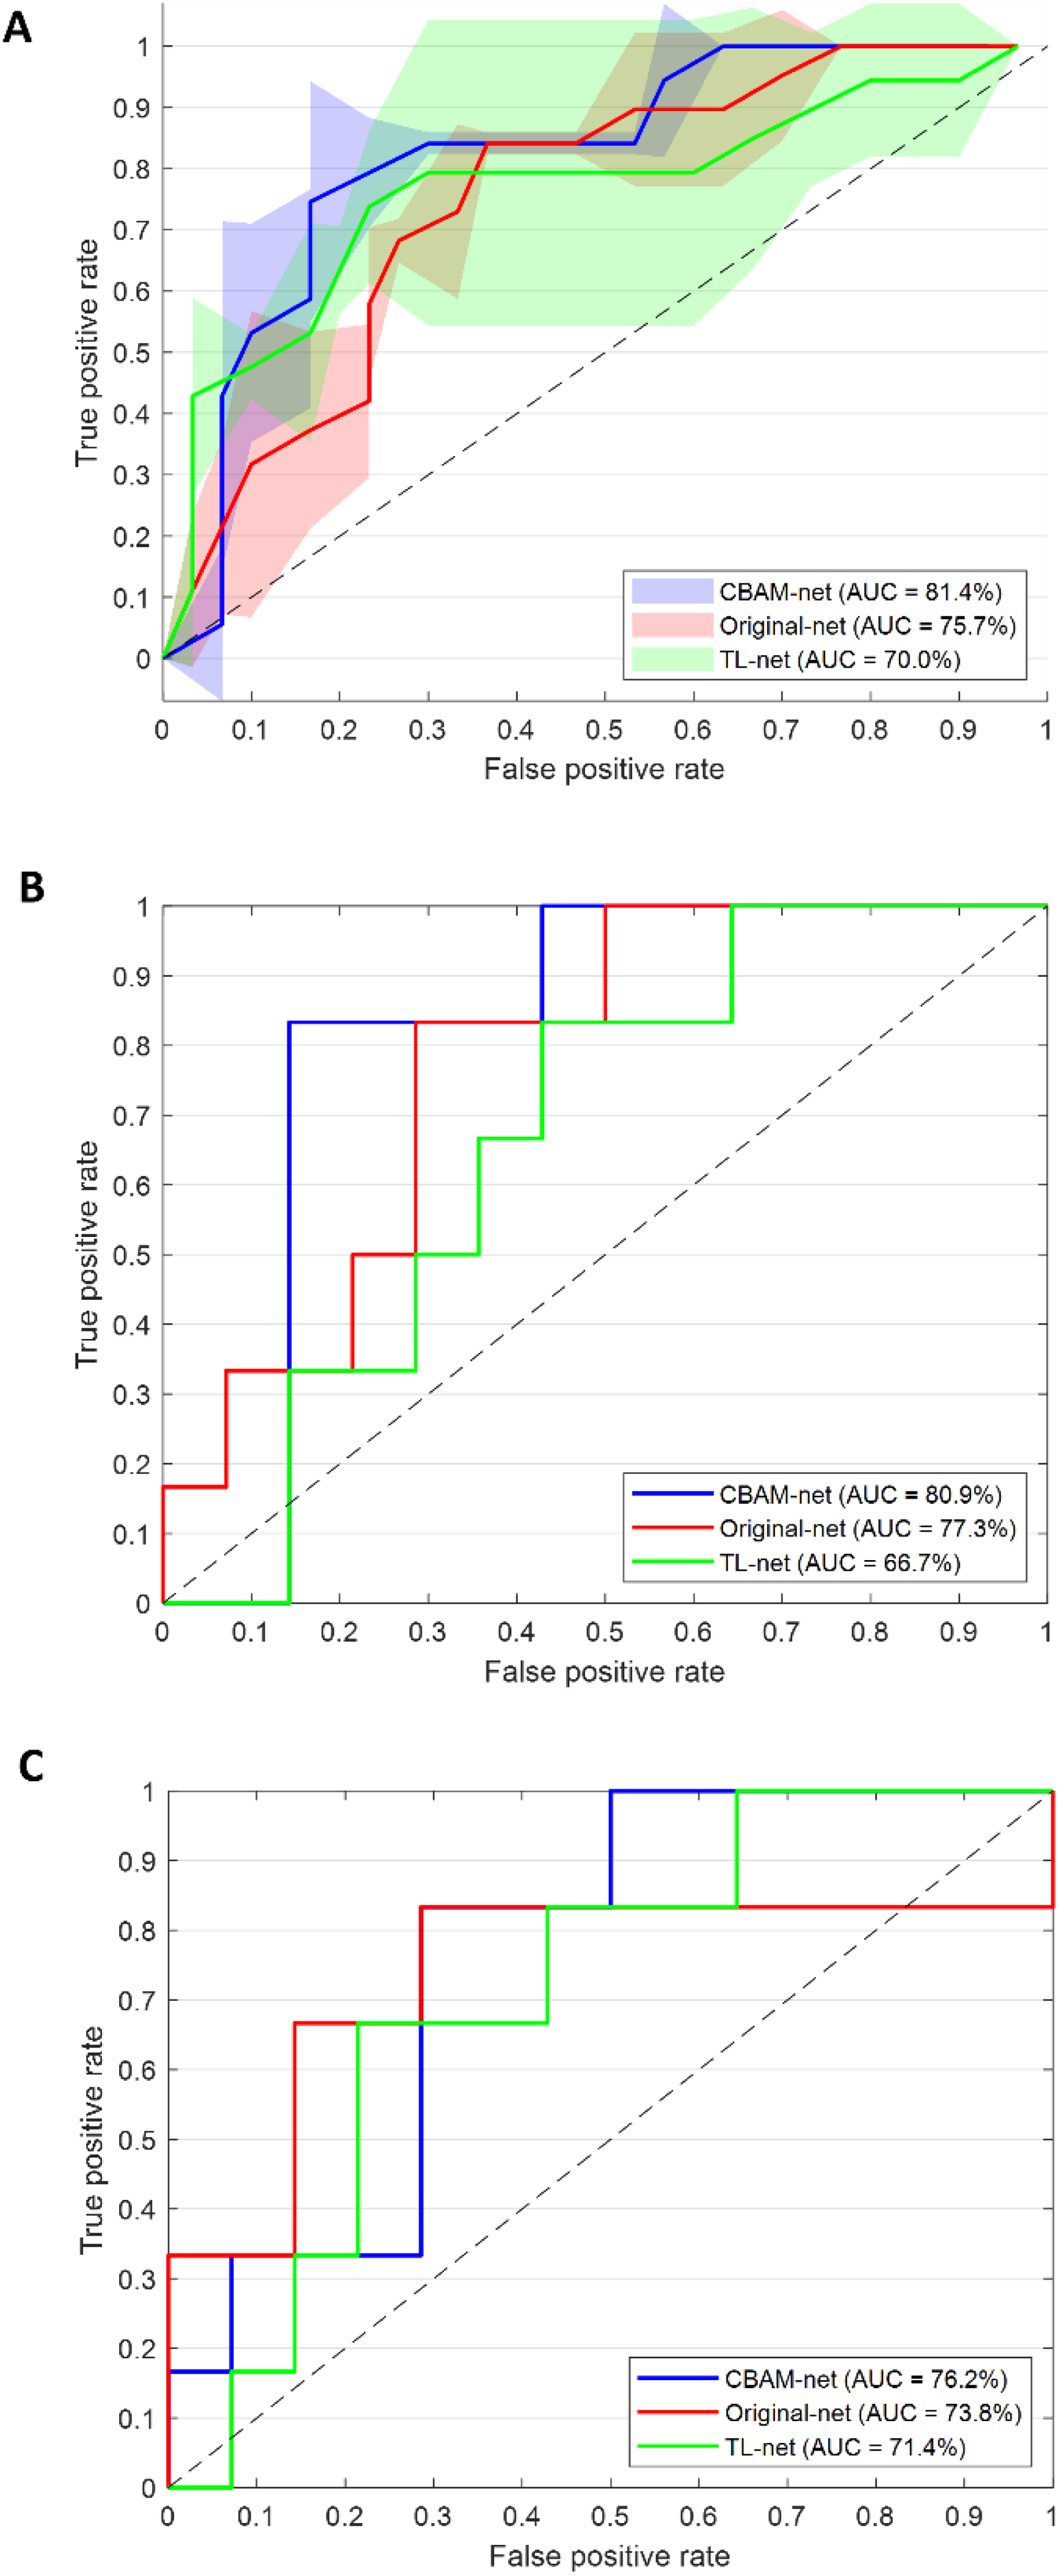
(A) ROC curves for the CBAM-net and the competing models, TL-net and Original-net, evaluated on the IC cohort. These curves represent the average y-values calculated across the test sets within the cross-validation scheme. The corresponding IQRs are represented as shaded areas. (B) ROC curves for the CBAM-net and the competing models, TL-net and Original-net, evaluated on the VC cohort. (C) ROC curves for the CBAM-net and the competing models, TL-net and Original-net, evaluated on the EVC cohort.
Alongside these predictive advantages, CBAM-net achieved this performance with only a modest computational overhead. Training the Original-net and CBAM-Net under the same conditions (as detailed in the Methods section) required ∼85 and ∼90 min per epoch, respectively, corresponding to a 5.9% increase in training time for CBAM-Net. This small additional cost is consistent with previous reports on attention modules 25 and underscores that the integration of CBAM enhances model interpretability and accuracy while maintaining computational efficiency. Overall, this balance of high predictive performance and manageable training time supports the pipeline's potential scalability for real-world clinical applications.
Explainability results
In the vein of explainable AI, Figures 8 and 9 illustrates the explainability analysis applied to a correctly classified pCR and non-pCR patients from the IC cohort, respectively. Panel A shows the tiles identified during the image preprocessing phase, with the corresponding annotations performed by means of QuPath software. Panels B focus on tiles with classification scores that fall into the bin with the highest frequency, indicating the most relevant regions contributing to the prediction made by CBAM-net. Panels C present examples of these tiles with the highest weights derived from CBAM-net, alongside the heatmaps generated through Grad-CAM. The heatmaps were generated by using a jet colormap, where blue indicates areas of lower importance and red highlights areas of higher importance, illustrating that the model focused on specific tumor features that most influenced the prediction. This comprehensive visualization highlights the ability of the model to identify critical morphological patterns linked to the pCR outcome.

Explainability applied to a correctly classified pCR patient from the IC cohort. (A) Tiles identified during the image preprocessing step. Tile annotations are reported. (B) Tiles with classification score belonging to the bin (Bin) with the highest frequency. (C) Examples of tiles and the resulting heatmaps generated by Grad-CAM for tiles with classification scores in Bin and the highest weights derived from CBAM-net. The jet colormap represents numerical values, transitioning from blue for low values to red for high values. Activation was observed in the peritumoral/stromal regions.

Explainability applied to a correctly classified non-pCR patient from the IC cohort. (A) Tiles identified during the image preprocessing step. Tile annotations are reported. (B) Tiles with classification score belonging to the bin (Bin) with the highest frequency. (C) Examples of tiles and the resulting heatmaps generated by Grad-CAM for tiles with classification scores in Bin and the highest weights derived from CBAM-net. The jet colormap represents numerical values, transitioning from blue for low values to red for high values. Activation was localized predominantly in the nuclear areas of cells.
Indeed, the tiles identified by the model as the most predictive were reviewed by our pathologist, who confirmed that it is not possible to extract precise and quantitative morphological features from these tiles to define the pCR based on visual examination alone. However, empirical analysis of the activation maps revealed distinct patterns between the classes. In tiles associated with the pCR class, increased activation was observed in the peritumoral/stromal regions, whereas in tiles corresponding to the non-pCR class, heightened activation was localized predominantly in the nuclear areas of cells, especially neoplastic cells.
Discussion
In this study, we proposed an AI-based pipeline for predicting pCR in breast cancer patients undergoing NAC using digitalized biopsies. This research field has emerged in recent years and is rapidly evolving, becoming a hot topic in cancer research community over the past five years.30–35 Our proposed methodology introduces advancements over current models. One of the major innovations is the integration of unsupervised clustering to preprocess WSIs, filtering out noninformative tiles. This dramatically reduces the computational load, addressing one of the key challenges in digital pathology, that is processing large, high-resolution images efficiently. Additionally, our use of CBAM enhances the attention mechanism of the model, focusing on the key histological features that contribute to treatment outcomes, unlike many traditional CNN models that treat all features equally, potentially overlooking subtle but clinically significant patterns. While CBAM has been previously used in computer vision tasks for medical imaging, its application in this domain represents a novel approach to emphasizing tissue features that are relevant to pCR achievement. This methodology bridges the gap between experimental research and translational oncology, creating a scalable solution with the potential to support real-time decision-making in clinical settings.
A first attempt to use spatial attention-guided prediction of pCR in breast cancer has been investigated by Duanmu et al. 36 However, their method generates spatial attention maps independently, using domain knowledge to identify ROIs based on biomarker expression (Ki67 and PHH3) and applying kernel density estimation. These maps are then multiplied with the original pathology images before taking in input them into the model. In contrast, our method employs CBAM, an integrated attention mechanism within the CNN model itself. CBAM enables dynamic, in-network generation of spatial and channel attention maps for each forward pass, adapting its focus based on learned features without requiring additional preprocessing. This offers flexibility in highlighting context-sensitive areas directly within the model, potentially enhancing efficiency and interpretability without relying on external biomarkers. Furthermore, by weighting the scores of individual tiles based on the attention maps, we were able to prioritize tiles that are most relevant to the prediction of pCR, allowing the model to assign greater importance to regions that are clinically significant. This weighting mechanism significantly improves the model's predictive accuracy by ensuring that the final classification score is informed by the most relevant features, as determined by the attention mechanism.
Beyond Duanmu et al., several recent studies have explored deep learning strategies for pCR prediction from WSIs. Li et al. 30 used a ResNet-based CNN on 874 biopsy WSIs (magnification not specified) and achieved an AUC of approximately 72%. Li et al. 33 developed a dual-stage CNN trained on 40× H&E slides from 540 patients, reporting an AUC of 84.7%. More recently, Zeng et al. 35 implemented a deep CNN on 20× biopsy slides from 312 patients, achieving an AUC of 79%. Compared with these approaches, our CBAM-ResNet101 achieved AUCs of 81.4% (IC) and 76.2% (EVC), while also maintaining robustness across different magnifications (40× and 20×). These findings demonstrate that our model performs competitively with state-of-the-art CNN-based methods while offering enhanced interpretability through an integrated attention mechanism that highlights histologically relevant regions directly within the network.
From a translational perspective, the ability to dynamically prioritize and analyze clinically relevant regions opens up new opportunities to integrate this AI-based pipeline into clinical workflows. For example, the automated tile scoring system could serve as a prescreening tool for pathologists, enhancing diagnostic efficiency and reducing the subjectivity of traditional assessments. A key insight provided by the explainability analysis is that, while the pathologist cannot visually discern precise morphological features in the tiles associated with pCR or non-pCR predictions, the activation maps generated by the model reveal distinct patterns. In tiles linked to the pCR class, the model assigns greater activation to peritumoral/stromal regions, whereas for the non-pCR class, heightened activation is observed in the nuclear areas of neoplastic cells. These differences highlight the model's capacity to capture subtle, clinically relevant features that may not be apparent to the human eye, underlying the complementary role of AI in oncology research. This capability underscores the potential for AI to serve as an adjunct to traditional pathology, helping identify prognostic indicators that are not easily quantifiable by human observers. Since the model was trained and evaluated within pathologist-defined regions of interest, quantitative overlap analyses (e.g., IoU or Dice metrics) were not applicable. Therefore, Grad-CAM and CBAM maps were interpreted qualitatively to highlight relevant histological patterns within the annotated areas, with future work planned to extend this evaluation to whole-slide images with finer annotations. Another critical strength of our approach is its ability to generalize across different cohorts. The consistency across magnifications demonstrates the robustness of the model and highlights the practical utility of training on high-resolution WSI images (40× magnification) while testing on datasets that include both matching and lower magnifications. Since higher magnification images (40×) capture finer details of tissue morphology, they provide a richer feature set for training, enabling the model to learn more generalizable representations. Stable performance on the 20× dataset suggests that the learned features retain discriminative power even when image resolution is reduced, reflecting the model's ability to generalize across varying image qualities. This robustness is particularly promising for multicenter clinical studies, where imaging protocols often vary, further emphasizing the pipeline's potential for translational deployment.
In addition to outperforming several deep learning models, our approach also compares favorably with traditional machine learning models trained on clinicopathological features. For instance, Zhao et al. 37 developed machine learning models based on demographic and pathological variables, achieving AUCs of 71–78%. Lai et al. 38 used clinical features such as age, grade, and receptor status, reporting AUCs of 74–80%. Payan et al. 39 found that clinical data alone reached an AUC of approximately 75%, and Basmadjian et al. 40 obtained similar results (∼77%) using logistic regression and random forest. In comparison, our CBAM-ResNet101, trained solely on histopathological WSIs, achieved competitive performance (AUC 81.4% IC; 76.2% EVC), underscoring the complementary predictive value of morphological features and the advantage of attention-based representation learning over purely clinical predictors.
The main limitation of the study is represented by relatively small sample. To address this limitation, we employed several robust techniques to enhance model stability and reduce overfitting. In the network architecture, we integrated data augmentation, which is widely recognized for improving generalization in machine learning models. Additionally, we implemented a five-fold cross-validation scheme on the IC to rigorously assess performance variability. Beyond cross-validation, we further evaluated the model's reliability using two separate validation datasets, ensuring a comprehensive understanding of its robustness and generalizability. Nevertheless, the limited number of cases in both validation cohorts may restrict statistical power and generalization across diverse clinical settings. Additionally, the EVC included only HER2-positive cases, which may introduce a subtype-specific bias and limit applicability to other breast cancer molecular subtypes. To address these issues, a multicenter study has already been initiated to expand the dataset, include a more heterogeneous population, and validate the proposed model across different molecular profiles.
Despite these efforts, we recognize that further validation on larger, more diverse patient cohorts is essential for optimizing performance and enhancing generalizability. Another challenge was the heterogeneous nature of our patient population, which included tumors with varied clinicopathological characteristics, such as HER2 expression. Since the response to NAC can differ significantly across biological subtypes and systemic treatment types, this variability is an acknowledged limitation. However, this study is primarily intended as a hypothesis-generating analysis, addressing a critical unmet clinical need in this area. Future work will focus on refining the pipeline to allow seamless integration into clinical workflows, emphasizing automation and minimizing dependency on expert annotations. This will pave the way for broader adoption in oncology, ultimately enhancing patient care by personalizing NAC management and improving long-term outcomes.
Conclusion
In conclusion, our method represents a significant advancement in digital pathology for predicting chemotherapy response, focusing on overcoming key challenges in feature selection and computational efficiency. By employing unsupervised clustering to filter out noninformative tiles and integrating CBAM for dynamic attention-based feature prioritization, our model enhances prediction accuracy while improving interpretability. This novel approach not only increases model performance but also offers a more efficient and scalable solution, making it suitable for integration into real-time clinical workflows. Specifically, the pipeline can be incorporated into standard digital pathology processes, requiring only the digitized pretreatment biopsy and providing rapid predictions once the slide is scanned. This enables oncologists to obtain early, data-driven insights that can guide therapeutic decisions before treatment initiation. Ultimately, compared to clinical practice, this novel approach provides benefits in terms of time (for the patient) and cost (for the healthcare facility), supporting faster and more informed decision-making within existing diagnostic workflows.
Footnotes
Ethics approval and consent to participate
The study was conducted according to the guidelines of the Declaration of Helsinki and approved by the Scientific Board of Istituto Tumori “Giovanni Paolo II,” Bari, Italy-prot. 1168/CE. “Informed consent” for publication was collected for all the patients involved in the study, except for patients who are dead or not reachable, as it is a retrospective study (Garante della Privacy n. 9/2016 in data 15 dicembre 2016).
The authors affiliated to Istituto Tumori “Giovanni Paolo II”, IRCCS, Bari are responsible for the views expressed in this article, which do not necessarily represent the ones of the Institute. The authors declare that AI tools were used solely for linguistic editing and stylistic improvement of the manuscript. The AI tools did not influence the study design, data collection, data analysis, or interpretation of results.
Authors’ contributions
Conceptualization: R.M, M.C.C., A.L., A.F., and S.B.; methodology: R.M, M.C.C., A.L., A.F., and S.B; software: M.C.C. and A.L.; validation: R.M, M.C.C., A.L., A.F., and S.B.; formal analysis: R.M, M.C.C., A.L., A.F., and S.B; resources: R.M.; data curation: A.L. and A.B.; writing—original draft preparation: R.M, M.C.C., A.L., A.F., and S.B.; writing—review and editing: all the authors; supervision: R.M.: All authors have read and agreed to the published version of the manuscript.
Funding
The authors disclosed receipt of the following financial support for the research, authorship, and/or publication of this article: This work was supported by funding from the Ministero dell’Istruzione, dell’Università e della Ricerca -Iniziativa Finanziata dal Piano Nazionale Complementare PNC_0000002, Avviso D.D- N. 931 del 06/06/2022 - PROGETTO “DARE - DIGITAL LIFELONG PREVENTION” CUP ISTITUTO: B53C22006270001 – del. n. 462/2023.
Declaration of conflicting interests
The authors declared no potential conflicts of interest with respect to the research, authorship, and/or publication of this article.
Data availability and material
The raw data supporting the conclusions of this article will be made available by the authors upon request.