
Abstract
Rationale and objectives
Neoadjuvant chemotherapy (NAC) is a promising therapeutic strategy for managing locally advanced gastric cancer (LAGC), aiming to reduce tumor burden, enhance resection rates, and improve clinical outcomes. Due to variability in patient responses, the objective of this study was to enhance the prediction of NAC tumor regression grade (TRG) in patients with LAGC by integrating radiomic features with clinical biomarkers through machine learning (ML) approaches.
Materials and methods
We analyzed a cohort of 255 patients with LAGC who underwent NAC prior to surgical resection at the Affiliated Cancer Hospital of Guangxi Medical University. Among these patients, 57 (22.4%) were classified as responders (TRG 0–1), and 198 (77.6%) were identified as non-responders (TRG 2–3). The cohort was divided into a training set (n = 178) and a validation set (n = 77) in a 7:3 ratio. Pre-treatment portal venous-phase computed tomography scans were used to extract 1130 radiomic features via the OnekeyAI platform software. Through feature engineering, we generated a radiomics score (rad score) by linearly combining these features. A variety of ML algorithms were applied to integrate the rad score with clinical biomarkers, resulting in the construction of a hybrid model. The model's diagnostic performance was evaluated using receiver operating characteristic curves and the area under the curve (AUC).
Results
Among the ML models tested, the random forest (RF) model performed best when both the rad score and clinical biomarkers were used as input features, leading to our hybrid model development. This hybrid model (AUC = 0.814) outperformed the radiomics (AUC = 0.755) and clinical (AUC = 0.682) models.
Conclusion
A RF-based hybrid model was developed by integrating radiomics and clinical biomarkers to predict NAC response in patients with LAGC undergoing surgical resection, providing personalized treatment insights.
Keywords
Introduction
Globally, gastric cancer ranks as the fifth most common cancer, with Eastern Asia leading in incidence rates. Approximately half of all gastric cancer cases worldwide occur in China. 1 Locally advanced gastric cancer (LAGC) remains a significant challenge in treatment, as the 5-year overall survival rate for resectable LAGC after radical surgery falls between 20% and 30%.2–4 Neoadjuvant chemotherapy (NAC) has become a standard preoperative treatment for LAGC, aiming to boost the R0 resection rate and improve prognosis by reducing tumor size.5,6 For patients diagnosed with stage T3 or higher LAGC, NAC is recommended, demonstrating the potential to enhance resectability and achieve 5-year survival rates >35% in cases of limited metastatic gastric cancer.7,8 Despite the promising results of NAC, only 30–60% of patients respond, with some developing resistance, rendering NAC ineffective, toxic, and potentially risky for disease progression.9,10 The tumor regression grade (TRG) assesses histological residual tumors after NAC, offering crucial insights into treatment response and guiding personalized therapy strategies. 11 Earlier studies indicated that patients with TRG 0 or 1 and no adverse prognostic factors may skip postoperative chemotherapy, while those with TRG 2 or 3 might require it.12,13 However, these findings rely on postoperative pathological examinations following curative gastrectomy, causing delays and limiting their predictive value before NAC. Thus, identifying pre-treatment factors to predict response is crucial for determining NAC necessity, optimal surgical timing, and refining pre-treatment decision-making in LAGC.
Radiomics, which involves the extraction of high-dimensional quantitative features from medical imaging, enables noninvasive analysis of tumor heterogeneity by integrating complex imaging characteristics. Its application in gastric cancer is increasingly recognized, particularly for predicting therapeutic responses and survival outcomes. 14 Notably, several studies have demonstrated the potential of computed tomography (CT) radiomics in aiding clinicians in predicting the response of patients with LAGC to NAC.15–20 However, these studies have some limitations. First, they often overlooked the impact of preoperative NAC cycle counts on treatment response due to differing chemotherapy durations. Second, the effects of combining emerging immunotherapy with NAC, which is essential for treating LAGC,21,22 are frequently not considered. Finally, the effectiveness of various diagnostic models, including clinical, radiomic, and hybrid models, remains underutilized.
To address these challenges, we used a range of machine learning (ML) methodologies to integrate radiomics with clinical biomarkers. ML is a potent tool that employs advanced mathematical models to synthesize multidimensional data, offering comprehensive insights that surpass visual assessments by radiologists and the isolated use of clinical biomarkers. 23 In predicting NAC response in LAGC, our approach comprehensively considered preoperative NAC cycles, the impact of incorporating emerging immunotherapy, and systemic clinical features as input variables. This tool shows great potential as a reliable reference for clinical treatment decisions, helping determine the necessity of NAC, optimal surgical timing, and refining pre-treatment decision-making for patients with LAGC.
Materials and methods
Patient enrollment
The records of patients with LAGC who completed NAC and underwent surgical resection between January 2014 and January 2024 at the Affiliated Cancer Hospital of Guangxi Medical University were comprehensively reviewed. Patient medical records and pathology reports were the primary sources for obtaining cohort information, including pathological diagnoses, clinical data, CT images, and serological characteristics. The inclusion criteria were as follows: (1) LAGC confirmed by histopathological examination; (2) patients who underwent gastrectomy and lymph node dissection after NAC, with TRG confirmed on postoperative pathological examination; and (3) patients who had undergone thin-slice contrast-enhanced CT scans before treatment. The exclusion criteria were (1) poor quality CT images due to noise, respiratory artifacts, or other movement artifacts; (2) patients with concurrent malignant tumors; (3) patients who received prior anticancer treatment before the baseline CT scan; and (4) patients with incomplete or ambiguous clinicopathological data that could compromise analysis accuracy.
The final cohort of enrolled patients was randomly divided into training and testing sets in a 7:3 ratio, with no intentional stratification (Supplemental Figure 1). Ethical approval for this retrospective study was granted by the Ethics Committee of the Affiliated Cancer Hospital of Guangxi Medical University (Approval number: KY2025581).
Preoperative treatment
The patients in this study underwent 2–5 cycles of first-line NAC (SOX regimen: oxaliplatin 130 mg/m² of body surface area administered intravenously on day 1, and S1 taken orally on days 1–14. The S-1 dosage varied based on body surface area: 40 mg twice daily for <1.25 m², 50 mg twice daily for 1.25–1.5 m², and 60 mg twice daily for >1.5 m²).
Furthermore, 73 patients received neoadjuvant immunotherapy with immune checkpoint inhibitors, including sintilimab, nivolumab, and tislelizumab. Dosages were determined based on drug monographs, clinical guidelines, and body surface area. All patients underwent gastrectomy following NAC. The criteria for evaluating pathological responses, based on the TRG as proposed by the American Joint Committee on Cancer, are comprehensively detailed in Supplemental Digital Content 1.
Imaging acquisition and lesion segmentation
For a comprehensive examination of the CT scan parameters and imaging protocol, kindly consult Supplemental Digital Content 2. Segmentation began with a junior radiologist using ITK-SNAP software (version 4.0.0, www.itksnap.org) to manually outline the enhanced venous-phase CT images layer by layer, creating a lesion overlay map for the volume of interest. A senior radiologist then reviewed and refined this segmentation for accuracy and compliance.
Subsequently, the OnekeyAI platform software (Med-Rad Laboratory V1.1) was employed for image preprocessing and feature extraction, in accordance with our previous validation study. 24 Voxel dimensions were resampled to 1 × 1 × 1 mm³ (X, Y, Z) to achieve uniformity across datasets. After preprocessing, 1130 radiomic features were extracted from the volume of interest, including first-order intensity features, shape features, and various Gy-level matrix features such as size zone matrix, co-occurrence matrix, dependence matrix, and run length matrix.
Feature engineering
Radiomic feature scaling and dimensionality reduction were conducted using the scikit-learn Python library. First, radiomic features were standardized by adjusting them to have a mean of 0 and a standard deviation of 1. This standardization process was conducted independently for the training and test datasets to prevent data leakage. A t-test was then performed to exclude features with p-values > 0.05 from further analysis. Feature redundancies were addressed by identifying a correlation coefficient (r) > 0.9, which led to the random removal of one feature.24,25 In addition, the most significant radiomic signatures were identified using the least absolute shrinkage and selection operator (LASSO), in conjunction with fivefold cross-validation. The stability of the radiomic features was meticulously evaluated using inter-fold coefficient of variation (ICV) analysis. Features exhibiting an ICV < 30% across the cross-validation folds were preserved as robust biomarkers.
26
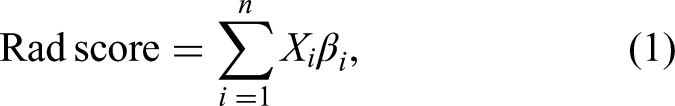
Ultimately, the stable features with non-zero coefficients from the LASSO analysis were selected and utilized to compute the radiomics score (rad score) for each patient. The rad score was calculated by linearly combining the selected features, with each feature multiplied by its corresponding coefficient, using the formula:
Machine learning development
The rad score and clinical biomarkers were utilized as input features to develop hybrid models. In particular, the rad score was incorporated into the radiomics model, whereas the clinical biomarkers were employed in the clinical model. The role of candidate clinical biomarkers in predicting the response of patients with LAGC to NAC was evaluated based on previous studies,15–22 as detailed in Supplemental Digital Content 3.
A flowchart illustrating the ML process is shown in Figure 1. Feature dimensionality reduction was performed using recursive feature elimination with cross-validation (RFECV). This iterative methodology included training the classifier using the complete set of features, evaluating the significance of each feature, and systematically removing the least significant feature. This procedure was iteratively performed using a fivefold cross-validation strategy to assess the accuracy of the base model in this study. The procedure continued until the optimal subset of features was determined. RFECV was selected for its ability to operate within a cross-validation framework, ensuring the selection of relevant features for ML model development. 27

A schematic flowchart showing the machine learning (ML) methodology employed in this study.
In this study, six ensemble ML models were used for binary classification task to predict NAC response in LAGC: random forest (RF), gradient boosting decision tree (GBDT), extreme gradient boosting (XGBoost), light gradient boosting machine (LightGBM), adaptive boosting (AdaBoost), and categorical boosting (CatBoost). TRG 0–1 was labeled as “0,” representing responders, while TRG 2–3 was labeled as “1,” representing non-responders.
For all analyses, we used scikit-learn, a Python library for ML. 28 Model parameters were optimized using Scikit-learn's GridSearch function with cross-validation. Hyperparameter tuning, a crucial step in ML, involves determining the best values for hyperparameters that significantly impact the learning process and enhance model performance. In this study, GridSearch with fivefold cross-validation systematically evaluated various parameter combinations and selected the optimal hyperparameters based on cross-validation results from the training set. 29 Hyperparameter optimization is presented in Supplemental Digital Content 4.
The final optimal ML model was selected based on receiver operating characteristic curves with area under the curve (AUC) values. The trained models were tested on the validation set, and their classification performance was evaluated using AUC. The model with the highest AUC value in the validation cohort was selected as the final model. 30 To conduct a more comprehensive evaluation of the selected model, we calculated confusion matrix-based metrics, namely accuracy, precision, recall, and F1 score, utilizing scikit-learn functions such as “accuracy_score,” “roc_auc_score,” “precision_score,” “recall_score,” and “f1_score,” respectively. These metrics were accompanied by their respective 95% confidence intervals (95% CI).
Statistical analysis
Statistical analyses were conducted using R software (version 4.4.2, https://www.r-project.org/). Categorical variables were assessed using the chi-square test. For continuous variables with normal distribution, data were presented as means ± standard deviations and compared using the independent samples t-test. Non-normally distributed data were expressed as medians with interquartile ranges and analyzed using the Mann–Whitney U test. Statistical significance was set at p < 0.05.
Results
Demographic characteristics
A total of 255 patients with LAGC who completed NAC were included in this study, with their baseline characteristics summarized in Table 1. Among them, 57 (22.4%) were responders (TRG 0–1) and 198 (77.6%) were non-responders (TRG 2–3). The training set comprised 178 patients (70%), and the validation set comprised 77 patients (30%), with no significant differences in demography between the two sets.
Comparison of baseline characteristics before NAC between the training and validation sets.

BMI: body mass index; WBC: white blood cell count; HB: hemoglobin; PLT: platelet count; NEUT: neutrophil count; MONO: monocyte count; LYMPH: lymphocyte count; ALB: albumin; CEA: carcinoembryonic antigen; AFP: alpha-fetoprotein; TGR: tumor regression grading; NAC: neoadjuvant chemotherapy; TRG: tumor regression grade.
In the training set, 40 patients (22.5%) were responders and 138 (77.5%) were non-responders. Similarly, in the validation set, 17 patients (22.1%) were responders and 60 (77.9%) were non-responders. Responders showed significantly lower clinical T stage, a predominantly intestinal-type Lauren classification, a higher proportion receiving immunotherapy, and a lower rad score (p < 0.05) (Supplemental Digital Content 5).
Radiomics model
Initially, 1130 radiomic features were extracted from pre-treatment portal venous-phase CT scans. Through batch t-tests, this was reduced to 598 features. A subsequent batch correlation analysis further narrowed the selection to 218 features. The LASSO regression underwent thorough validation using a fivefold cross-validation approach for hyperparameter selection. An optimal alpha value of 0.012 was identified, demonstrating stable selection at the minimum mean squared error plateau (Supplemental Figure 2). Consistency in feature importance was confirmed by retaining 29 radiomic features with absolute coefficients > 0.01 across all validation folds, resulting in a mean ICV of 23.2% (Supplemental Figure 3). Furthermore, the final set of identified radiomic features exhibited low levels of relevance and redundancy (Supplemental Figure 4).
Finally, the radiomics model achieved AUC of 0.755 (95% CI: 0.600–0.884).
Ml performance comparison
A “sawtooth” upward trend in accuracy was observed during the RFECV process (conducted for feature dimensionality reduction), which was associated with an increase in the number of features. This trend peaked when the feature count reached 16, after which minor declines were observed. Therefore, the optimal feature set was determined to consist of 16 features, allowing the base model to attain maximum accuracy (Figure 2).
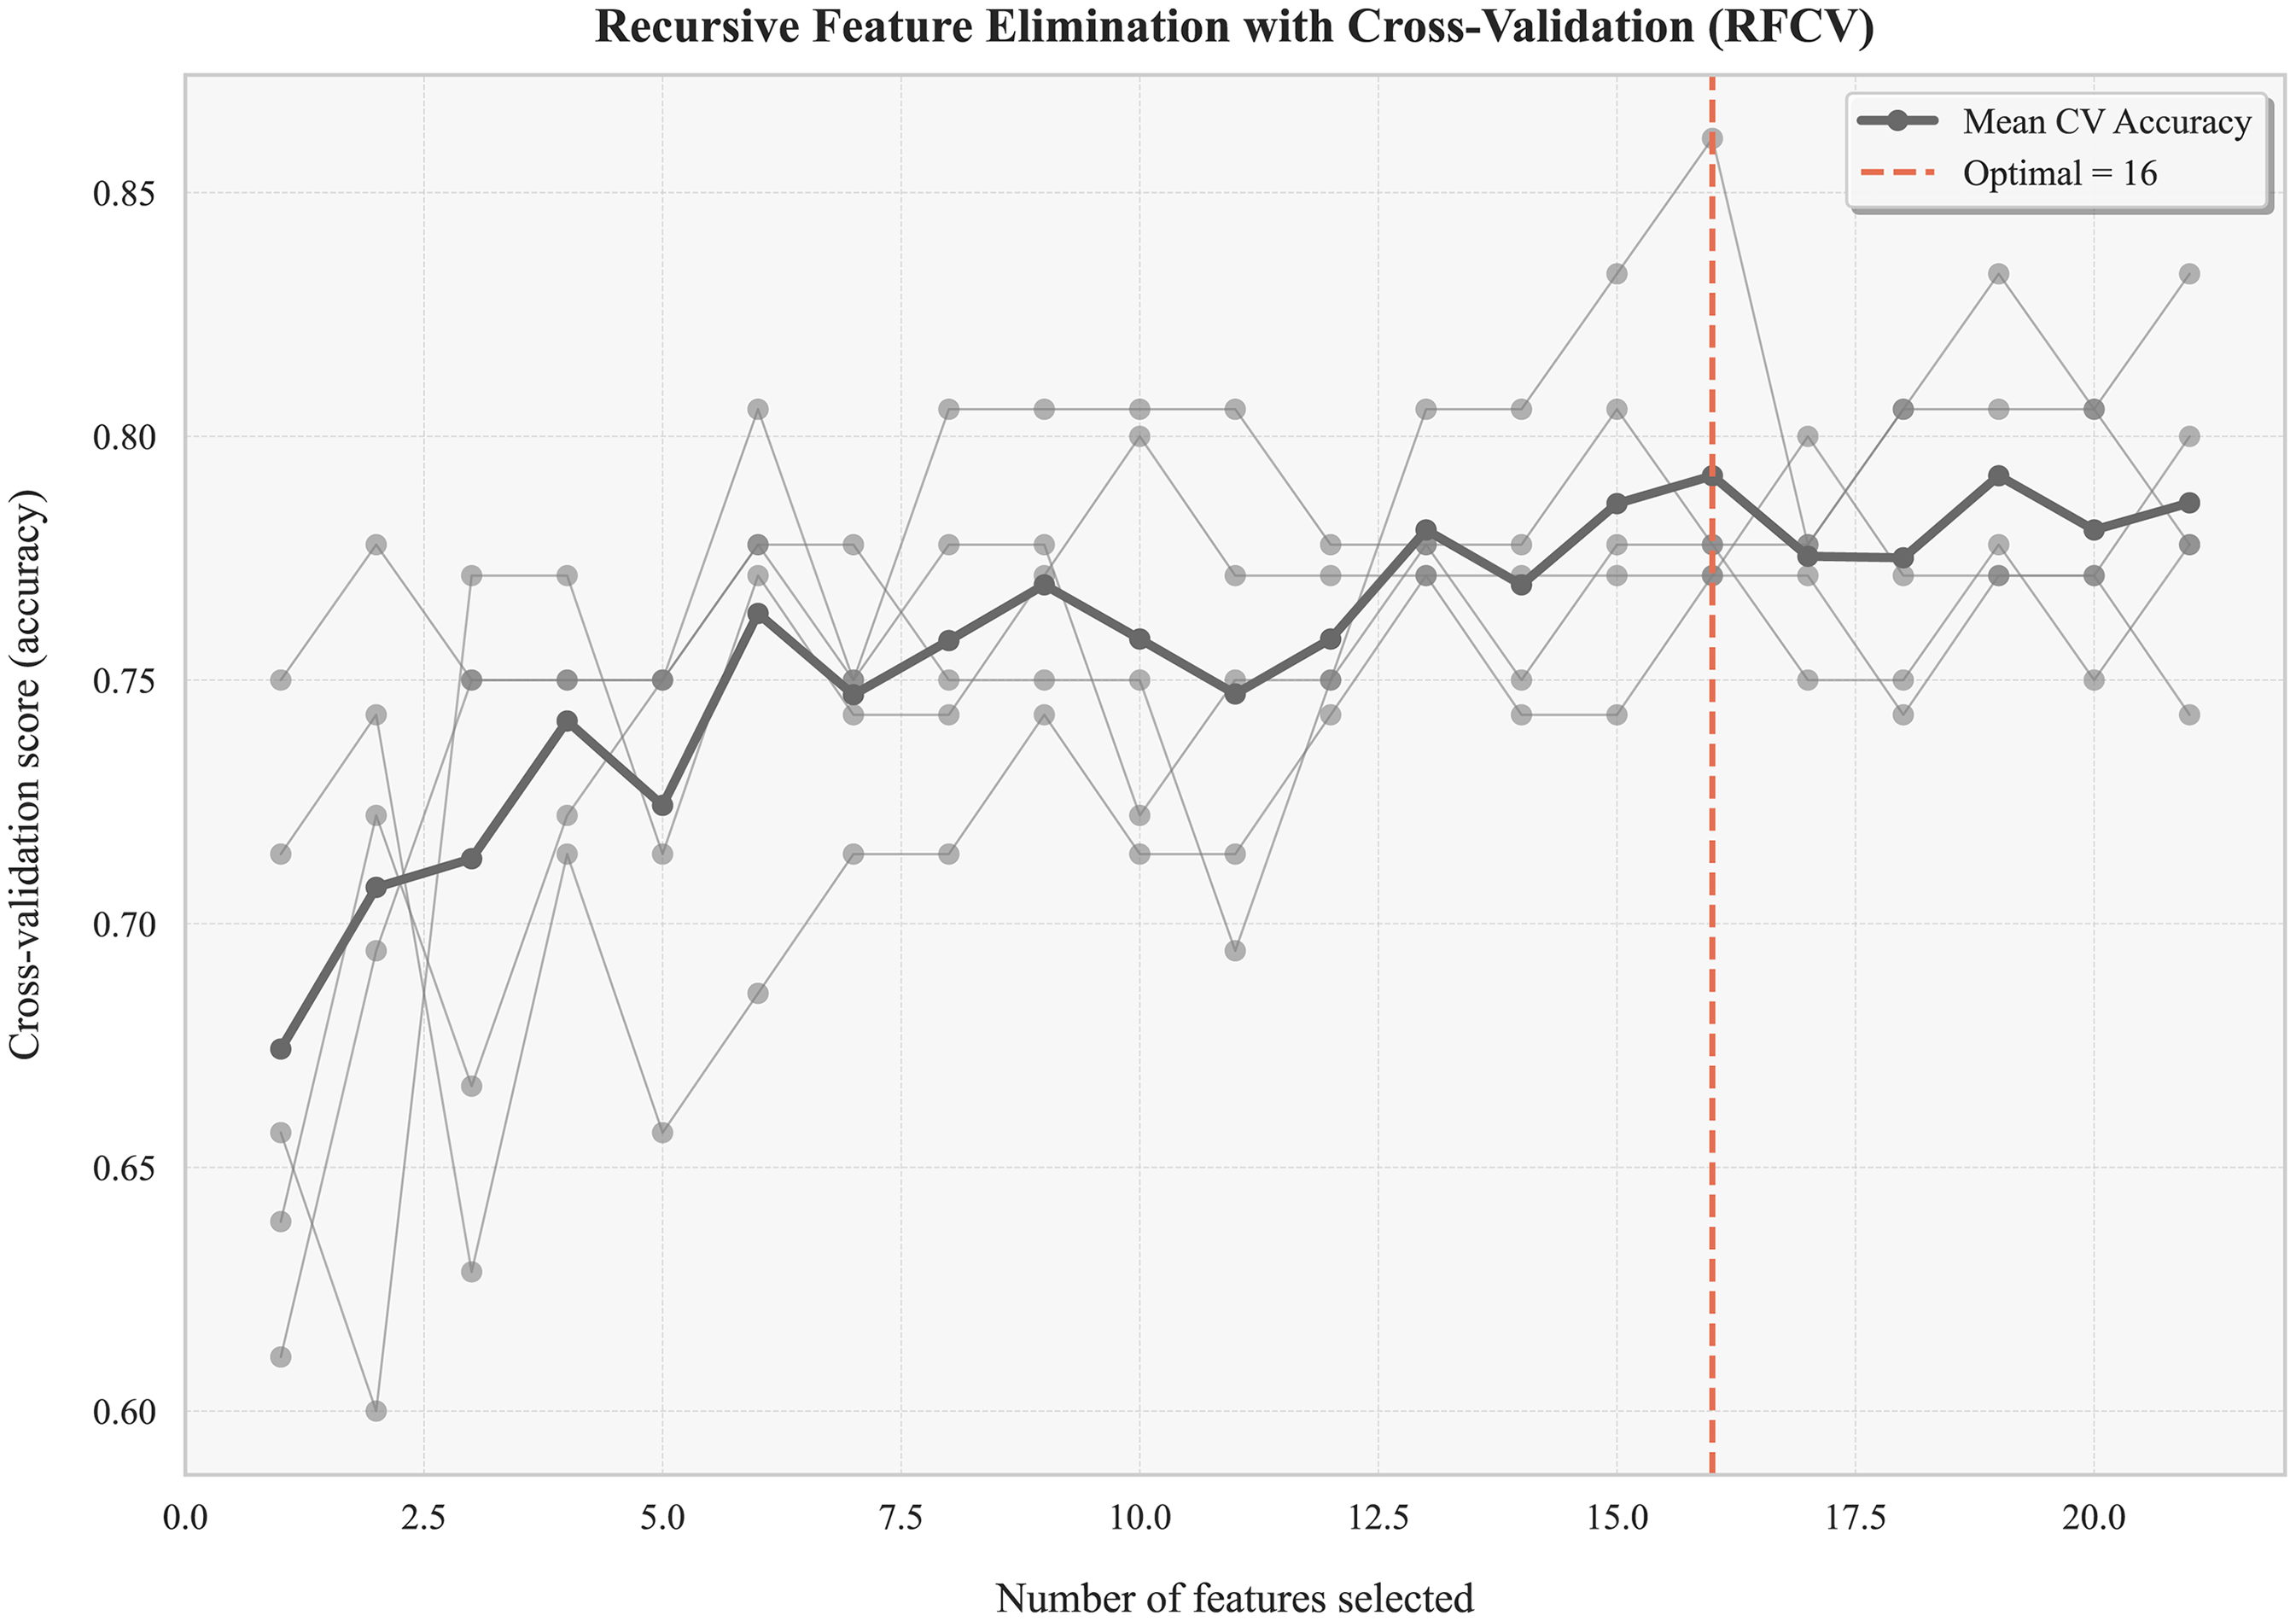
Recursive feature elimination with cross-validation (RFECV) for feature selection.
Then, we employed various ML algorithms, including RF, GBDT, XGBoost, LightGBM, AdaBoost, and CatBoost, to integrate the rad score with clinical biomarkers and develop a hybrid model. RF achieved the highest AUC of 0.815 (95% CI:0.701–0.912), as shown in the receiver operating characteristic curve in Figure 3. Comprehensive performance metrics, including AUC, accuracy, recall, precision, and F1 score, are detailed in Table 2 and Figure 4. Notably, the RF model achieved the highest recall of 0.933 (95% CI:0.864–0.984) and the highest F1 score of 0.882 (95% CI:0.820–0.935), thereby affirming its suitability for this classification tasks.
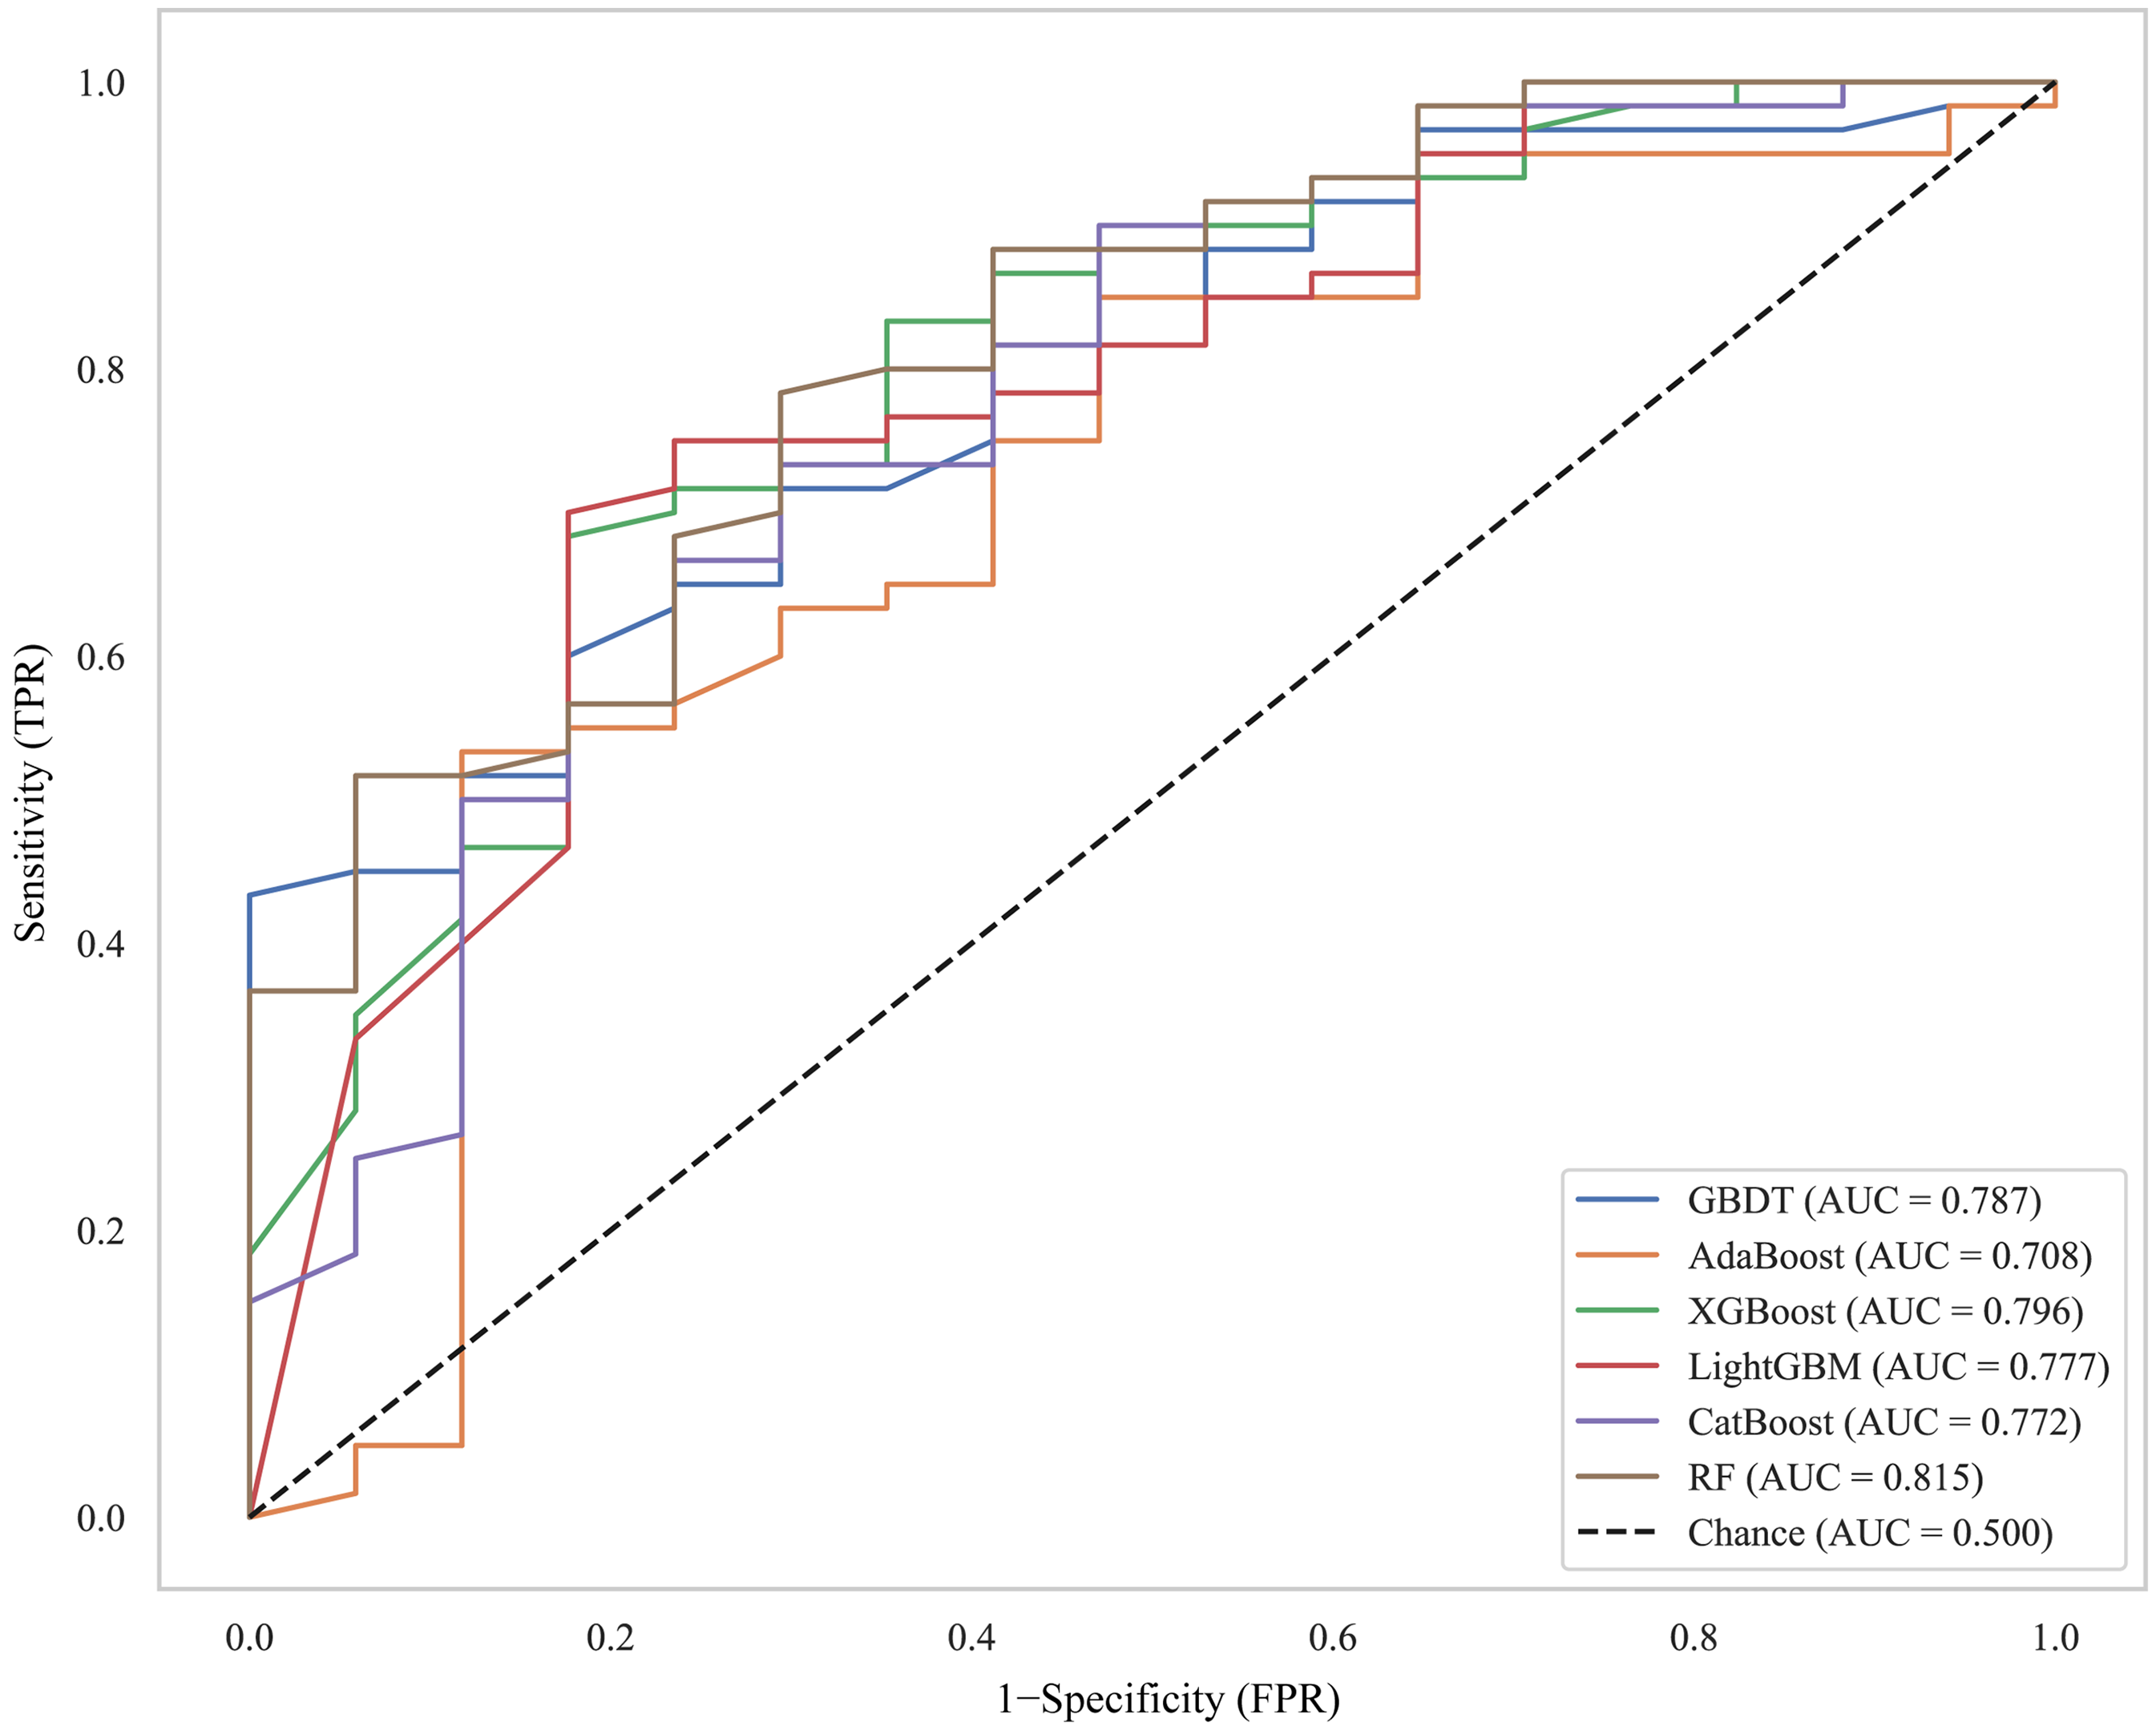
Receiver operating characteristic (ROC) curves comparing the performance of RF, GBDT, XGBoost, LightGBM, AdaBoost, and CatBoost classifiers. RF: random forest; GBDT: gradient boosting decision tree; XGBoost: extreme gradient boosting.
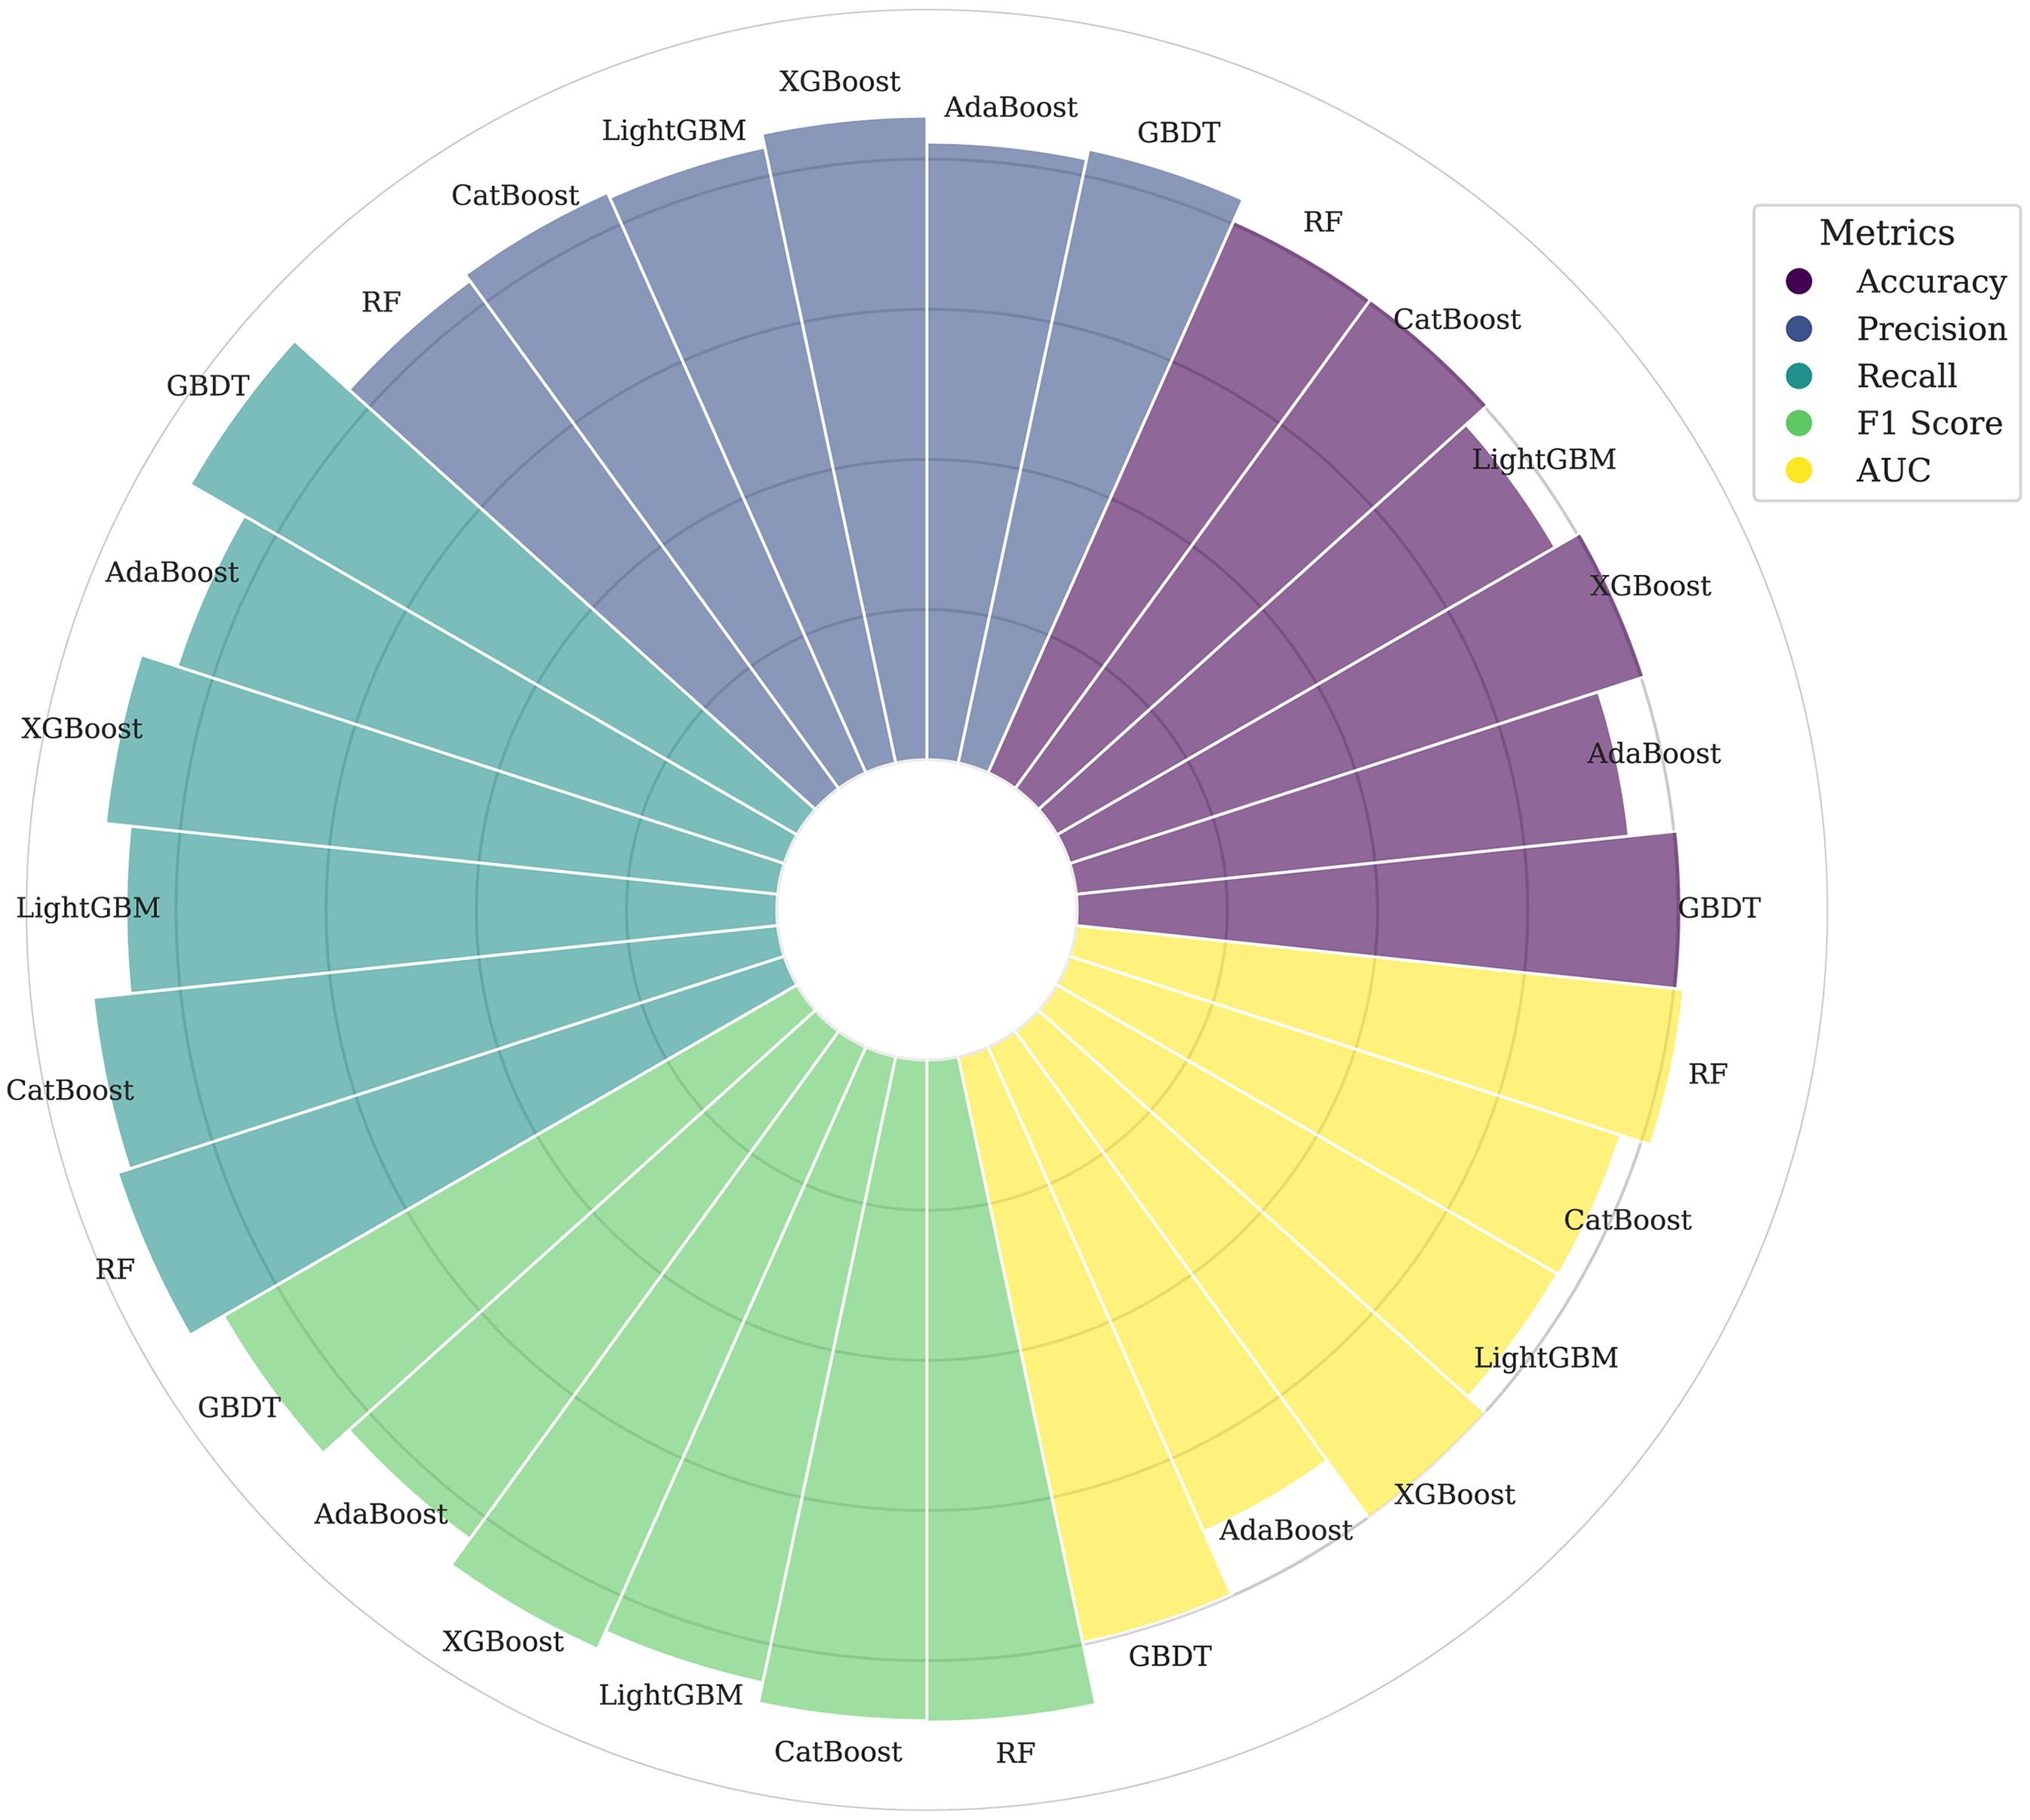
Comprehensive visualization of detailed performance metrics, including area under the curve (AUC), accuracy, recall, precision, and F1 score.
Diagnostic performance of six machine learning models.

Bold indicates the maximum value.
GBDT: gradient boosting decision tree; AdaBoost: adaptive boosting;XGBoost: extreme gradient boosting; LightGBM: light gradient boosting machine; CatBoost: categorical boosting; RF: random forest; AUC: area under the curve; CI: confidence interval.
The variable heatmap in Figure 5 shows the RF-based hybrid model performance for predicting NAC response in LAGC. Each row represents a specific variable, and each column corresponds to an individual sample. Color gradients represent the range of continuous variable values, while categorical variables are distinguished by different colors for each category. This analysis identified NAC responders with indolent biomedical informatics characteristics, such as lower RF-predicted values, reduced rad score, and a lower clinical T stage.

A variable heatmap depicting the predictive performance of the RF-based hybrid model for neoadjuvant chemotherapy (NAC) response in locally advanced gastric cancer (LAGC). NAC: neoadjuvant chemotherapy; LAGC: locally advanced gastric cancer.
To further evaluate the efficacy of RF algorithms for binary classification tasks in predicting NAC response in LAGC, we focused on clinical biomarkers as input variables. Ablation experiments were conducted to evaluate the contribution of each component to overall model performance. The RF-based clinical model exhibited AUC of 0.682 (95% CI, 0.555–0.796). Among the models, the RF-based hybrid model performed the best, followed by the radiomic model, and then the clinical model (Table 3 and Supplemental Figure 5).
Diagnostic performance of clinical, radiomics, and hybrid models.

Bold indicates the maximum value
AUC: area under the curve; CI: confidence interval.
Ml model explanation
The RF-based hybrid model was chosen as the final model. To enhance interpretability, the Boruta algorithm was used to evaluate feature importance within the RF classifier model. 31 A default iteration limit of 100 was set to rigorously identify the most influential features. A lower numerical value indicates a greater feature importance. Figure 6 shows that the features located on the leftmost side consistently ranked highly across multiple iterations. Notably, the top four features ranked by importance were rad score, clinical T stage, immunotherapy, and CA 125. These features were identified as the most critical contributors to the model's predictive capability through the Boruta algorithm's iterative feature-selection process.

The ranking of feature importance in the RF-based hybrid model, determined through the Boruta algorithm's iterative feature-selection process. RF: random forest.
Discussion
This study presents a novel investigation into the use of radiomics by comparing various ML approaches to predict the response to NAC in patients with LAGC undergoing gastrectomy. The RF-based hybrid model, which integrates radiomic features with clinical biomarkers, exhibited superior predictive performance compared to both the standalone clinical and radiomic models.
Previous studies have demonstrated that clinicopathological characteristics, such as age, signet-ring cell histology, and microsatellite status, are associated with patients who benefit from NAC in LAGC.32–35 However, these studies have some limitations. First, the examined clinical features lacked representativeness. Second, the pathological characteristics were primarily derived from preoperative fine-needle aspiration biopsies, which can sometimes yield inaccurate results. Furthermore, issues such as limited sample size, uneven sample distribution, and inadequate sampling techniques can introduce variability into the pathological findings, further diminishing the studies’ reliability.32–35 Conversely, CT-based radiomics provides a comprehensive visualization of tumor tissues, capturing both morphological and textural characteristics. The unique textural and spatial gray-level patterns of the extracted radiomic features can reflect variations in cellular composition or properties, aiding in the assessment of intratumoral heterogeneity. 14 Several studies have highlighted the potential of CT radiomics to assist clinicians in predicting the responses of patients with LAGC to NAC.15–19 However, these studies also have shortcomings. They often neglect the impact of varying NAC cycle counts, fail to consider the combination of immunotherapy with NAC,21,22 and do not fully leverage different diagnostic models such as clinical, radiomics, and hybrid models.
To fully harness the diagnostic potential of radiomic models and clinical biomarkers, we implemented various ensemble ML approaches: RF, GBDT, XGBoost, LightGBM, AdaBoost, and CatBoost. Among these, the RF model stood out as the best performer, as evidenced by its highest AUC of 0.815 (95% CI:0.701–0.912). It also achieved the highest recall of 0.933 (95% CI:0.864–0.984) and the highest F1 score of 0.882 (95% CI:0.820–0.935). The exceptional recall of the RF model indicates that it can robustly minimize false negatives. This is a critical requirement when planning neoadjuvant therapy, where the risk of disease progression due to under-treatment must be mitigated. The balanced F1 score of 0.882 further supports its clinical viability.
We selected the AUC for model evaluation because our study addresses the issue of class imbalance, with only 22.4% of responders. In this context, AUC is more informative than threshold-dependent metrics such as accuracy and F1-score. Unlike accuracy, which favors the majority class, AUC evaluates the distinction between the distributions of responders and non-responders, regardless of class prevalence. This approach aligns with our objective to enhance discriminatory power before optimizing thresholds, as metrics such as precision and recall often emphasize the minority class. 30 The superior performance of the RF algorithm in this binary classification task can be attributed to its several inherent advantages. 36 First, RF is robust against overfitting due to its use of multiple decision trees and the averaging of their predictions, which reduces variance and enhances generalizability. Second, it excels at handling high-dimensional data and complex interactions by assessing variable importance and selecting the most relevant features. Furthermore, the bootstrap sampling technique used to train each tree on different subsets of data further boosts model diversity and accuracy. Moreover, RF's ability to maintain performance even in the presence of noise or irrelevant features highlights its superior diagnostic efficacy compared to other boosting techniques, ultimately making it the top-performing model for this binary classification task.
ML techniques are often labeled as “black boxes” due to their opacity in the prediction process. This lack of transparency can hinder clinicians’ willingness to incorporate these models into their medical decision-making processes. To address this issue, we utilized the Boruta method to provide insights into the inner workings of the ML models. Boruta is a feature-selection technique that leverages the RF algorithm. It generates random shadow features and iteratively compares them to the real features. In this process, the importance of each real feature is repeatedly compared to that of the shadow features to determine which ones are relevant to the dependent variable. A feature is deemed “important” if its importance surpasses that of all shadow features, “unimportant” if it falls short, and “tentative” if the result is ambiguous. The algorithm iteratively removes “unimportant” features and reconstructs the model, continuing this process until all features are classified or a predetermined iteration limit is reached. Finally, the significant features identified through this rigorous process were retained for model construction. 31 As shown in Figure 6, the top four features, ranked by importance were rad score, clinical T stage, immunotherapy, and CA 125.
The radscore was ranked first, highlighting the capacity of the radiomics method to provide supplementary insights into intratumoral heterogeneity beyond the scope of visual assessments conducted by radiologists. This result is consistent with those of previous studies,15–20 as the radscore plays a significant role in quantifying tumor heterogeneity, which is fundamental to biological processes such as chaotic angiogenesis and heterogeneous cellular proliferation patterns. Besides, researchers have also identified the clinical T stage as a key predictive factor for NAC efficacy, 37 which supports our study's findings. This is because clinical T staging reflects tumor burden and invasiveness; larger or more invasive tumors typically achieve higher staging before treatment, indicating greater treatment resistance or difficulty. Immunotherapy has emerged as a promising treatment for advanced LAGC, with numerous studies supporting its effectiveness, as does this study.21,22 Furthermore, elevated CA125 levels may indicate a higher tumor burden or more aggressive tumor biology. In gastric cancer, tumors expressing higher CA125 levels may exhibit increased resistance to chemotherapeutic agents due to factors such as genetic heterogeneity, altered metabolic pathways, or enhanced survival mechanisms like increased expression of drug efflux pumps.38,39
This study has several limitations. First, radiomic features were exclusively extracted from CT images, excluding other multimodal medical imaging techniques, such as MRI and ultrasound. Second, the study's design as a single-center, retrospective analysis with a limited sample size makes it vulnerable to selection and reporting biases, which are difficult to mitigate. Third, the study faced a significant rate of loss to follow-up, primarily due to its retrospective design and low patient adherence. This limitation hindered our capacity to collect long-term survival data, which is essential for evaluating the impact of our predictive model on patient outcomes. Finally, although manual segmentation by board-certified radiologists ensured accurate identification of complex lesions, the potential benefits of semi-automated or fully automated methods should be explored in future.
In conclusion, this study employed an RF-based hybrid model that integrates radiomics and clinical biomarkers to predict the response to NAC in patients with LAGC undergoing surgical resection, offering personalized treatment insights.
Supplemental Material
sj-docx-6-dhj-10.1177_20552076251341740 - Supplemental material for Predicting neoadjuvant chemotherapy response in locally advanced gastric cancer using a machine learning model combining radiomics and clinical biomarkers
Supplemental material, sj-docx-6-dhj-10.1177_20552076251341740 for Predicting neoadjuvant chemotherapy response in locally advanced gastric cancer using a machine learning model combining radiomics and clinical biomarkers by Tong Ling, Zhichao Zuo, Liucheng Wu, Jie Ma, Tingan Wang and Mingwei Huang in DIGITAL HEALTH
Supplemental Material
sj-docx-7-dhj-10.1177_20552076251341740 - Supplemental material for Predicting neoadjuvant chemotherapy response in locally advanced gastric cancer using a machine learning model combining radiomics and clinical biomarkers
Supplemental material, sj-docx-7-dhj-10.1177_20552076251341740 for Predicting neoadjuvant chemotherapy response in locally advanced gastric cancer using a machine learning model combining radiomics and clinical biomarkers by Tong Ling, Zhichao Zuo, Liucheng Wu, Jie Ma, Tingan Wang and Mingwei Huang in DIGITAL HEALTH
Supplemental Material
sj-docx-8-dhj-10.1177_20552076251341740 - Supplemental material for Predicting neoadjuvant chemotherapy response in locally advanced gastric cancer using a machine learning model combining radiomics and clinical biomarkers
Supplemental material, sj-docx-8-dhj-10.1177_20552076251341740 for Predicting neoadjuvant chemotherapy response in locally advanced gastric cancer using a machine learning model combining radiomics and clinical biomarkers by Tong Ling, Zhichao Zuo, Liucheng Wu, Jie Ma, Tingan Wang and Mingwei Huang in DIGITAL HEALTH
Supplemental Material
sj-docx-9-dhj-10.1177_20552076251341740 - Supplemental material for Predicting neoadjuvant chemotherapy response in locally advanced gastric cancer using a machine learning model combining radiomics and clinical biomarkers
Supplemental material, sj-docx-9-dhj-10.1177_20552076251341740 for Predicting neoadjuvant chemotherapy response in locally advanced gastric cancer using a machine learning model combining radiomics and clinical biomarkers by Tong Ling, Zhichao Zuo, Liucheng Wu, Jie Ma, Tingan Wang and Mingwei Huang in DIGITAL HEALTH
Supplemental Material
sj-docx-10-dhj-10.1177_20552076251341740 - Supplemental material for Predicting neoadjuvant chemotherapy response in locally advanced gastric cancer using a machine learning model combining radiomics and clinical biomarkers
Supplemental material, sj-docx-10-dhj-10.1177_20552076251341740 for Predicting neoadjuvant chemotherapy response in locally advanced gastric cancer using a machine learning model combining radiomics and clinical biomarkers by Tong Ling, Zhichao Zuo, Liucheng Wu, Jie Ma, Tingan Wang and Mingwei Huang in DIGITAL HEALTH
Supplemental Material
sj-docx-11-dhj-10.1177_20552076251341740 - Supplemental material for Predicting neoadjuvant chemotherapy response in locally advanced gastric cancer using a machine learning model combining radiomics and clinical biomarkers
Supplemental material, sj-docx-11-dhj-10.1177_20552076251341740 for Predicting neoadjuvant chemotherapy response in locally advanced gastric cancer using a machine learning model combining radiomics and clinical biomarkers by Tong Ling, Zhichao Zuo, Liucheng Wu, Jie Ma, Tingan Wang and Mingwei Huang in DIGITAL HEALTH
Footnotes
Funding
The authors disclosed receipt of the following financial support for the research, authorship, and/or publication of this article: This work was supported by the National Natural Science Foundation of Guangxi, the National Natural Science Foundation of Guangxi, the National Natural Science Foundation of China, (grant number No. 2023GXNSFAA026133, No. 2024GXNSFAA010407, No. 82360593).
Declaration of conflicting interests
The authors declared no potential conflicts of interest with respect to the research, authorship, and/or publication of this article.
Supplemental material
Supplemental material for this article is available online.
References
Supplementary Material
Please find the following supplemental material available below.
For Open Access articles published under a Creative Commons License, all supplemental material carries the same license as the article it is associated with.
For non-Open Access articles published, all supplemental material carries a non-exclusive license, and permission requests for re-use of supplemental material or any part of supplemental material shall be sent directly to the copyright owner as specified in the copyright notice associated with the article.