
Abstract
Background
Despite being a prevalent peripheral vestibular disorder in China, Meniere's disease (MD) suffers from low awareness, frequent misdiagnosis, and unsatisfactory treatment rates. As TikTok has become a prominent source of health information, no study has systematically evaluated the quality of its MD-related content. We therefore assessed the accuracy and reliability of MD videos on Chinese TikTok.
Methods
Top 100 videos for “Meniere's disease/syndrome” (TikTok, 1 May 2025) were analyzed. Quality was assessed using Video Information and Quality Index (VIQI), Global Quality Score (GQS), modified DISCERN (mDISCERN), and Patient Education Materials Assessment Tool for Audio-Visual Content (PEMAT-A/V). Descriptive statistics, correlation analyses, and predictive modeling were applied to 83 valid videos.
Results
Among 83 videos, 91.6% (n = 76) were physician-uploaded (primarily otolaryngologists/neurologists). Monologue, Q&A, and medical scenario formats showed superior quality. Symptoms dominated content (47%). Neurologists generated significantly higher normalized engagement per second than otolaryngologists (all adj. p < 0.05, r > 0.35). Physicians outperformed news agencies in GQS scores (adj. p < 0.05, r = 0.291). Otolaryngologists scored higher than both neurologists and Traditional Chinese Medicine practitioners in PEMAT-A/V Understandability (all adj. p < 0.05, r > 0.37). Attending physicians exceeded chief physicians on all quality metrics (all adj. p < 0.05, r > 0.35), an advantage potentially linked to their younger age, greater digital literacy, and more frequent social media use. Engagement metrics (likes, comments, favorites, shares) correlated strongly (r > 0.8). Predictive models for PEMAT-U/A were significant (p < 0.001), lacking multicollinearity/autocorrelation.
Conclusion
Physician-created MD content ensures credibility but requires quality improvement. PEMAT-U/A models guide enhancements, though broader application needs validation. Key health informatics priorities include certified creator engagement, algorithm optimization, and innovative content design.
Introduction
Meniere's disease (MD) is pathologically characterized by idiopathic endolymphatic hydrops. Its pathogenesis remains complex and incompletely understood. 1 Clinically, it manifests as recurrent spontaneous rotational vertigo, fluctuating and progressive sensorineural hearing loss, tinnitus, and/or aural fullness. The condition has a prevalence ranging from 50 to 200 cases per 100,000 adults and occurs most frequently in middle-aged women, with the majority of patients between 30 and 60 years of age.1,2 Diagnosis relies heavily on clinical history in the absence of a gold-standard test, and while no definitive cure exists, current therapies primarily aim to control symptoms and improve quality of life.2,3
Social media has emerged as a significant channel for individuals to access medical information, where many patients search for relevant content online both before and after consulting healthcare providers. 4 TikTok, as a leading short-video sharing platform, offers a wide range of content, including numerous videos related to healthcare. In China, TikTok has up to 600 million active users, making it an important channel for disseminating health information. 5 Although TikTok has great potential for spreading public health information, the quality of disease-related videos on the platform is inconsistent, and the accuracy and reliability of some information need further verification. Previous studies have focused on assessing the quality of TikTok videos covering various conditions, such as mitral valve regurgitation, gallstones, COVID-19, diabetes, chronic obstructive pulmonary disease, and atopic dermatitis.6–11 However, no study has yet evaluated the quality of MD-related videos on TikTok. Therefore, we investigated MD-related videos on TikTok to identify their upload sources, content, and characteristics and to further assess video quality. This study aims to provide the public with evidence-based guidance for accessing reliable MD information online and to offer actionable recommendations for content creators and platforms.
Methods
Ethical considerations
No formal ethical approval was required for this study. The data comprised only publicly accessible TikTok videos that contained no personally identifiable information, accordingly, the project was classified as exempt from NHS Research Ethics Committee review following the UK Health Research Authority decision tool. 12
Search strategy and video selection
This study was conducted and reported in accordance with the Strengthening the Reporting of Observational Studies in Epidemiology (STROBE) guideline for cross-sectional studies. 13 On 1 May 2025, from 9:00 AM to 11:00 AM, a search was conducted on the Chinese version of TikTok using the terms “梅尼埃病” (Meniere's disease) and “梅尼埃综合征” (Meniere's syndrome). The search term “梅尼埃病” yielded only 19 videos, whereas hundreds of videos were retrieved using “梅尼埃综合征.” To minimize potential bias, the search was performed while logged out of any personal accounts and without applying any content filters. The analysis was restricted to the first 100 videos, as previous studies14–16 have demonstrated that videos beyond this range do not significantly influence the analytical outcomes. After excluding duplicates and irrelevant content, a total of 83 TikTok videos were included in the study.
Video assessment process
The quality of the included videos was assessed using a structured process. All videos were collected and downloaded by one individual (XW). Two authors (XW and DLL) independently evaluated the videos using the assessment tools detailed below. Initial scores were determined through discussion. In cases of persistent disagreement, an arbitrator (ZYL) made the final decision. All authors subsequently approved each final rating. The intraclass correlation coefficient (ICC) and a two-way fixed-effects model were used to assess the scores between raters (XW and DLL). ICC values range from 0 to 1 and were interpreted as follows: < 0.5 (poor agreement), 0.5 to 0.75 (moderate agreement), 0.75 to 0.90 (good agreement), and > 0.90 (excellent agreement). 17
Assessment tools and criteria
Video quality was assessed using four validated tools: the Video Information and Quality Index (VIQI)16,18 for transmissibility; the modified DISCERN (mDISCERN) tool19–22 for reliability; the Global Quality Score (GQS)7,9,23,24 for overall information quality; and the Patient Education Materials Assessment Tool for Audiovisual Materials (PEMAT-A/V)25,26 for public educational impact. These assessments were applied to all eligible videos.
Firstly, the VIQI was employed to evaluate video transmissibility. It encompasses four dimensions: information flow (VIQI 1), information accuracy (VIQI 2), quality (one point is awarded for each inclusion of an image, animation, interview, video subtitles, and summary in the video) (VIQI 3), and precision (the coherence between the video title and content) (VIQI 4). Each criterion is scored on a scale of 1 to 5, with higher scores indicating better quality.
Secondly, the mDISCERN tool was used to analyze video reliability and quality. This tool, validated for health videos on platforms like YouTube, includes five yes/no questions: (1) Is the video's objective clear and achieved? (2) Are reliable information sources used? (3) Is the information presented in a balanced and unbiased manner? (4) Are other information sources listed for patient reference? (5) Are areas of uncertainty mentioned? Each question is scored as 1 (indicating “yes”) or 0 (indicating “no”). Higher scores denote greater reliability.
Thirdly, the GQS was utilized to assess the quality of information in the videos. The GQS, widely recognized for evaluating the quality of health information on online video platforms, includes five criteria: (1) poor quality (poor information flow, most information missing, not useful for patients); (2) generally poor quality (poor flow, some information provided but many important topics missing, very limited use for patients); (3) moderate quality (deficient flow, some important information discussed adequately while others are not, somewhat useful for patients); (4) good quality (generally good flow, most relevant information listed, useful for patients despite some missing topics); and (5) excellent quality (excellent flow and highly useful information for patients). Higher scores indicate better video quality.
Lastly, the PEMAT-A/V was used to evaluate the educational impact of the video materials on the public. The PEMAT-A/V, designed specifically for assessing audiovisual materials, consists of 17 questions: 13 questions assess the understandability of the health information provided, while 4 questions assess the actionability of the recommendations. Responses are scored as “agree” (1), “disagree” (0), or “N/A.” Total scores, as well as subscores for understandability and actionability, are calculated using the formula “total score/total possible score × 100(%).” Higher scores indicate better understandability or actionability, or both.
Data extraction and video characterization
For each included video, the following characteristics were recorded and analyzed: title, uploader, uploader's identity and follower count, verification status and type, video length (seconds), upload date, engagement data (likes, comments, favorites, and shares) and their normalized values per second, and online persistence.
Uploaders were classified as physicians (otolaryngologists, neurologists, Traditional Chinese Medicine (TCM) practitioners, and other healthcare professionals), medical institutions, or news organizations. Content topics included epidemiology, etiology/prevention, symptoms, examination/diagnosis, and treatment. Videos not addressing these topics were excluded.
Non-original videos (reposts/translations/minimally edited) were identified. Presentation styles were classified into six formats (Solo Narration, Q&A, PPT/Class, Animation/Action, Medical Scenarios, TV show/Documentary) using a predefined coding scheme. Inter-rater reliability was assessed and showed substantial agreement (Cohen's κ = 0.828). Detailed definitions, examples, and the full coding scheme are provided in Supplemental material S1.
Data analysis
Statistical analyses were performed using IBM SPSS 27.0. The Shapiro–Wilk test was applied to assess the normality of continuous variables. Data are presented as mean ± standard deviation (SD) for normally distributed variables, median (range) for non-normally distributed variables, and counts (proportions) for categorical variables.
Given the non-normal distribution of the data, non-parametric tests were employed for group comparisons. The Kruskal–Wallis test was used for multigroup comparisons, with the effect size reported as η2H. 27 If significant, post hoc pairwise comparisons were conducted using Dunn's test with Bonferroni correction, with the effect size calculated as r. 28 The Mann–Whitney U test was used for two-group comparisons, with r likewise reported as the effect size. Effect sizes were interpreted according to Cohen's criteria: for η2H, 0.01 (small), 0.06 (medium), and 0.14 (large); for r, 0.1 (small), 0.3 (medium), and 0.5 (large).27,28
Correlations were assessed using Spearman's rank correlation coefficient. Stepwise regression (bidirectional; entry p < 0.05, removal p > 0.10) was used to identify predictors of PEMAT-A/V Understandability (PEMAT-U) and PEMAT-A/V Actionability (PEMAT-A) scores. Multicollinearity was acceptable (variance inflation factors (VIF) < 5). Statistical significance was set at p < 0.05 (two-tailed).
Figures and charts were created using OriginPro2024 software (OriginLab Corporation, Northampton, MA, USA).
Results
A total of 83 TikTok videos on MD were included (Figure 1). These videos garnered substantial public engagement, with a cumulative 308,138 interactions. The median video duration was 66 seconds (range 6–1083), and the median online persistence was 434 days (Table 1).

Search strategy and video screening procedure.
General characteristics of the videos.

GQS: Global Quality Score; mDISCERN: modified DISCERN; PEMAT: Patient Education Materials Assessment Tool; VIQI: Video Information and Quality Index.
Healthcare professionals dominated content creation (91.6%, 76/83 videos), whereas medical institutions contributed 6.0% (5/83) and news media 2.4% (2/83) (Figure 2(a)). Among physician-uploaded videos, otolaryngologists represented the primary specialty (61.8%, 47/76), followed by neurologists (22.4%, 17/76) and TCM practitioners (11.8%, 9/76), with senior clinicians (chief/associate chief physicians) producing 73.7% (56/76) of physician-led content (Figure 2(b)). Analysis of presentation formats revealed limited diversity, with solo narration accounting for 55.4% (46/83) of videos and medical scenarios comprising 18.1% (15/83), while participatory formats were notably absent (Figure 2(c)).
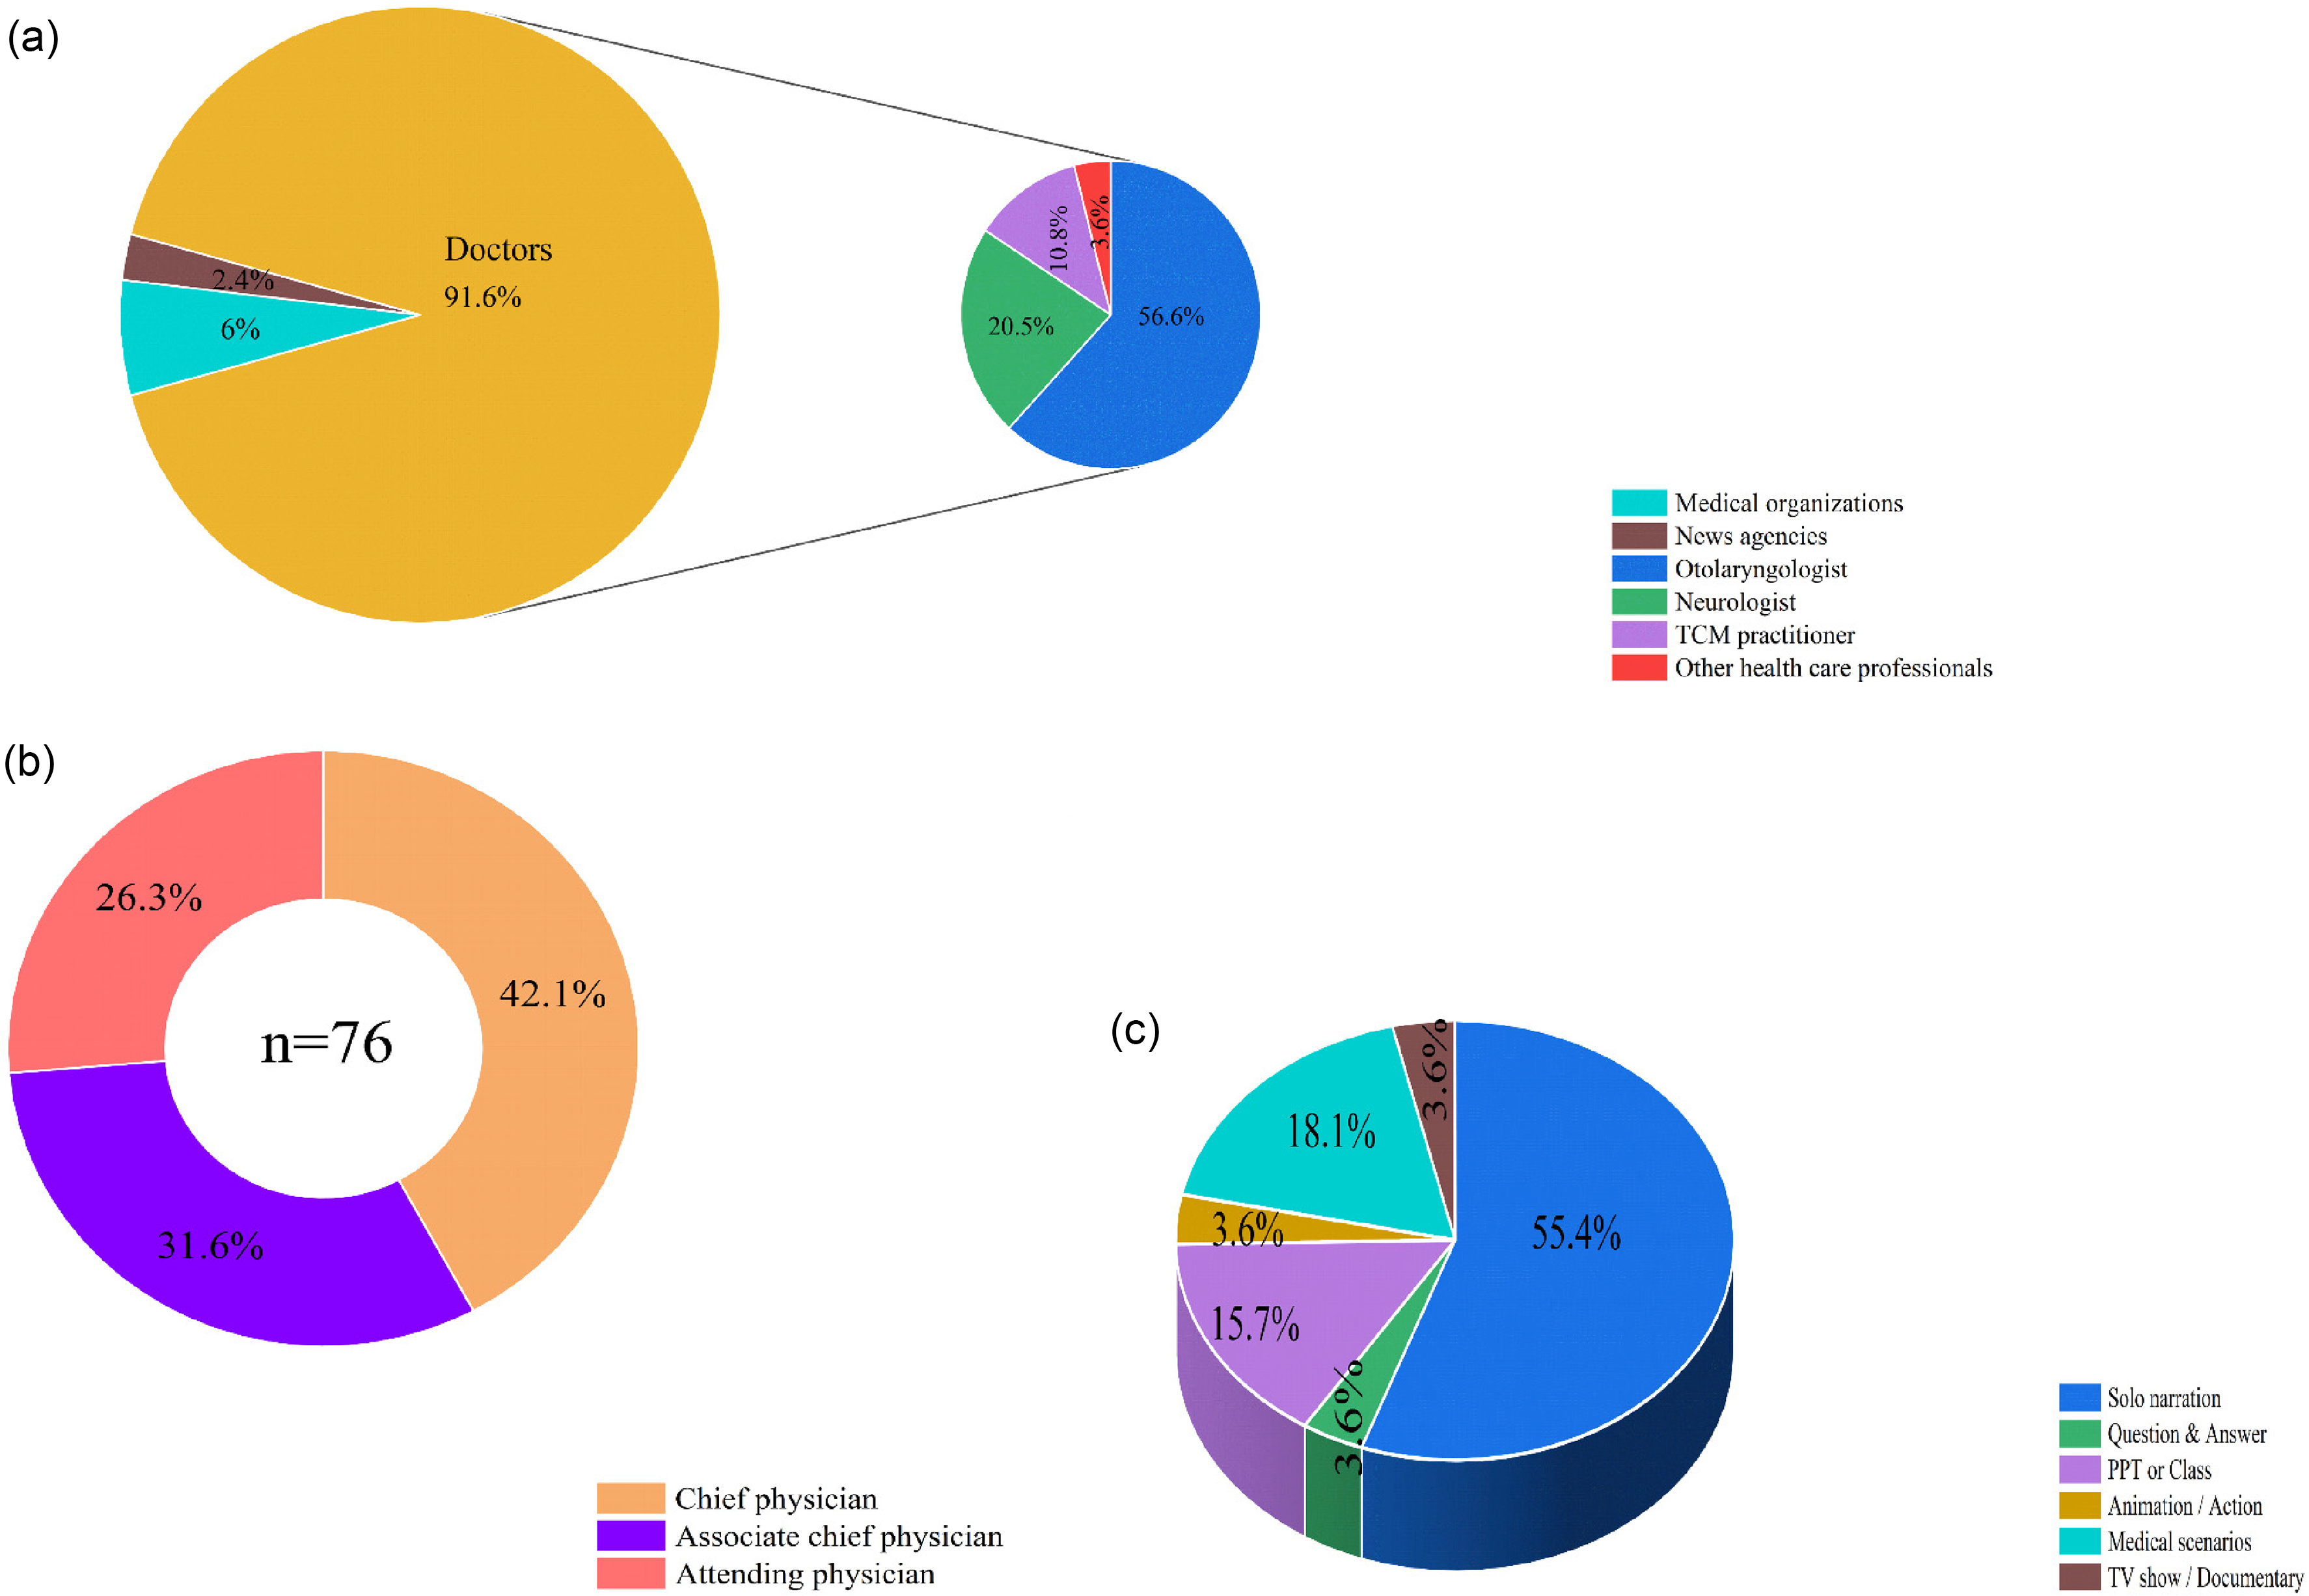
Characteristics of TikTok videos related to Meniere's disease. (a) Distribution of video sources and physician uploaders. (b) Professional titles of physicians appearing in videos. (c) Video presentation styles.
General data comparisons
Medical specialty emerged as the most significant factor influencing viewer engagement. Specifically, neurologists generated significantly higher normalized engagement per second than otolaryngologists. This difference was statistically significant for likes (adj. p = 0.035, r = 0.345), favorites (adj. p = 0.015, r = 0.379), and shares (adj. p = 0.021, r = 0.366). Additionally, a nonsignificant trend favoring TCM practitioners over otolaryngologists was also observed.
For professional title, attending physicians showed a nonsignificant tendency for higher favorites per second than chief physicians. However, a significant difference was noted in video duration, as their videos were significantly longer than those by associate chief physicians (adj. p = 0.002, r = 0.516). News agency videos, despite high raw engagement, showed no significant effect due to small sample size (n = 2).
In terms of presentation format, video format showed no overall effect on normalized engagement rates. Nevertheless, the higher absolute engagement seen in monologue and Q&A formats (Supplemental Table 1) corresponded to their significantly longer duration compared to PPT/Class-style videos (all adj. p < 0.05, r > 0.38).
Video categorization and assessment of video quality and reliability
TikTok videos exhibited high originality (97.6%), with 63.9% focusing on single topics. Symptoms constituted the most prevalent subject (47%), predominantly presented by senior clinicians (chief/associate chief physicians), while examination/diagnosis ranked second (34.9%), frequently addressing differential diagnosis of MD versus vestibular migraine/Benign Paroxysmal Positioning Vertigo (BPPV) (Table 2). Quality assessment yielded moderate scores (Table 1): VIQI (mean 11.16, range 8–15), GQS (mean 3.43, range 2–5), and mDISCERN (mean 2.99, range 2–5). PEMAT analysis demonstrated higher understandability (PEMAT-U: mean 73.73%) than actionability (PEMAT-A: mean 51.00%), indicating clear information delivery but insufficient actionable guidance. Inter-rater reliability was robust across instruments (ICC range: 0.780–0.946).
Categorization and scores of the videos.

mDISCERN: modified DISCERN; PEMAT: Patient Education Materials Assessment Tool; VIQI: Video Information and Quality Index.
Subgroup analyses revealed significant variations in video quality across multiple dimensions (Table 3 and Figures 3–5). Physicians achieved higher GQS scores than news organizations (adj. p = 0.030, r = 0.291). Among physician specialties, otolaryngologists attained superior GQS relative to TCM practitioners (adj. p = 0.027, r = 0.379) and demonstrated significantly higher PEMAT-U scores than both neurologists (adj. p = 0.017, r = 0.374) and TCM practitioners (adj. p = 0.007, r = 0.433). Regarding professional rank, attending physicians outperformed both chief physicians and associate chief physicians across all core quality metrics. Specifically, relative to chief physicians, attending physicians had higher scores in VIQI (adj. p = 0.010, r = 0.409), GQS (adj. p = 0.015, r = 0.390), PEMAT-U (adj. p = 0.003, r = 0.458), and PEMAT-A (adj. p = 0.017, r = 0.384). The comparisons with associate chief physicians showed similar superior performance for attending physicians. Presentation format also significantly influenced quality: PPT/Class formats had lower VIQI than monologue and medical scenarios (adj. p = 0.002 & 0.017, all r > 0.35), while Q&A formats achieved higher mDISCERN than PPT/Class (adj. p = 0.034, r = 0.741).
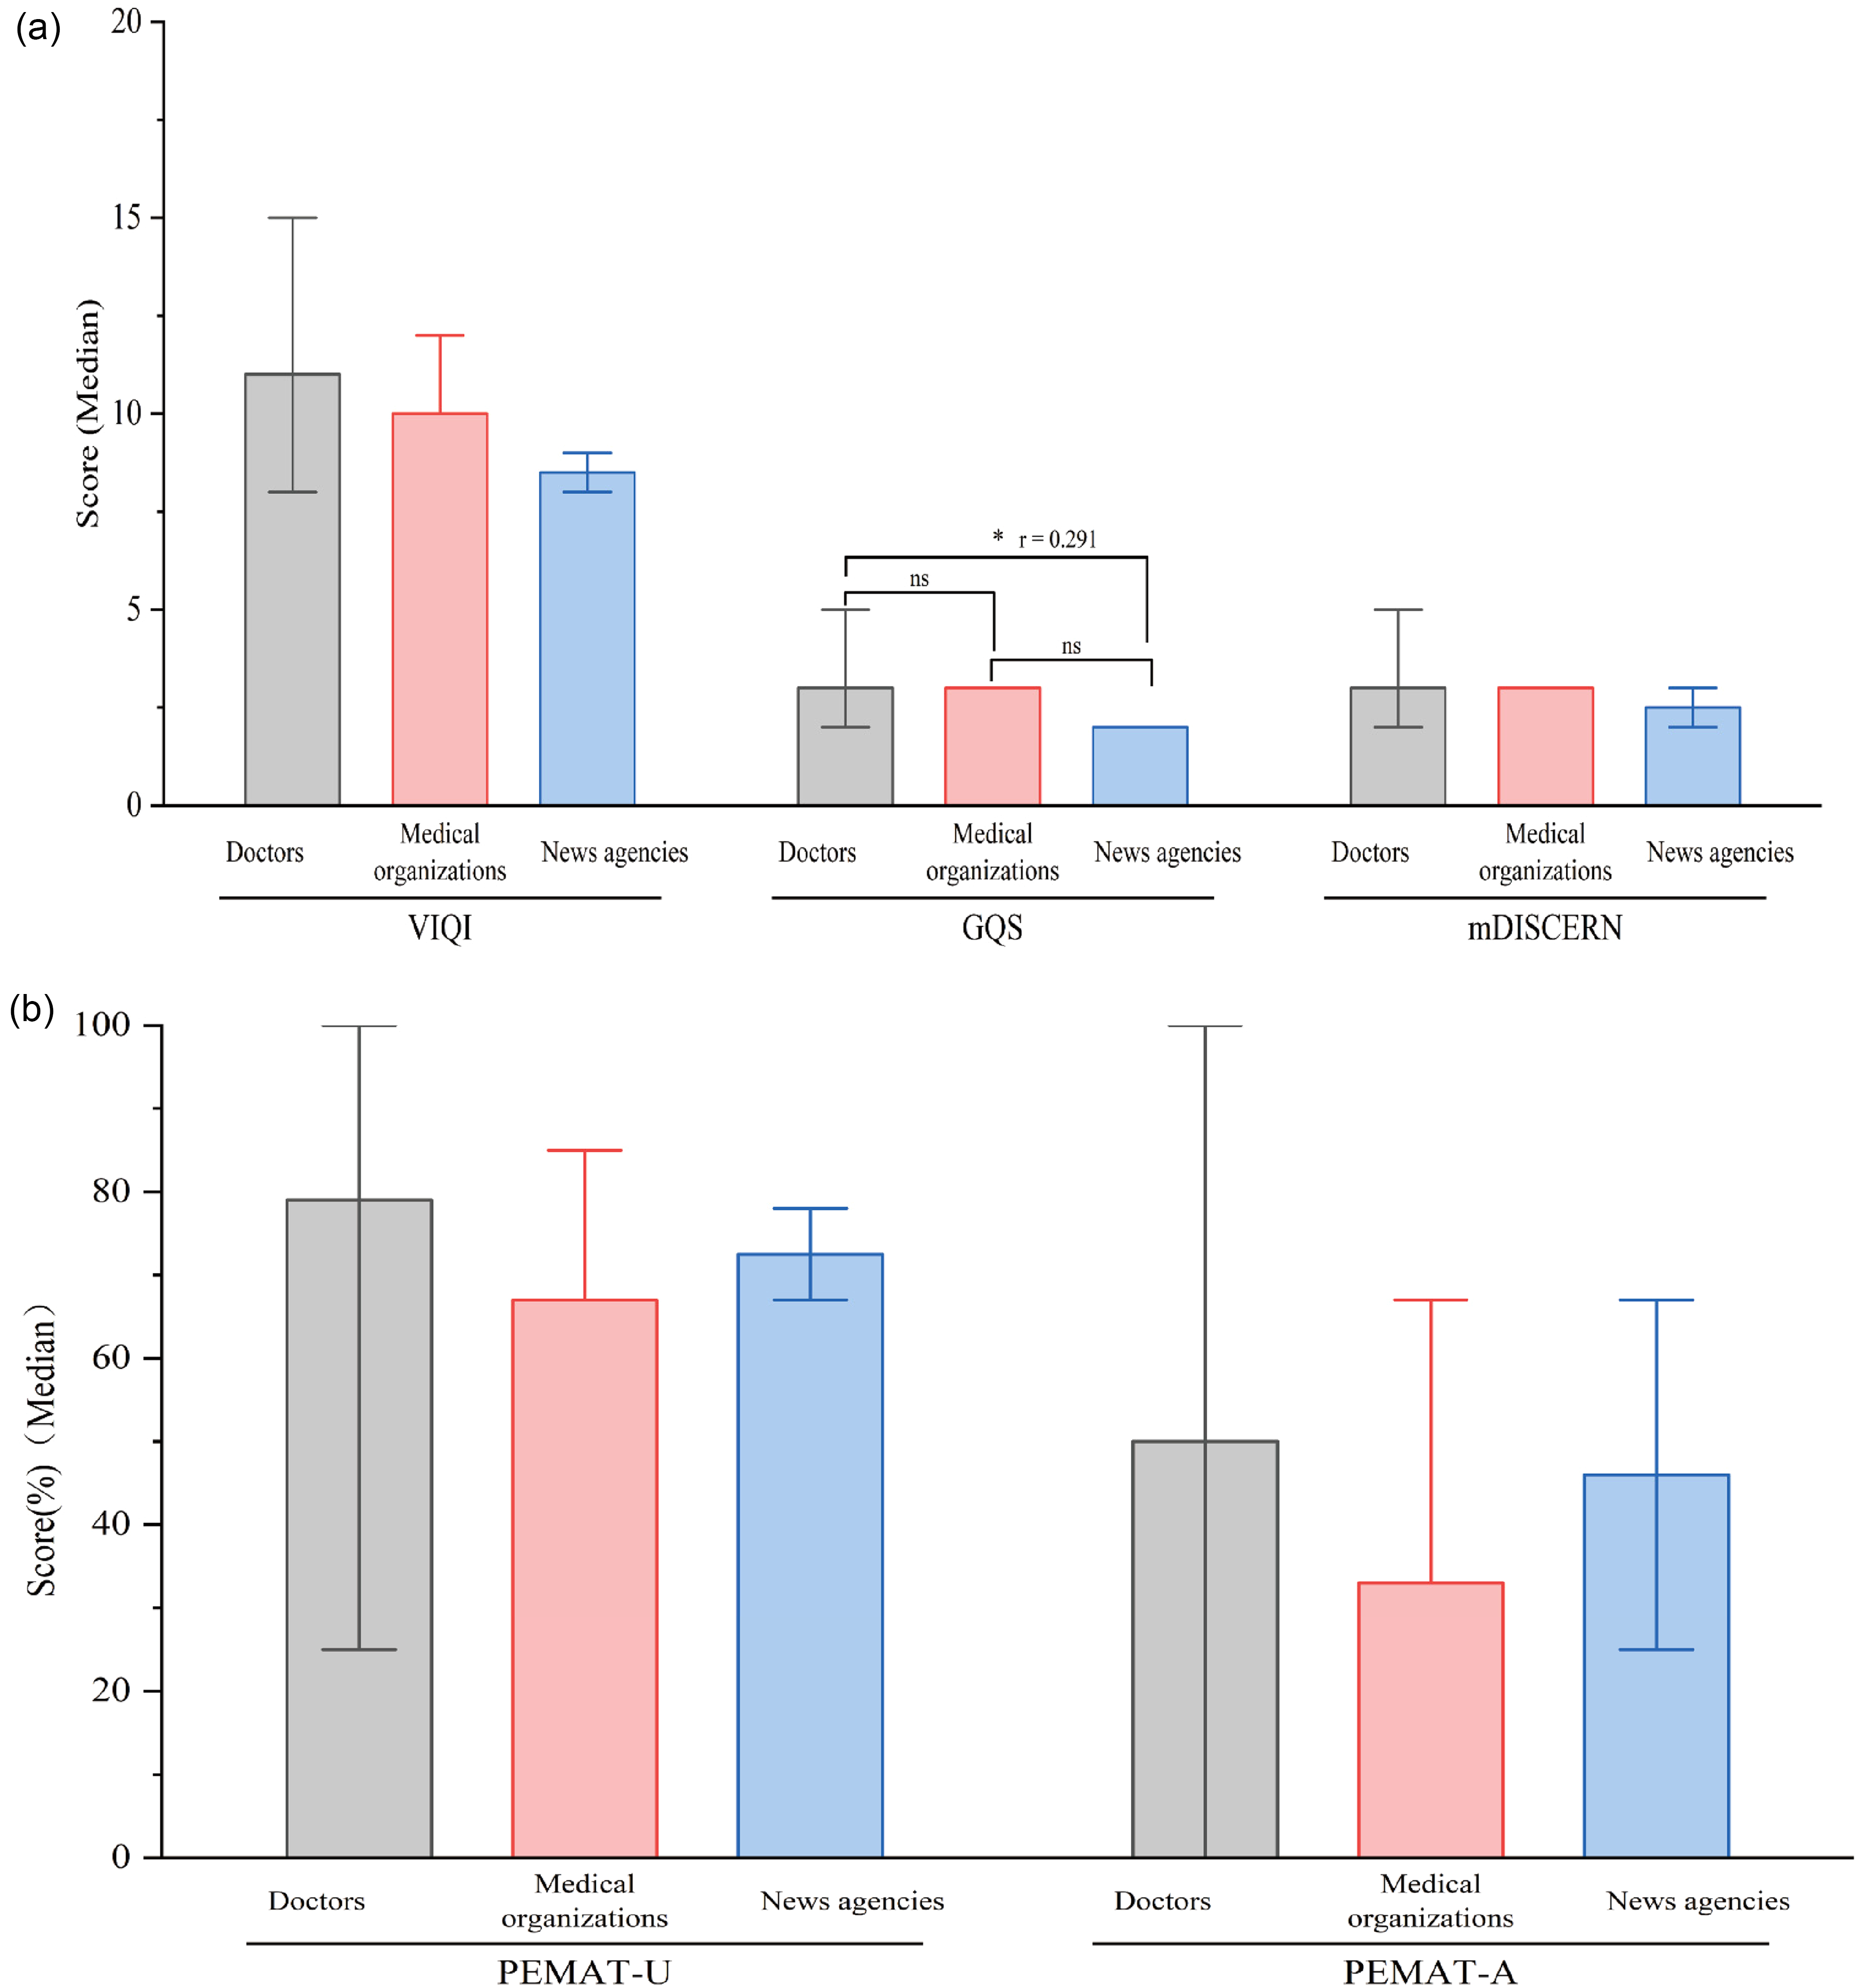
Evaluation of video quality according to uploaders. (a) Comparison of VIQI, GQS, and mDISCERN scores among different uploaders. (b) Comparison of PEMAT-U and PEMAT-A scores among different uploaders (the error bars represent the minimum to maximum values). GQS: Global Quality Score; mDISCERN: modified DISCERN; PEMAT: Patient Education Materials Assessment Tool; VIQI: Video Information and Quality Index.

Assessment of video quality based on medical discipline. (a) Comparison of VIQI, GQS, and mDISCERN scores among different doctors and other healthcare professionals. (b) Comparison of PEMAT-U and PEMAT-A scores among different doctors and other healthcare professionals (the error bars represent the minimum to maximum values). GQS: Global Quality Score; mDISCERN: modified DISCERN; PEMAT: Patient Education Materials Assessment Tool; VIQI: Video Information and Quality Index.

Assessment of video quality based on professional titles. (a) Comparison of VIQI, GQS, and mDISCERN scores among different professional titles. (b) Comparison of PEMAT-U and PEMAT-A scores among different professional titles (the error bars represent the minimum to maximum values). GQS: Global Quality Score; mDISCERN: modified DISCERN; PEMAT: Patient Education Materials Assessment Tool; VIQI: Video Information and Quality Index.
Quality assessment of videos based on uploaders and presentation format.

GQS: Global Quality Score; mDISCERN: modified DISCERN; PEMAT: Patient Education Materials Assessment Tool; TCM: Traditional Chinese Medicine; VIQI: Video Information and Quality Index.
Correlation and stepwise regression analysis
Spearman correlation analysis was conducted to evaluate relationships among video characteristics, accounting for categorical variables and non-normally distributed data. As shown in the correlation heatmap (Figure 6), strong correlations (r > 0.8) were observed among the engagement metrics (likes, comments, favorites, and shares). Their correlations with VIQI were moderate (r = 0.4–0.7), and were even weaker with video length (r = 0.24–0.50). Significant negative correlations were observed between physician title and both engagement metrics and quality parameters, specifically PEMAT-U scores (r = −0.29, p < 0.01), PEMAT-A scores (r = −0.31, p < 0.05), and GQS scores (r = −0.25, p < 0.05).

Correlations between all video parameters and quality assessment scores.
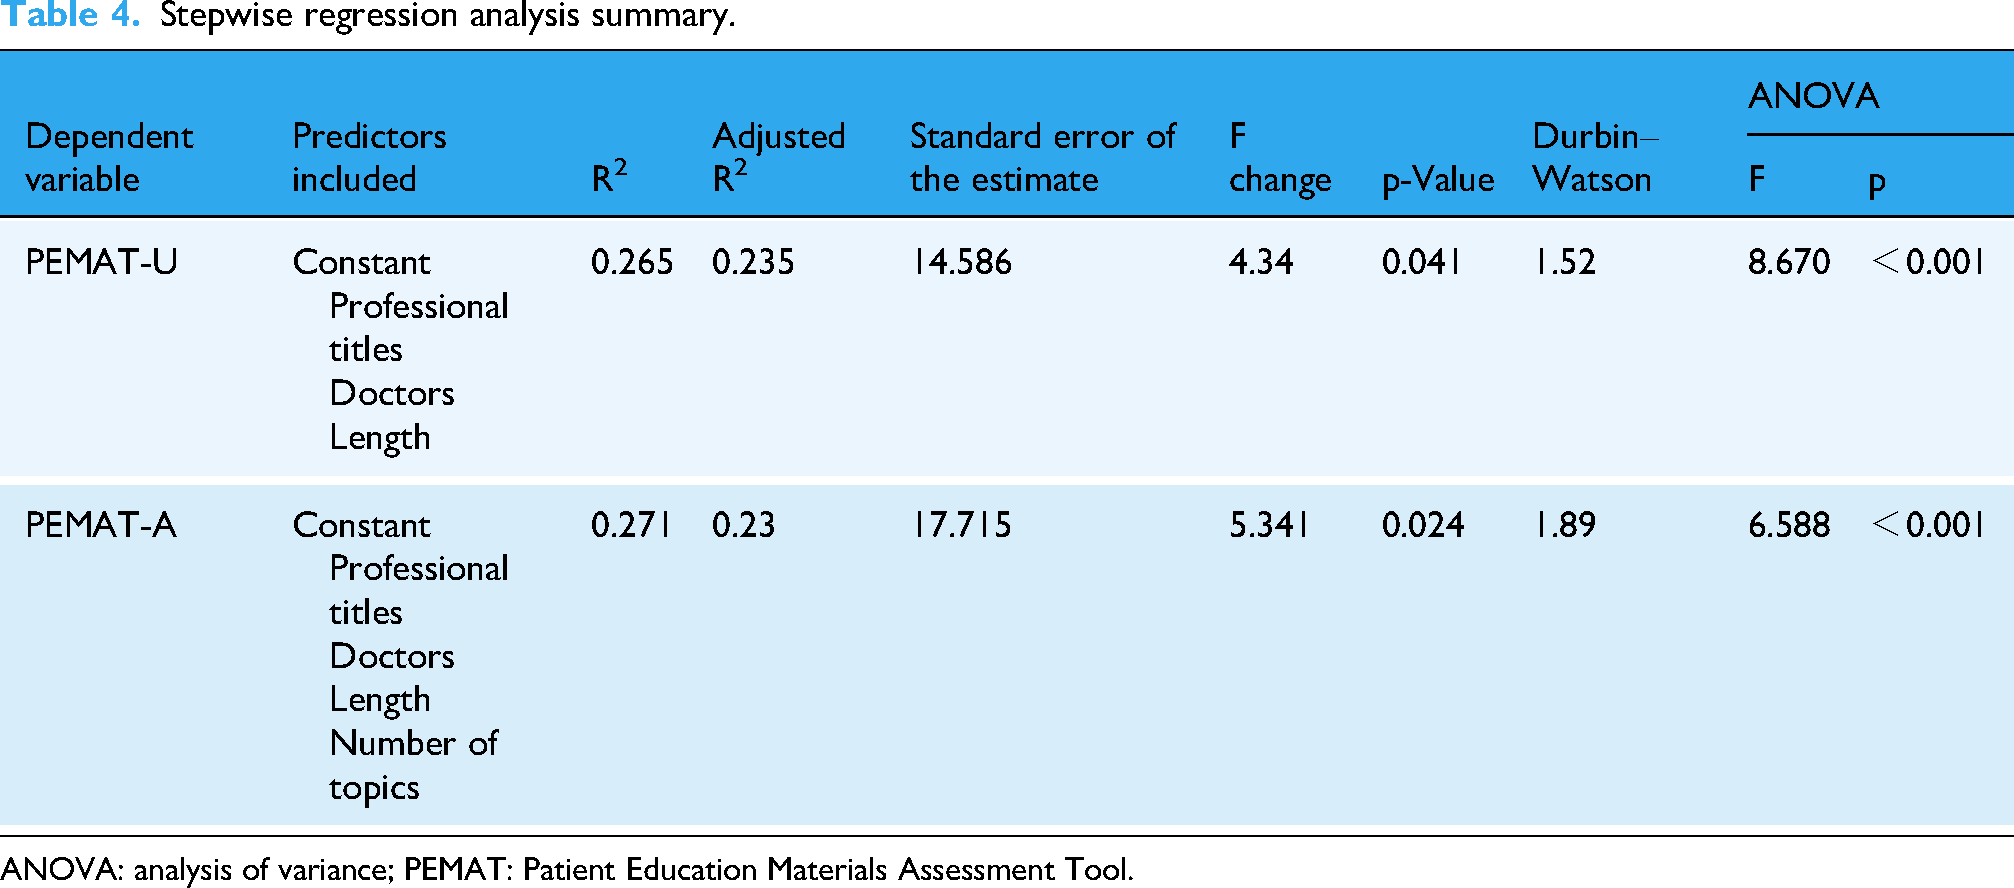
PEMAT-U scores correlated significantly with Professional title, Doctors/Physicians, and Length, while PEMAT-A scores correlated with Professional title, Doctors, Length, and Number of topics. Stepwise regression analysis produced two predictive models (Table 4): PEMAT-U = 66.389 − 5.711 × Professional titles − 8.118 × Doctors + 0.025 × Length. PEMAT-A = 63.469 − 6.474 × Professional titles − 8.506 × Doctors + 0.037 × Length + 8.298 × Number of topics.
Stepwise regression analysis summary.
ANOVA: analysis of variance; PEMAT: Patient Education Materials Assessment Tool.
The Durbin–Watson statistics (1.52 and 1.89) indicated no significant residual autocorrelation. Collinearity diagnostics revealed no multicollinearity concerns, with tolerance values exceeding 0.8 and VIF below 2.0 for all predictors (Table 5), supporting model validity.
Stepwise regression coefficients, statistical significance, and collinearity assessment.

B: unstandardized regression coefficient; β: standardized regression coefficient; CI: confidence interval; PEMAT: Patient Education Materials Assessment Tool.
Discussion
The utilization of social media in public health education has increased substantially, with digital videos becoming a significant medium for patient education over recent decades. 29 Within otolaryngology-head and neck surgery, multiple studies have evaluated the educational value of YouTube and TikTok videos addressing conditions including cholesteatoma, 30 pediatric tonsillectomy, 31 tympanostomy tubes, 32 rhinoplasty, 33 tinnitus, 34 nasopharyngeal carcinoma, 35 and laryngeal cancer. 36 However, a critical evidence gap persists regarding social media content for MD, with no prior evaluations identified in this domain.
Key findings
This cross-sectional study demonstrates that most TikTok videos about MD originate from certified physicians, predominantly otolaryngologists or neurologists, with all physician identities verified by TikTok's authentication system to ensure professionalism and scientific credibility. Our comprehensive assessment using four validated quality evaluation tools revealed substantial opportunities for improvement in MD-related video quality. The analysis incorporated novel determinants frequently overlooked in existing literature—including content originality, creator certification status, video presentation format, physician specialty, and professional title hierarchy. These findings provide actionable guidance for healthcare consumers seeking reliable health information while offering evidence-based insights for content creators, platform designers, and public health practitioners developing digital health communication strategies.
Analysis of video characteristics and viewer engagement
Analysis of 83 TikTok videos revealed substantial public demand, evidenced by 308,138 cumulative interactions. The median video duration of 66 seconds aligns with platform attention patterns, while median online persistence of 434 days confirms long-term health information accessibility—critical for sustained public health communication. 6
Healthcare professionals produced 91.6% of the content, a finding consistent with other studies in terms of the overall proportion. 37 The content was primarily created by otolaryngologists (61.8%) and neurologists (22.4%), among whom senior clinicians (chief/associate chief physicians) created the majority of physician-led videos (73.7%). This distribution highlights specialized expertise requirements but also reveals participation disparities across professional ranks. Content diversity was limited, marked by the dominance of solo narration (55.4%) and the complete absence of participatory formats, which reduces opportunities for interactive health education.
Medical specialty emerged as the most significant factor influencing viewer engagement per second in our analysis. This study represents the first in this field to normalize engagement rates by video duration, thereby controlling for a key confounding variable. Neurologists generated consistently higher engagement than otolaryngologists, with significant effects for likes, favorites, and shares (all adj. p < 0.05, r > 0.3). This disparity likely stems from differing content approaches and public health interests. Neurologists frequently address high-burden, prevalent conditions such as migraines, stroke, and cognitive disorders, which attract broad public interest. Public perception also plays a role, as disorders presenting with vertigo (e.g. MD) are often mistakenly attributed to neurological causes, further directing audience attention to neurologists. In contrast, otolaryngology content more commonly featured clinical consultations or procedural videos, which may hold narrower appeal for general health education seekers.
Beyond the primary specialty-based findings, other factors showed limited or nonsignificant effects. Regarding professional title, a significant difference was observed in video duration, where attending physicians produced longer videos than associate chief physicians (adj. p = 0.002, r = 0.52). This aligns with their differing content strategies. Attending physicians primarily developed purpose-built educational content, whereas senior clinicians predominantly uploaded videos derived from clinical consultations. Similarly, news agencies produced videos with markedly higher raw engagement metrics, but these comparisons did not reach statistical significance, likely due to the very small subgroup size (n = 2).
Analysis of presentation format showed that formats such as monologue and Q&A were associated with longer videos and higher absolute engagement (Supplemental Table 1). However, this did not result in a statistically significant effect on normalized engagement per second (Table 6), indicating that the observed benefit is mediated primarily by increased video duration.
Normalized engagement metrics of videos based on uploaders and presentation format.

TCM: Traditional Chinese Medicine.
Collectively, these findings underscore several key imperatives for public health communication on short-video platforms. These include optimizing content duration for platform attention patterns, diversifying formats to enhance engagement, and supporting clinicians in developing dedicated educational materials rather than repurposing clinical encounters. In this context, the currently low participation rates from medical institutions (6.0%) and news media (2.4%) highlight valuable yet underutilized channels. Effectively leveraging these channels could significantly scale the dissemination of quality health information.
Video categorization and quality assessment
Tool selection remains critical for evaluating health communication quality. While PEMAT, VIQI, GQS, and mDISCERN are widely employed,25,38–40 their application to short-form video platforms has limitations. This is primarily due to a mismatch between their criteria for comprehensive information and the concise, narrative-driven nature of short-form media, which may undervalue videos optimized for platform engagement. Correspondingly, TikTok videos demonstrated accessibility advantages but contained constrained information density, resulting in suboptimal quality scores.
VIQI assessment revealed TikTok's high user engagement strengthened performance on VIQI-1 metrics. However, monotonous presentation styles, which relied heavily on verbal narration and offered limited visual enhancements, reduced VIQI-3 scores. Attending physicians’ videos, featuring more diverse presentation methods, achieved significantly higher VIQI scores than senior colleagues.
mDISCERN evaluation indicated moderate but unsatisfactory credibility. Strict physician verification boosted mDISCERN-1 and mDISCERN-3 scores, yet critical deficiencies emerged in mDISCERN-4/5 due to absent information sources and TikTok's lack of mandatory review mechanisms. This underscores the public health imperative for transparent source documentation.
GQS assessment yielded an average score of 3.43 (range 2–5), consistent with existing literature. 41 Videos produced by physicians demonstrated superior quality compared to news media. Specifically, otolaryngologists generated higher-quality content than neurologists and TCM practitioners, and attending physicians outperformed senior colleagues (Table 3 and Figures 3–5). This observed advantage likely stems from complementary factors: otolaryngologists benefit from content that is more closely aligned with their core surgical specialty, whereas attending physicians may leverage their generally younger profile and greater familiarity with social media as digital natives to produce more comprehensible content.
PEMAT assessment revealed adequate understandability (73.73%) but inadequate actionability (51%), falling below the 70% clinical acceptability threshold. 25 This “understandability-actionability gap” is a recurring pattern in evaluations of patient education materials across digital platforms, aligning with similar findings where providing clear information proves easier than outlining concrete, actionable steps.7,41 Within our results, attending physicians’ videos and solo narration/medical scenarios achieved higher PEMAT-U scores, attributed to diversified production styles and detailed explanations. Conversely, senior physicians’ outpatient-derived content and text-heavy PPT formats underperformed. Moreover, otolaryngologists showed higher PEMAT-A scores than TCM practitioners before multiplicity adjustment (p < 0.05), a trend consistent with prior findings of lower-quality scores for TCM-related health content on short-video platforms. 42
In summary, educational videos produced by otolaryngology attending physicians, particularly those using solo narration, achieve higher quality. This high-quality content significantly increases public awareness of MD, enabling patients to seek initial specialty care from otolaryngology rather than neurology departments. Precise first-contact alignment corrects historical referral discrepancies and optimizes clinical pathways.
Correlation and stepwise regression analysis of video quality and characteristics
Spearman correlation analysis showed significant associations between TikTok video characteristics and quality metrics. Weak to moderate positive correlations emerged between video length and engagement metrics. While not strong, this trend tentatively aligns with established patterns in health information dissemination, where greater engagement often predicts broader reach, possibly indicating that increased video length contributes to content value or viewer retention. 43 Weaker correlations between video features and PEMAT-A scores indicate audience engagement does not necessarily translate to actionable health content. Observed negative correlations between professional titles and both engagement metrics and PEMAT-U/A scores warrant careful interpretation, as these may reflect methodological considerations rather than causal relationships.
Stepwise regression identified “Length,” “Professional titles,” “Doctors,” and “Number of topics” as significant predictors of PEMAT scores. The predictive models demonstrated substantial explanatory power, as evidenced by the regression results (Table 4). The models indicate that professional titles and doctor status were significant negative predictors. However, these negative coefficients should be interpreted cautiously, as they may reflect statistical coding conventions (e.g. 1 = attending and 3 = chief physicians) rather than intrinsic quality differences. Overall, these findings highlight how platform-specific features and content design choices influence health communication effectiveness.
Limitations
While this study utilized four validated assessment tools and involved three clinician raters, its findings are constrained because these tools lack formal validation for short-video formats on Chinese platforms. Potential systemic biases may therefore persist despite rigorous methodology. The analyzed content may not fully represent all MD-related topics, and our correlational design precludes causal inferences. Although searches were conducted while logged out to standardize the process and minimize individual-level personalization, TikTok's underlying recommendation algorithm remains unaccounted for in this analysis and could influence content visibility and engagement patterns as a potential source of bias. Platform user demographics and their variable health content interactions may further limit generalizability. Finally, the cross-sectional design with single-day sampling captures only a temporal snapshot, potentially missing longitudinal content evolution. This specific methodological limitation underscores the need for future research to develop and validate assessment tools specifically adapted to the Chinese social media landscape.
Conclusion
Most MD-related TikTok content originates from certified physicians, ensuring foundational credibility. However, overall quality remains less than optimal across multiple validated metrics (PEMAT-A: 51%; GQS: 3.43/5), revealing significant gaps in actionable guidance and production value. The weak correlation between dissemination metrics and quality scores underscores that popularity does not equate to reliability. While the derived PEMAT predictive equations offer valuable insights for content design, their application requires contextual caution. These findings highlight critical digital health needs: (1) content creators should enhance informational depth and presentation quality, (2) platforms must implement robust medical content review systems, and (3) future research should explore algorithm-mediated health information dissemination to optimize public health communication efficacy.
Supplemental Material
sj-docx-1-dhj-10.1177_20552076261418919 - Supplemental material for Physician-dominated yet suboptimal: Evaluating the quality of Meniere's disease information on TikTok in China
Supplemental material, sj-docx-1-dhj-10.1177_20552076261418919 for Physician-dominated yet suboptimal: Evaluating the quality of Meniere's disease information on TikTok in China by Xin Wang, Dongling Lian and Zeyang Liu in DIGITAL HEALTH
Footnotes
Acknowledgements
The authors would like to express their gratitude to the video uploaders for their contributions to public health.
Ethical approval
No formal ethical approval was required for this study. The data comprised only publicly accessible TikTok videos that contained no personally identifiable information; accordingly, the project was classified as exempt from NHS Research Ethics Committee review following the UK Health Research Authority decision tool. 12
Contributorship
XW was involved in conceptualization, methodology, investigation, formal analysis, and writing—original draft; DLL in investigation and validation; and ZYL in supervision and writing—review & editing. All authors read and approved the final manuscript.
Funding
The authors received no financial support for the research, authorship, and/or publication of this article.
Declaration of conflicting interests
The authors declared no potential conflicts of interest with respect to the research, authorship, and/or publication of this article.
Data availability statement
The data for this study, derived from the TikTok platform, have been anonymized to protect privacy, with URLs and titles retained for research integrity. Because of privacy concerns, these data are not publicly accessible. However, we are committed to sharing the data upon request for legitimate research purposes, in accordance with privacy protection principles and data sharing policies. Interested researchers should contact the corresponding author for access.
Guarantor
XW.
Supplemental material
Supplemental material for this article is available online.
References
Supplementary Material
Please find the following supplemental material available below.
For Open Access articles published under a Creative Commons License, all supplemental material carries the same license as the article it is associated with.
For non-Open Access articles published, all supplemental material carries a non-exclusive license, and permission requests for re-use of supplemental material or any part of supplemental material shall be sent directly to the copyright owner as specified in the copyright notice associated with the article.