
Abstract
Background
This study leverages machine learning and cytokine profiles to differentiate liver and renal function abnormalities in the aging population, aiming for advancements in early detection techniques.
Methods
The analysis involved data from 760 participants, employing logistic regression, random forest, lasso regression, extreme gradient boosting, and support vector machines to create diagnostic models. Cytokine levels were measured via ELISA, alongside liver and renal clinical function tests. The data were randomly split 3:1 into training and hold-out validation sets; Synthetic Minority Over-sampling Technique (SMOTE) was applied exclusively to the training set to mitigate class imbalance. Models were assessed on precision, recall, F1 score, specificity, and the area under the curve (AUC).
Results
Lasso regression was notably effective in identifying renal function abnormalities, delivering AUCs of 0.895 for males and 0.940 for females, pointing to its robustness in feature selection and model accuracy. For liver function, logistic regression was most accurate, with AUCs of 0.918 for males and 0.794 for females, identifying VCAM-1, REG4, Thrombomodulin, Notch-3 for males, and GDF-15, LDL R, CA125, PON1 for females as key discriminative cytokines. These results illustrate the models’ capability in discerning critical biomarkers for early detection, with performance improved by SMOTE through correction of class imbalance in the training data.
Conclusion
Integrating machine learning with cytokine profiling emerges as a highly promising method for early detection of liver and renal abnormalities in the aging population, suggesting significant potential for improving preventive healthcare outcomes.
Introduction
As the global population ages at an accelerated pace, the health issues of the aging population are receiving increasing attention from society and the medical community. 1 In particular, the decline in liver and renal function with age significantly impacts the quality of life of the aging population. Abnormal liver and renal functions are not only related to the daily living abilities of the aging population but also serve as precursors to a variety of serious health issues, including the development of chronic diseases, increased surgical risks, and decreased overall survival rates.2,3 Furthermore, impaired liver and renal function is a key risk factor for potentially inappropriate medications (PIMs) in the aging population. A recent study highlighting the high prevalence of PIMs in geriatric outpatients, as per the Beers Criteria 2023, underscores the critical need for precise assessment of organ function to optimize drug therapy and prevent adverse drug events. 4 Therefore, early identification of liver and renal function abnormalities are crucial for improving the quality of life of the aging population, extending their healthy lifespan, and ensuring medication safety.
In recent years, machine learning techniques have shown tremendous potential in the field of medical research, especially in disease prediction and the identification of biomarkers.5–8 These advanced computational methods are capable of handling vast amounts of complex biomedical data, revealing potential correlations between biomarkers and disease states. Against this backdrop, this study focuses on exploring the application of machine learning methods in identifying liver and renal function abnormalities in the aging population based on cytokine profiles. Cytokines, as crucial molecules regulating immune responses, cell growth, and cell death, may offer early warnings for liver and renal function abnormalities through their expression patterns in the aging population.9–11
Building upon our preliminary research, which identified 15 cytokine aging biomarkers in males and 10 in females, this study conducted a comprehensive analysis on 760 individuals. Utilizing ELISA, we measured the previously identified cytokines in the participants’ plasma. Alongside, we performed clinical laboratory tests related to liver and renal function. Leveraging the data obtained from both cytokine measurements and clinical tests, we employed five machine learning models—logistic regression, random forest, lasso regression, extreme gradient boosting (XGBoost), and support vector machines (SVMs)—to develop diagnostic models for liver and renal function.
The objectives of this study were not only to enhance the accuracy of assessing liver and renal function abnormalities but also to deepen our understanding of the mechanisms of liver and renal diseases in the aging population, providing a scientific basis for future prevention strategies and treatment plans. By integrating machine learning techniques with cytokine analysis, this research hopes to offer new perspectives and tools for the health management of the aging population.
Materials and methods
Study subjects
This study was conducted and reported in accordance with the TRIPOD-AI (Transparent Reporting of a multivariable prediction model for Individual Prognosis Or Diagnosis - Artificial Intelligence) and STARD-AI (Standards for Reporting of Diagnostic Accuracy Studies - Artificial Intelligence) guidelines.12,13
All subjects in this study were selected from 2018 to 2022 from two hospitals in Beijing and Changsha, China. Data were available for all subjects concerning their self-reported personal medical history as well as their physical function, lifestyle and other information obtained during physical examinations and questionnaires, and the patients underwent hematology, biochemistry and other laboratory tests. The inclusion criteria were as follows: (1) ≥ 60 years old with signed informed consent given, (2) no mental disorders, and (3) no history of alcoholism or drug abuse. To ensure that unhealthy individuals were not included in the analysis, the following exclusion criterion was applied: a medical history of diabetes mellitus, heart attack, stroke, chronic nephritis, Parkinson's disease, dementia, or cancer. Given the cross-sectional nature of our study, the model outcomes represent concurrent risk estimates or discrimination between normal and abnormal groups, rather than assessments of concurrent status of future events.
Data collection and sample detection
Basic information, such as the age, education and lifestyle, was obtained through questionnaires filled out by uniformly trained investigators according to standard protocols. The cognitive function was assessed using the Montreal Cognitive Assessment 5-min protocol. 14 The body mass index was calculated based on the height and weight and measured using standard methods and equipment. The waist–hip ratio (WHR) is calculated by dividing the waist circumference by the hip circumference. Systolic and diastolic blood pressure (mmHg) were measured using an Omron HBP1300 blood pressure monitor (OMRON Corporation, Kyoto, Japan). Blood samples were obtained and tested by local medical institutions, where fasting glucose (GLU), serum creatinine (SCr), blood urea nitrogen (BUN), alanine aminotransferase (ALT), aspartate aminotransferase (AST), gamma-glutamyltransferase (GGT), and alkaline phosphatase (ALP) levels were measured using a fully automated biochemical analyzer (Hitachi LABOSPECT008AS; Hitachi, Tokyo, Japan). Plasma samples were obtained after centrifugation at 1500×g at 4 °C and stored at −80 °C until assayed. The estimated glomerular filtration rate (eGFR) was calculated using the chronic kidney disease (CKD)-EPI Creatinine Equation (2021). 15
bIG-H3, CEACAM-1, CMG-2, DPPIV, GDF-15, IGFBP-2, IL-23 R, L-selectin, Notch-3, PSA-total, Reg4, ST8SIA1, VCAM-1, VEGF R3, 6Ckine, CA125, CD14, CD99-L2, FSH, LDL R, NAP-2, PON1, and VEGF-C levels were measured using ELISA kits (RayBiotech, Norcross, GA, USA), along with thrombomodulin levels (R&D Systems, Minneapolis, MN, USA). The specificity of the ELISA kits was verified by the manufacturer. The analytical specificity of the ELISA kits, as reported by the manufacturers, showed no significant cross-reactivity or interference with other analytes. No additional in-house validation of cross-reactivity was performed in this study. ELISA experiments were performed using the recommended serum dilution for each case, according to the manufacturer's instructions. The absorbance at 450 nm was measured using a microplate reader (Thermo Fisher, Waltham, MA, USA).
The laboratory technicians performing the ELISA assays were blinded to the clinical group assignments (normal vs. abnormal) of the participants. Similarly, the researchers conducting the machine learning analysis were blinded to the sample identities during model training and validation.
Enrichment analysis
Pathway and GO enrichment analysis of cytokines was performed via Metascape webtool (https://metascape.org). 16 DisGeNET database (http://www.disgenet.org) were used to obtain cytokine-related diseases. 17
Defining health and function abnormalities criteria
The reference intervals for defining normal liver and renal function were established based on widely accepted international clinical guidelines. The renal function criteria, particularly the eGFR cutoff, are aligned with the KDIGO CKD guideline,18,19 while the liver enzyme thresholds are consistent with recommendations from major hepatology associations. 20 To classify individuals within this study, the following standards for normal organ function were applied: GLU ≤ 6.1 mmol/L; eGFR ≥ 60 mL/min/1.73 m2; SCr ≤ 111 μmol/L for males or ≤ 81 μmol/L for females; BUN ≤ 9.5 mmol/L for males or ≤ 8.8 mmol/L for females; ALT ≤ 50 U/L for males or ≤ 40 U/L for females; AST ≤ 40 U/L for males or ≤ 35 U/L for females; ALP ≤ 125 U/L for males or ≤ 135 U/L for females; GGT ≤ 60 U/L for males or ≤ 45 U/L for females. Individuals were categorized into a “liver function abnormality” group if any of the liver function tests (ALT, AST, ALP, or GGT) exceeded these reference intervals, indicating potential liver dysfunction. Individuals with eGFR < 60 mL/min/1.73 m2 (corresponding to CKD stage ≥3) or with SCr or BUN levels outside the specified reference intervals were classified into the “renal function abnormality” group, indicating clinically significant renal impairment. This classification system enabled analysis of the impact of liver and renal dysfunction on overall health in the study participants.
Construction of machine learning models
We initially adopted a random sampling strategy to divide our dataset into a training set and a validation set at a 3:1 ratio for initial model development and evaluation. To ensure robustness and reduce the variance of performance estimates, the entire modeling process was subsequently validated using 10-fold cross-validation on the entire dataset. The performance metrics (e.g. area under the curve (AUC), Sensitivity) reported in the main text are from the hold-out validation set to facilitate direct interpretation and comparison with similar studies that use a single split. The comprehensive cross-validation results, which provide a more generalized estimate of model performance, are detailed in the Supplemental Table S1-S4. All analyses were conducted using R (version 4.3.2; http://www.Rproject.org). Synthetic Minority Over-sampling Technique (SMOTE) over-sampling of the training set is conducted using the “smotefamily” package (1.4.0). SMOTE was applied exclusively to the training set after the 3:1 split. The number of nearest neighbours (k) was set to 5 (package default), and the over-sampling ratio was automatically adjusted to achieve a 1:1 final class ratio in the training set after SMOTE (i.e. the minority class was oversampled to match the size of the majority class). Exact post-SMOTE sample sizes for each of the four subgroups are provided in Supplemental Table S5. Prior to model training, we performed log10 transformation on all cytokine concentrations and continuous clinical variables.
The “stats” package (4.5.0) was applied for logistic regression model construction. Logistic regression is used for binary classification tasks, estimating the probability that a given input belongs to a certain category. The “randomForest” package (4.7–1.2) was applied for random forest model construction. All the indicators included in the diagnostic model were analyzed based on the mean decrease in accuracy and the mean decrease in the Gini coefficient. Random Forest is an ensemble learning method used for both classification and regression tasks, which operates by constructing a multitude of decision trees at training time and outputting the class that is the mode of the classes (classification) or mean prediction (regression) of the individual trees. The models were built using the default parameters of the “randomForest” package, with the number of trees (ntree) set to 500. The number of variables randomly sampled as candidates at each split (mtry) was set to the default value of the square root of the total number of predictors. The “glmnet” package (4.1–9) was applied for lasso regression model construction. *The optimal value of the penalty parameter λ was determined through 10-fold cross-validation on the training set using the cv.glmnet function, with the “lambda.min” criterion (the value of λ that gives the minimum mean cross-validated error) selected for building the final diagnostic model. Using this optimal λ, the diagnostic model was constructed. Lasso regression functions to simultaneously perform feature selection and regularization, effectively identifying the most relevant variables and preventing overfitting for more accurate and interpretable outcomes. The “xgboost” package (1.7.11.1) was applied for XGBoost model construction. XGBoost is an efficient and powerful machine learning library that specializes in addressing classification, regression, and ranking problems using an optimized gradient boosting decision tree algorithm. The models were trained with fixed hyperparameters: a maximum tree depth (max_depth) of 6, learning rate (eta) of 0.3, and 100 boosting rounds (nrounds). These hyperparameters were selected based on a preliminary grid search using fivefold cross-validation on the training set. The objective was set to “binary:logistic” for binary classification. The “e1071” package (1.7–16) was applied for SVM model construction with a linear kernel. SVM are powerful classifiers that separate data into classes by finding the optimal dividing hyperplane, effective even in high-dimensional spaces. The SVM models were built using a linear kernel with the default cost parameter as implemented in the “e1071” package. The cost parameter for the linear kernel SVM was tuned via a grid search using fivefold cross-validation on the training set, and the optimal value was selected for the final model.
To ensure the complete reproducibility of all stochastic processes, fixed random seeds were set independently for each analysis cohort prior to data splitting and model building. The seeds were as follows: 1836 for male liver function, 187 for male renal function, 422 for female liver function, and 1163 for female renal function. This practice guarantees that each modeling pipeline can be exactly replicated. The analysis code is available upon reasonable request from the corresponding author. Confidence intervals for all performance metrics in the hold-out validation set were calculated using 1000 bootstrap resamples (stratified by outcome) to quantify estimation uncertainty.
Evaluation of machine learning models
We calculated precision, recall, F1 score, specificity and AUC, precision-recall area under the curve (PR AUC), and balanced accuracy for each method. The AUC was derived from the Receiver Operating Characteristic (ROC) curve, constructed using the “pROC” package (1.18.5). Area under the receiver operating characteristic curve (AUC) comparisons between models was performed using DeLong's test. Confidence intervals for AUC, sensitivity, and specificity were obtained via 1000 stratified bootstrap resamples. By comparing the estimated results with the actual outcomes, we evaluated the performance and clinical applicability of multiple machine learning models.
Statistical analysis
Statistical analyses were performed using the RStudio software (version 2023.12.1–402), which runs R software. Outliers were removed using the Reed/Dixon method, on the full dataset prior to the train-test split, to prevent any potential data leakage from the validation set. Data normality was tested using the Shapiro–Wilk test and histogram. Age-related trends in cytokines and clinical laboratory parameters were evaluated using Spearman's rank correlation coefficients. The Mann–Whitney test was used to test differences between normal group and abnormal group in liver and renal function. P-values of 0.05 or lower were considered statistically significant.
Ethics approval and consent to participate
The study was performed in accordance with the Helsinki Declaration and approved by the Ethics Committee of Beijing Hospital (reference number: 2019BJYYEC-054-02).
Results
Population basic information
This study involved 760 participants, including 375 males and 385 females, aiming to explore differences in lifestyle habits, health status, and physiological indicators between genders. The age distribution shows that the average age of male and female participants was 74.18 years (standard deviation 8.70) and 73.98 years (standard deviation 8.68), respectively, indicating good age consistency within the sample. Regarding educational level, 5.87% of male participants had a college degree or higher, compared to only 2.96% of females, showing a higher proportion of male participants with higher education levels. In contrast, 59.14% of female participants had an education level of junior high school or below, higher than 42.67% of males. Analysis of smoking status revealed that 62.60% of male participants and 92.97% of female participants had never smoked, while the proportion of current smokers among male participants was 28.18%, significantly higher than 5.47% among females. Additionally, males also showed a higher proportion of current drinkers, with 27.76% of males compared to 7.03% of females. Regarding physical activity levels, 35.20% of males and 32.73% of females engaged in frequent physical activity, while 64.80% of males and 67.27% of females never engaged in physical activity. As for the frequency of medical check-ups, 44.53% of females had at least one check-up per year, higher than 36.66% of males. Sleep duration, life satisfaction, health satisfaction, cognitive scores, and other physiological measurement indicators (such as body mass index, WHR, systolic and diastolic blood pressure) were also recorded and analyzed to comprehensively evaluate and compare health and lifestyle habits differences between the sexes (Table 1).
Basic characteristics of the study population.

Cytokine testing results
In our study, we tested 15 cytokines in 375 male participants and 10 cytokines in 385 female participants (Figure 1(A), (B)). Since the expression distribution of all cytokines did not conform to a normal distribution, we used Spearman correlation analysis to analyze the relationship between cytokines and age. The cytokines in males that showed the strongest correlation with age were IGFBP2 (ρ=0.58), PSA-total (ρ=0.33), bIG-H3 (ρ=0.31), and CEACAM-1 (ρ=-0.21). In females, the cytokines most correlated with age were GDF-15 (ρ=0.74), 6Ckine (ρ=0.52), PON1 (ρ=–0.28), and LDL R (ρ=–0.26) (Figure 1(C), (D), Table 2). The lack of statistical significance in the correlation between some cytokines and age might be due to the study population being only those over 60 years of age, without including younger individuals.

Analysis of plasma cytokine expression levels and their association with aging. (A, B) Hierarchical clustering heatmaps of plasma cytokine concentrations in males (A) and females (B). Red represents higher expression and blue represents lower expression. (C, D) Spearman correlation matrices between cytokine levels and chronological age in males (C) and females (D). Red indicates positive correlation, blue indicates negative correlation, and gray indicates non-significant correlation (p ≥ 0.05). (E, F) Fitted smooth curves (LOESS) showing age-related trajectories of cytokines that were significantly correlated with age in males (E) and females (F). Shaded areas represent 95% confidence intervals. (G, H) Bioinformatics enrichment analysis (Gene Ontology and Kyoto Encyclopedia of Genes and Genomes pathway analysis) of age-related cytokines in males (G) and females (H). GO: Gene Ontology; KEGG: Kyoto Encyclopedia of Genes and Genomes; LOESS: locally estimated scatterplot smoothing.
Spearman correlation analysis between cytokines and age.

Note: p-value<0.05 indicates significant differences.
We conducted enrichment analyses using databases like GO/KEGG, canonical pathways, and hall mark gene sets. In males, the 15 factors were primarily enriched in pathways regulating cell activation, angiogenesis, interactions on the vascular endothelial surface, pathways in cancer, and responses to nutritional levels. In females, the 10 factors were mainly enriched in pathways related to the NABA matrix, positive regulation of leukocyte migration, positive response to external stimuli, steroid metabolism processes, and cellular responses to growth factor stimulation (Figures 1(E), (F)). Additionally, by consulting the DisGeNET database, we found that cytokines in males were mainly associated with diseases such as pancreatic tumors, vascular diseases, endothelial dysfunction, pulmonary hypertension, and synovitis. In contrast, cytokines in females were primarily related to cardiovascular diseases, such as acute coronary syndrome, essential hypertension, carotid atherosclerosis, aortic valve stenosis, and ST-segment elevation myocardial infarction (Figure S1).
Liver and renal function test results
Clinical laboratory tests for liver and renal function were performed on the participants, with ALT, AST, GGT, and ALP serving as indicators of liver function, and SCr, BUN, and eGFR representing the state of renal function. In men, levels of ALT, AST, GGT, and eGFR significantly decreased with age, while SCr significantly increased with age. In women, levels of ALT and eGFR significantly decreased with age, and SCr significantly increased (Figure 2(A) to (C), Table 3). Additionally, we analyzed the correlation between laboratory liver and renal function indicators and cytokines. In men, the strongest correlations with cytokines were found with eGFR, ALT, ALP, and SCr. In women, the strongest correlations with cytokines were with eGFR, SCr, GGT, and ALT (Figure 2(D),(E)).

Liver and renal function parameters and their relationships with age and cytokines. (A) Spearman correlation matrix between conventional liver and renal function indicators and age in the entire cohort. (B, C) Age-dependent fitted curves (LOESS) of liver and renal function indicators in males (B) and females (C). Pink and light-blue shaded areas indicate the laboratory reference ranges. (D, E) Heatmaps of Spearman correlation coefficients between liver/renal function indicators and both age and plasma cytokines in males (D) and females (E). Red indicates positive correlation and blue indicates negative correlation (***p < 0.001, **p < 0.01, *p < 0.05). ALT: alanine aminotransferase; AST: aspartate aminotransferase; CKD-EPI: chronic kidney disease epidemiology collaboration; eGFR: estimated glomerular filtration rate; GGT: gamma-glutamyl transferase; LOESS: locally estimated scatterplot smoothing.
Spearman correlation analysis between clinical laboratory tests and age.

Note: p-value<0.05 indicates significant differences.
Abbreviations: ALP: alkaline phosphatase; ALT: alanine aminotransferase; AST: aspartate aminotransferase; BUN: blood urea nitrogen; eGFR: estimated glomerular filtration rate; GGT: gamma-glutamyltransferase; SCr: serum creatinine.
Cytokine-Based assessment of liver function
Participants were classified as healthy based on the following criteria: fasting GLU ≤ 6.1 mmol/L, eGFR ≤ 60 mL/min/1.73 m2, SCr ≤ 111 μmol/L for men or ≤ 81 μmol/L for women, BUN ≤ 9.5 mmol/L for men or ≤ 8.8 mmol/L for women, ALT ≤ 50 U/L for men or ≤ 40 U/L for women, AST ≤ 40 U/L for men or ≤ 35 U/L for women, ALP ≤ 125 U/L for men or ≤ 135 U/L for women, GGT ≤ 60 U/L for men or ≤ 45 U/L for women. Participants with any of ALT, AST, ALP, or GGT exceeding these reference intervals were classified as having abnormal liver function (Table 4).
Concentration of liver function indicators in normal and abnormal groups.

Note: p-value<0.05 indicates significant differences.
Abbreviations: P50: median; P25: 25 percent quartile; P75: 75 percent quartile; ALP: alkaline phosphatase; ALT: alanine aminotransferase; AST: aspartate aminotransferase; GGT: gamma-glutamyltransferase.
The dataset was randomly split in a 3:1 ratio into training and hold-out validation sets. Due to severe class imbalance (e.g. normal-to-abnormal ratio approaching 10:1 in males for renal function), SMOTE was applied exclusively to the training set to mitigate this algorithmic bias and improve minority-class recall. Model performance was then evaluated on the untouched original validation set, ensuring assessment on the real-world imbalanced distribution (Supplemental Table S1).
We employed five machine learning methods—logistic regression, random forest, lasso regression, XGBoost, and SVM—to assess liver function abnormalities. The results and coefficients after SMOTE over-sampling for each model are displayed in Supplemental Figures S2 and S3. On the hold-out validation set, the best method for assessing liver function was Logistic Regression, with AUCs of 0.918 (95% CI: 0.839–0.983) for males and 0.794 (95% CI: 0.662–0.904) for females. All 95% confidence intervals for AUC, sensitivity, specificity, and F1 score were calculated using 1000 stratified bootstrap resamples. It is noteworthy that the 10-fold cross-validation yielded more conservative and generalized performance estimates (Supplemental Table S1 and S2), with the mean CV AUC for male logistic regression at 0.701 and for female at 0.600. This discrepancy highlights the potential for optimistic bias in a single train-test split and underscores the importance of cross-validation for assessing true model generalizability. The F1 scores are 0.891 (95% CI: 0.822–0.952) and 0.826 (95% CI: 0.732–0.898), respectively (Figure 3(A), (C), Table 5). The cytokines with the highest regression coefficients in men were VCAM-1, CEACAM-1, REG4, Thrombomodulin, and CMG-2, while in women, they were CD99-L2, CA125, PON1, and 6Ckine (Figure 3B, (D)).

Machine learning assessment of liver function abnormalities using plasma cytokines. (A, C) Receiver operating characteristic (ROC) curves of the five tested algorithms in the hold-out validation set for males (A) and females (C). AUC: area under the receiver operating characteristic curve, with 95% bootstrapped confidence intervals shown in brackets. (B) Regression coefficients of the final logistic regression model in males. (D) Regression coefficients of the final logistic regression model in females. Models compared: logistic regression, random forest (RF), least absolute shrinkage and selection operator (Lasso) regression, extreme gradient boosting (XGBoost), and support vector machine (SVM).
Evaluation of machine learning assessment for liver function.

Note: AUC: area under the curve; XGBoost: eXtreme gradient boosting; SVM: support vector machines; SMOTE: synthetic minority over-sampling technique.
Cytokine-based assessment of renal function
Individuals with an eGFR of less than 60 mL/min/1.73 m2 or with SCr or BUN levels exceeding the reference intervals were categorized as having abnormal renal function (Table 6). Similarly, five machine learning methods—logistic regression, random forest, lasso regression, XGBoost, and SVM—were utilized to assess the presence of renal function abnormalities after SMOTE over-sampling. The results and coefficients for each model are displayed in Supplemental Figures S4 and S5. The results revealed that Lasso regression was the most effective method for assessing renal function, with AUCs of 0.895 (95% CI: 0.781–0.974) for males and 0.940 (95% CI: 0.872–0.989) for females. For renal function, Lasso regression also demonstrated robust performance, with hold-out AUCs of 0.895 (males) and 0.940 (females), which were supported by 10-fold cross-validation (mean CV AUCs: 0.731 and 0.774, respectively; Supplemental Tables S3, S4). Pairwise comparisons of AUCs between models were performed using DeLong's test. (Supplemental Table S6). The F1 scores are 0.875 (95% CI: 0.795–0.938) and 0.915 (95% CI: 0.848–0.967), respectively (Figure 4(A), (C), Table 7). The cytokines with the highest regression coefficients in men were VCAM-1, REG4, Thrombomodulin, and Notch-3, while in women, they were GDF-15, LDL R, CA125, and PON1 (Figure 4(B), (D)).

Machine learning assessment of renal function abnormalities using plasma cytokines. (A, C) Receiver operating characteristic (ROC) curves of the five tested algorithms in the hold-out validation set for males (A) and females (C). AUC: area under the receiver operating characteristic curve, with 95% bootstrapped confidence intervals shown in brackets. (B) Regression coefficients (Lasso-selected) of the final model in males. (D) Regression coefficients (Lasso-selected) of the final model in females. Models compared: logistic regression, random forest (RF), least absolute shrinkage and selection operator (Lasso) regression, extreme gradient boosting (XGBoost), and support vector machine (SVM).
Concentration of renal function indicators in normal and abnormal groups.
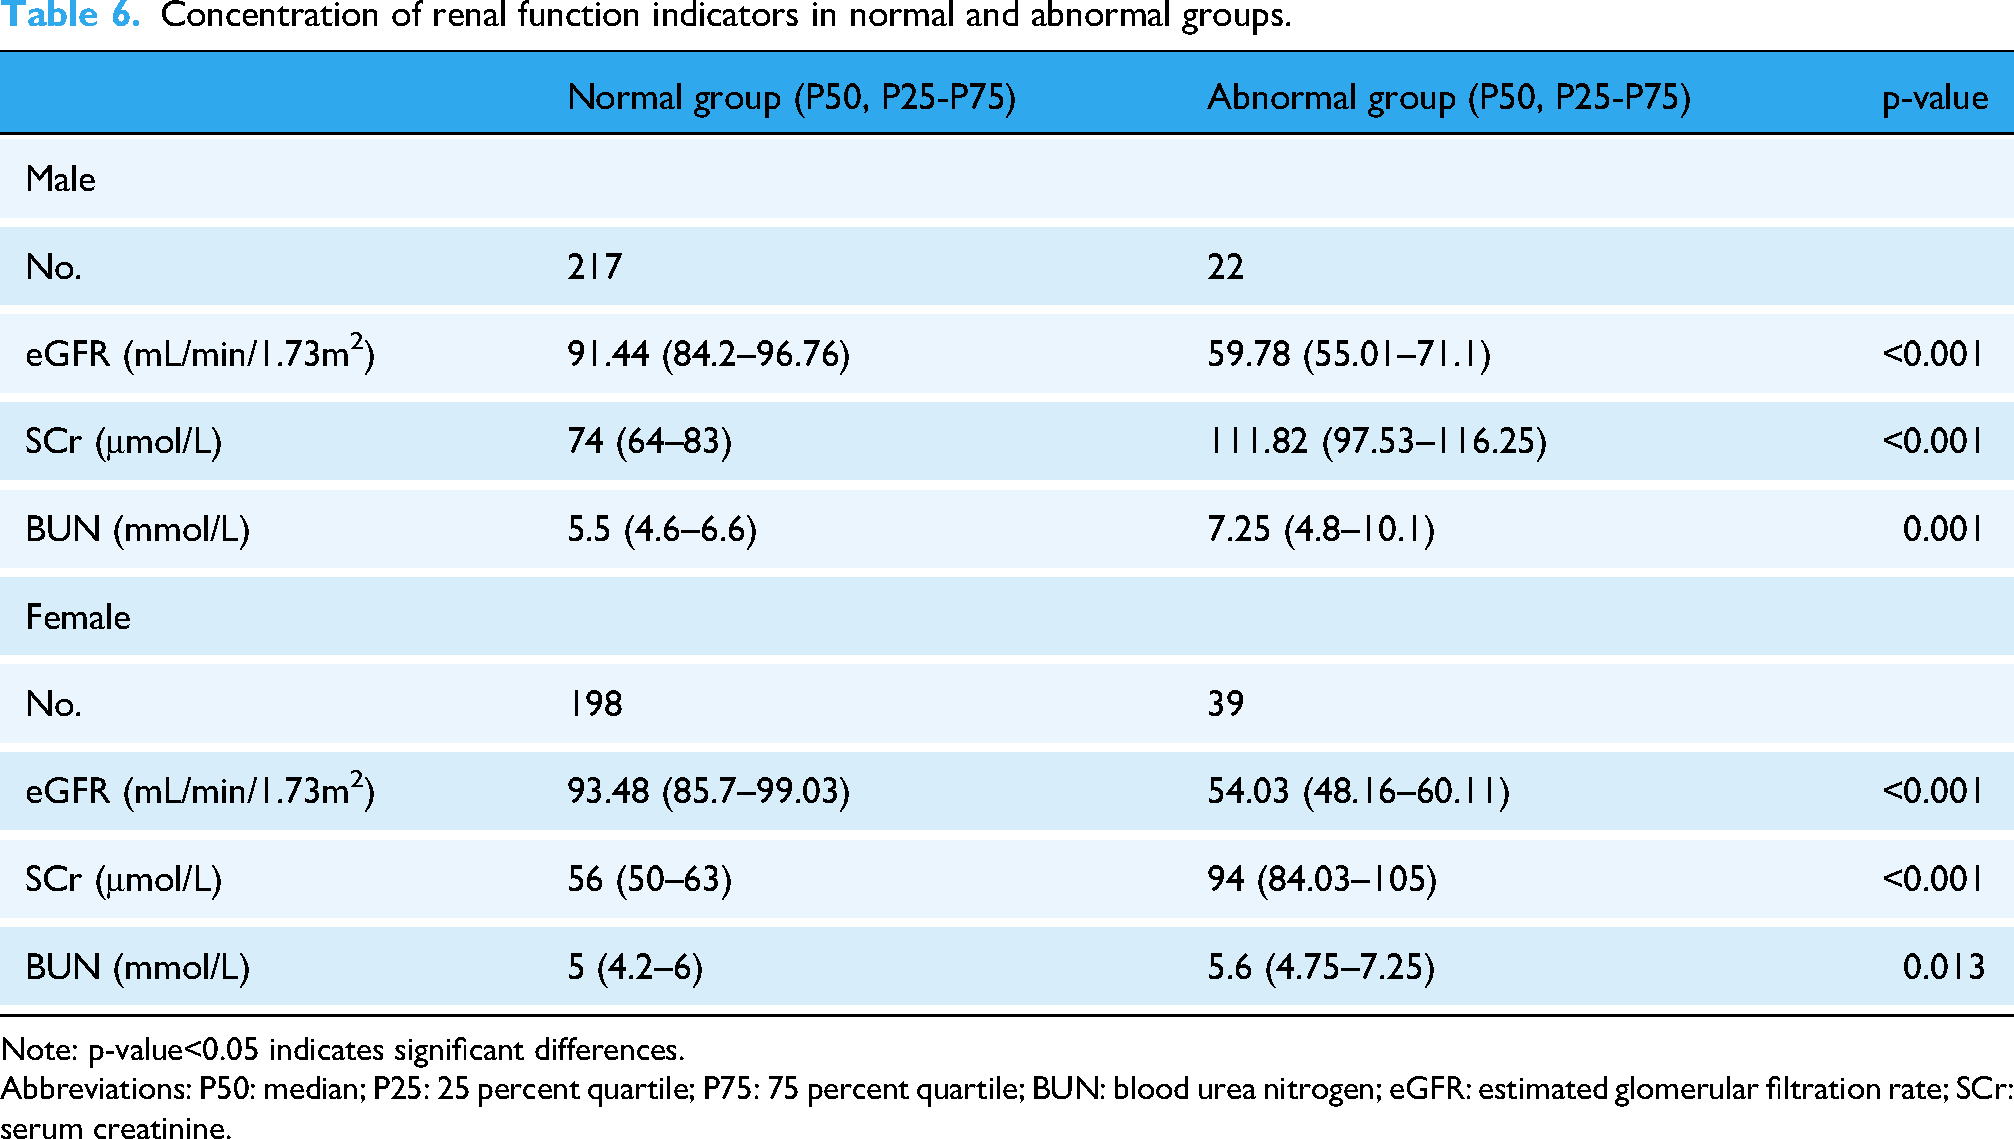
Note: p-value<0.05 indicates significant differences.
Abbreviations: P50: median; P25: 25 percent quartile; P75: 75 percent quartile; BUN: blood urea nitrogen; eGFR: estimated glomerular filtration rate; SCr: serum creatinine.
Evaluation of machine learning assessment for renal function.

Note: AUC: area under the curve; XGBoost: eXtreme gradient boosting; SVM: support vector machines; SMOTE: synthetic minority over-sampling technique.
Because of the limited number of abnormal cases and severe class imbalance, single hold-out estimates were consistently higher than 10-fold cross-validation results (Supplemental Tables S1–S4). The cross-validated AUCs, which are less susceptible to fortunate data partitioning, are therefore considered the more reliable indicators of expected performance in independent cohorts.
Discussion
In this study, we employed multiple machine learning methods to assess liver and renal function abnormalities in the aging population, particularly based on cytokine expression patterns. The results demonstrated that the Lasso regression performed exceptionally well in assessing renal function abnormalities, achieving AUCs of 0.895 and 0.940 for male and female participants, respectively, significantly outperforming other methods.
Lasso regression is particularly useful for dealing with datasets that have a high degree of multicollinearity or when the number of variables greatly exceeds the number of samples. By imposing a penalty on the magnitude of the regression coefficients, Lasso regression can shrink the coefficients of unimportant variables to zero, thereby achieving automatic variable selection, simplifying the model, and reducing the risk of overfitting. In disease prediction models, this characteristic not only enhances the accuracy of model predictions but also helps researchers identify the biomarkers or risk factors most closely associated with disease progression. 21 Wang et al. established a nomogram for predicting the recurrence of early-stage HCC patients based on Lasso-Cox regression. 22 Li et al. found that Lasso regression is more effective than logistic regression based on Pearson's chi-squared test for the differential diagnosis of atypical Crohn's disease and intestinal tuberculosis. 23 In recent years, Lasso regression has been increasingly applied to the assessment of biological age and the screening for aging biomarkers. Studies by Tanaka, Lehallier, Li, and others have used Lasso regression to construct omic clocks and screen for aging biomarkers, finding that individuals predicted to be younger than their actual age performed better in cognitive and physical tests.24–26
Our study also discovered that Logistic Regression was the most effective method for assessing liver function abnormalities for both male and female participants, with AUCs of 0.918 and 0.794, respectively. This suggests that while machine learning methods can offer deep insights into complex data patterns, traditional statistical methods remain highly valuable in certain situations, especially when the interpretability of the model is a consideration. Song's research suggests that in predicting acute kidney injury, the performance of machine learning models is comparable to that of the Logistic Regression model. However, the performance of machine learning models varies significantly, with some models demonstrating exceptional performance. 27
The diagnostic models developed in this study hold significant potential for clinical translation, particularly in the management of patients with chronic liver diseases and CKDs. In these populations, continuous monitoring of organ function is crucial for detecting acute-on-chronic deterioration, guiding treatment adjustments, and assessing prognosis. For instance, in patients with non-alcoholic fatty liver disease (NAFLD) or early-stage CKD, our cytokine-based model could serve as a risk stratification tool. Identifying individuals with cytokine profiles indicative of high risk for rapid progression could prompt more frequent monitoring, lifestyle interventions, or earlier initiation of specific therapies. 28 Moreover, in complex clinical scenarios such as drug-induced liver injury or the nephrotoxic effects of medications in polypharmacy patients—a common issue in the elderly—a cytokine signature might provide an earlier signal of subclinical organ stress than traditional liver enzymes or creatinine levels. This could allow for timely drug withdrawal or dose adjustment before irreversible damage occurs. Integrating our models into the electronic health records as a clinical decision support system could alert physicians to at-risk patients, thereby personalizing and enhancing the safety of pharmacotherapy in vulnerable populations. 29
The traditional approach of using liver and renal function tests as disease markers, though undeniably valuable, often means that interventions are initiated at a stage where some degree of organ damage has already occurred.30,31 This reactive approach to disease management highlights the need for a paradigm shift towards more proactive measures. By identifying biomarkers that can signal the risk of liver and renal dysfunction before traditional tests show abnormalities, healthcare providers could offer targeted interventions to at-risk individuals, potentially delaying or averting the onset of significant organ damage. For instance, in the diagnosis and treatment of alcoholic liver disease, Dagmar Kollmann and colleagues have proposed that carbohydrate-deficient transferrin (CDT) is a highly specific biomarker for detecting chronic alcohol abuse. It is considered the most ideal marker for assessing drinking conditions. 29 Another study found that when patients with alcoholic liver disease present with liver fibrosis or fatty liver, the combination of CDT with other biochemical markers (such as GGT, AST/ALT ratio) can further improve the accuracy of diagnosis. 32 Mass spectrometry-based metabolomic analysis is a rapid, non-invasive urine test used to identify early-stage alcoholic liver disease. This allows for risk stratification and treatment of high-risk individuals before alcoholic liver disease leads to irreversible liver damage and death. 33
Cytokines, as discussed in our study, present a compelling case for such early indicators. Duan and colleagues proposed that cytokines such as CRP, IL-1β, IL-6, TNF-α, and ICAM-1 could serve as early diagnostic markers for NAFLD. 28 Their role in immune response and inflammation places them at the crossroads of many pathophysiological processes, including those leading to liver and renal diseases.34–37 The diagnostic modeling of liver and renal function abnormalities based on cytokine profiles, as demonstrated in our research, opens new avenues for early detection. It suggests that shifts in cytokine levels could precede the detectable changes in liver and renal function tests, offering a crucial window for preventive measures. Critically, our discovery of distinct, gender-specific cytokine panels—such as VCAM-1 and REG4 in males versus GDF-15 and PON1 in females—likely stems from fundamental differences in sex hormone regulation, immune response, and body composition.38,39 This sexual dimorphism necessitates a personalized approach to risk assessment, as a unified model would overlook these pivotal biological distinctions. 40 Moreover, the exploration into cytokines and other early indicators necessitates a more nuanced understanding of the biological processes underpinning organ dysfunction. It calls for interdisciplinary research that bridges immunology, molecular biology, and clinical medicine, underscoring the complexity of assessing organ health. Additionally, gender-specific differences in cytokine expression and their impact on disease progression emphasize the need for personalized approaches in assessment-based modeling and disease prevention strategies.40–42 The observed correlations between cytokines, age, and organ function parameters represent statistical associations only and do not imply biological causality, as they may be influenced by unmeasured confounders or reverse causation.
When compared to traditional models reliant on static clinical thresholds or single biomarkers,20,43 our cytokine-driven machine learning approach demonstrates superior potential in effectiveness, validity, and safety. Traditional models, often limited by the insensitivity of metrics like SCr or ALT for early-stage dysfunction, provide a reactive diagnosis after significant organ damage has occurred. In contrast, our model's integration of multiple cytokines captures the complex pathophysiology of organ decline, yielding higher discriminatory power as evidenced by AUC values up to 0.918, which surpasses the diagnostic accuracy of any single routine test. The primary safety advantage lies in its proactive capacity; by detecting shifts in inflammatory and regulatory pathways that may precede traditional biomarker abnormalities,24,28 it could enable earlier intervention, potentially averting irreversible damage. However, the practical safety and efficacy of implementation hinge on rigorous external validation to mitigate risks associated with false positives and negatives, positioning it initially as a powerful adjunct to, rather than a replacement for, standard care. 44 Additionally, while DeLong's test was used for pairwise AUC comparisons, we acknowledge that it may underestimate variance when applied following synthetic over-sampling (SMOTE); results should therefore be interpreted conservatively alongside the 10-fold cross-validation estimates.
This study has several limitations. First, its cross-sectional design precludes causal inference and true assessment of prognosis; longitudinal studies are needed to establish temporal relationships. Second, the participant cohort was recruited from two hospitals in China, and the stringent exclusion of common comorbidities, while methodologically sound for isolating effects, may limit the generalizability of our findings to more heterogeneous, real-world elderly populations with multiple co-existing conditions. External validation in independent, multi-ethnic cohorts is essential. Third, the performance for female liver function assessment (AUC=0.794), while acceptable, indicates room for improvement. Future work should integrate other data types, such as genetic or metabolomic markers, and explore more complex or interpretable AI techniques (e.g. SHAP analysis) to enhance accuracy and clinical interpretability. Finally, the reliance on ELISA, while robust, may pose challenges for widespread clinical adoption; developing simplified assays or exploring more accessible biomarkers will be a crucial next step.
In conclusion, while liver and renal function tests remain indispensable tools in diagnosing and managing organ-related diseases, there is a pressing need to expand our research focus to encompass earlier biomarkers like cytokines. Such an approach could revolutionize our ability to assess and prevent liver and renal dysfunction, shifting the paradigm from reactive to proactive healthcare. This not only has the potential to improve patient outcomes but also significantly reduces the burden of liver and renal diseases on healthcare systems. Future studies should aim to validate the assessment capacity of these early indicators and integrate them into clinical practice.
Conclusion
This study demonstrates the effectiveness of using cytokine patterns to assess liver and renal function abnormalities in the aging population. It particularly highlights Lasso regression's accuracy for assessing renal dysfunction and logistic regression for assessing liver dysfunction and suggests a proactive healthcare approach by focusing on early biomarkers like cytokines. The results call for further research to integrate these early indicators into clinical practice, aiming to shift from reactive to proactive healthcare management.
Supplemental Material
sj-docx-1-dhj-10.1177_20552076261416809 - Supplemental material for Gender-specific classification of subclinical liver and renal dysfunction in older adults using machine learning and cytokine profiling
Supplemental material, sj-docx-1-dhj-10.1177_20552076261416809 for Gender-specific classification of subclinical liver and renal dysfunction in older adults using machine learning and cytokine profiling by Lvtao Zeng, Li Zhang, Sijia Li, Zihui Wang, Jihong Hu, Honglei Liu and Jianping Cai in DIGITAL HEALTH
Supplemental Material
sj-docx-2-dhj-10.1177_20552076261416809 - Supplemental material for Gender-specific classification of subclinical liver and renal dysfunction in older adults using machine learning and cytokine profiling
Supplemental material, sj-docx-2-dhj-10.1177_20552076261416809 for Gender-specific classification of subclinical liver and renal dysfunction in older adults using machine learning and cytokine profiling by Lvtao Zeng, Li Zhang, Sijia Li, Zihui Wang, Jihong Hu, Honglei Liu and Jianping Cai in DIGITAL HEALTH
Supplemental Material
sj-pdf-3-dhj-10.1177_20552076261416809 - Supplemental material for Gender-specific classification of subclinical liver and renal dysfunction in older adults using machine learning and cytokine profiling
Supplemental material, sj-pdf-3-dhj-10.1177_20552076261416809 for Gender-specific classification of subclinical liver and renal dysfunction in older adults using machine learning and cytokine profiling by Lvtao Zeng, Li Zhang, Sijia Li, Zihui Wang, Jihong Hu, Honglei Liu and Jianping Cai in DIGITAL HEALTH
Supplemental Material
sj-pdf-4-dhj-10.1177_20552076261416809 - Supplemental material for Gender-specific classification of subclinical liver and renal dysfunction in older adults using machine learning and cytokine profiling
Supplemental material, sj-pdf-4-dhj-10.1177_20552076261416809 for Gender-specific classification of subclinical liver and renal dysfunction in older adults using machine learning and cytokine profiling by Lvtao Zeng, Li Zhang, Sijia Li, Zihui Wang, Jihong Hu, Honglei Liu and Jianping Cai in DIGITAL HEALTH
Footnotes
Author contributions
LZ conducted the experiment, analyzed the data, and wrote this article. LZ, SL, and ZW assisted with data organization. JH and HL reviewed and revised the manuscript. JC designed this study and supervised the research.
Funding
The authors disclosed receipt of the following financial support for the research, authorship, and/or publication of this article: This work was supported by the Natural Science Foundation of Beijing Municipality, National Key Research and Development Program of China, Chinese Academy of Medical Sciences Initiative for Innovative Medicine, (grant number L246059, No. 7242264, 2024YFA1109102, No. 2021-1-I2M-050).
Declaration of conflicting interests
The authors declared no potential conflicts of interest with respect to the research, authorship, and/or publication of this article.
Data sharing statement
The datasets generated for this study are available on request from the corresponding author.
Disclosure
The authors report no conflicts of interest in this work.
Supplemental material
Supplemental material for this article is available online.
References
Supplementary Material
Please find the following supplemental material available below.
For Open Access articles published under a Creative Commons License, all supplemental material carries the same license as the article it is associated with.
For non-Open Access articles published, all supplemental material carries a non-exclusive license, and permission requests for re-use of supplemental material or any part of supplemental material shall be sent directly to the copyright owner as specified in the copyright notice associated with the article.