
Abstract
Objective
Stroke remains a huge disease burden source on a global scale due to its high prevalence rate and mortality. Social media platforms serve as significant health-relevant information dissemination channels. However, the role of social media platforms in stroke-relevant information spread has not been established well. The aim of this study is to explore the role of social media platforms in stroke-relevant information spread.
Methods
To conduct this cross-sectional study, stroke-related videos were collected from YouTube, Bilibili, and TikTok. The quality of included videos was assessed by using the Global Quality Scale (GQS), Journal of the American Medical Association (JAMA), and Modified DISCERN score systems. A guideline-based content analysis was performed to assess the content accuracy and comprehensiveness. Potential positive factors were determined with multiple ordered logistic regression. The dose-relationship between playback time and like was analyzed by employing restricted cubic spline analysis.
Results
A total of 300 stroke-relevant videos were included for further analysis (YouTube 100; Bilibili 100; TikTok 100). Mean JAMA scores of YouTube videos, Bilibili videos, and TikTok videos were 2.51, 2.62, and 2.76, respectively. Mean GQS scores of YouTube videos, Bilibili videos, and TikTok videos were 3.11, 2.79, and 2.60, respectively. Mean Modified DISCERN score of YouTube videos, Bilibili videos, and TikTok videos were 3.00, 2.88, and 2.78, respectively. No significant difference was found in quality scores across the three platforms. Content analysis suggested that all included videos demonstrated good performance in terms of accuracy and evidence support. Personal experience, health professionals, science communications, general users, news agencies, and nonprofit organizations were identified as potential positive factors for better viewers’ level of enjoyment. The video playback time was negatively correlated with the viewers’ level of enjoyment.
Conclusion
Social media platforms facilitate the spread of stroke-relevant information. To enhance viewer engagement, regardless of the platform, video creators should strive to make their videos more concise.
Introduction
Stroke is universally acknowledged as a significant contributor to long-term disability and mortality worldwide. A comprehensive analysis conducted by the Global Burden of Disease (GBD) reveals that the burden of stroke has escalated from 1990 to 2021, accompanied by an increase in the influence of several risk factors. 1 The fact that should be noticed is that with the development of people's living standards and changes in eating habits, the prevalence of stroke has reached 93.8 million. Faced with such a vast burden of stroke, it is imperative that effective, accessible, and affordable measures for stroke surveillance and prevention be urgently implemented in all countries to alleviate the stroke burden.1,2
Social media, which is used by approximately 60% of the global population, plays an important role in people obtaining information and guidance, especially in the post-COVID-19 pandemic era.3,4 In recent years, as a special form of social media, videos (particularly short videos) have shown extraordinary consequences in information spread due to their accessibility, high efficiency. YouTube, established in 2005, serves as the globally largest social media platform. Bilibili, established in 2010, was once regarded as a cultural community solely for Chinese youth. However, in recent years, it has seen an increasing number of experts from various fields becoming active on this platform. TikTok, established in 2016, is a platform that has attracted wide attention in recent years, which plays a significant role in health communication and health-relevant information spread.5–8 Although these social media enhance information spread, there are still some limitations that should be noted: 1) the spread of misinformation; 2) low efficiency of health-relevant information spread; and 3) varying quality of health-relevant information.
The role of social media in many health fields, such as gastric cancer, 4 schizophrenia, 3 and thyroid cancer, 9 has been well established; however, there is still insufficient evidence on the stroke. There is considerable potential for social media to enhance the dissemination of stroke-related information. Therefore, to fill that gap, this cross-sectional study was conducted via collecting stroke-relevant videos from YouTube, Bilibili, and TikTok to address the following issues: 1) assess the quality of videos collected from YouTube, Bilibili, and TikTok by employing Journal of the American Medical Association (JAMA), Global Quality Scale (GQS) and Modified DISCREN score systems; 2) identify the favorable factors that facilitate health-relevant information spread as these favorable factors hold great promise in guiding the production of health-relevant videos (Figure 1).

Overview of the analysis of stroke-relevant videos information feature on the social media platforms.
Materials and methods
Search strategy data extraction
This cross-sectional study was conducted with public stroke-relevant videos that obtained from YouTube (www.youtube.com), Bilibili (www.bilibili.com), and TikTok (Chinese version: www. douyin.com) by using the following keywords “stroke,” “ischemic stroke,” and “cerebral hemorrhage.” To more precisely evaluate the video quality across various platforms and reduce the bias incurred by newly uploaded videos, all searches were conducted on the same day: November 26, 2024. Additionally, to reduce “User preferences” influence, visitor model was used for all platforms. Using the global rankings of each video-sharing platform, which were determined through algorithmic computations, we viewed videos sequentially from the highest-ranked to the lowest. Videos that met the following criteria were included for further analysis: The video topic was stroke, regardless of the stroke type. However, videos were excluded when they: 1) advertisements; 2) reduplicated videos; and 3) containing only images or screens without explanatory content. There was no restriction on issue year, playback time, and language. We limited the analysis to the top 100 videos, since the total population of videos is dynamic and unknown, and several studies have confirmed that videos beyond the top 100 have no significant impact on the analysis.3,6,10–13
All included videos were documented using a standardized Excel file. The following items were detailedly recorded: the video title, the source (including health professionals, science communications, general users, news agencies, nonprofit organizations, for-profit organizations), issue year, playback time, the number of likes, the number of comments, and video content (were divided into the following forms: diagnosis and clinical manifestation, treatment, personal experience, medical education). The descriptions of video content are provided in Table S1. Two investigators independently gathered these data, and any disagreements were arbitrated by the third investigator.
Assessment of quality video
A single-blind approach by two independent investigators was employed to assess the quality of each included video. In brief, all included videos were downloaded (or screen-recorded) and randomly rated on a scale of 1 to 100 by one investigator. The assessment was then performed by two additional investigators who were blinded to the video subjects’ identities. The GQS (Table S2), JAMA (Table S3), and Modified DISCREN (Table S4) score systems were used to assess the quality of videos. These three score systems were widely used in the video quality assessment.14–16 Given that the videos under investigation pertain to healthcare, the Modified DISCERN assessment is structured around five key aspects: clarity, relevance, traceability, robustness, and fairness. The Modified DISCERN comprises five questions, each requiring a binary response of vest” or “no,” where “yes” earns a score of 1 and “no” earns a score of 0, yielding a maximum possible score of 5. The JAMA score system was widely used to assess the reliability of the videos. 12 The rating is determined based on four predefined issues: authorship, attribution, disclosure, and currency. Specifically, video reliability is evaluated using the following criteria: The credentials and affiliations of the author(s) and contributors should be clearly stated. All copyright information, references, and sources for the content should be listed. The initial posting date and any subsequent updates to the content should be provided. Any conflicts of interest, funding, sponsorship, advertising, support, and ownership of the video should be fully disclosed. The GQS, a widely utilized 5-point scale, was utilized to assess the video quality. This scale encompasses five criteria, each rated from 1 to 5, with higher scores indicative of superior quality.
Content analysis
In addition to the quality and reliability assessment, a dedicated content analysis was performed to evaluate the scientific accuracy and comprehensiveness of the videos by two independent investigators. The content analysis was performed based on AHA/ASA 2024 Guideline for the Primary Prevention of Stroke Guideline 17 and AHA/ASA 2019 Guidelines for the Early Management of Acute Ischemic Stroke, 18 as they provide the most up-to-date and comprehensive evidence-based recommendations. The content of each video was evaluated against 10 predefined metrics derived from the guidelines: Accuracy, Completeness, Timeliness, Evidence Support, Consistency, Ethics, Clarity, Clinical Relevance, Actionability, and Fluency (Table S5). Each metric was scored on a 5-point Likert scale (1 = very poor; 2 = poor; 3 = moderate; 4 = excellent; 5 = very excellent) by two independent reviewers. The total content quality score for each video was calculated as the sum of the scores across all 10 metrics, yielding a maximum possible score of 50. A higher total score indicated superior overall content quality, comprehensiveness, and reliability.
Inter-rater reliability
To ensure objective assessment, two independent investigators performed three rounds of independent video evaluation. Any scoring discrepancies underwent adjudication by a third investigator. Inter-rater reliability was quantified using intraclass correlation coefficients (ICCs), which were interpreted as follows: poor (ICC < 0.50), moderate (0.50 ≤ ICC < 0.75), good (0.75 ≤ ICC < 0.90), or excellent (ICC ≥ 0.90). 19
A total of 300 videos were included inter-rater reliability assessments. The inter-rater agreement was strong: JAMA score (ICC = 0.923, 95% confidence interval [CI] 0.914–0.941), GQS score (ICC = 0.910, 95%CI 0.892–0.927), Modified DISCERN (ICC = 0.898, 95%CI 0.881–0.905), and content analysis (ICC = 0.905, 95%CI 0.883–0.914).
Statistical analysis
Before statistical treatment, we assessed the data normality by using Shapiro–Wilk test. Mean ± standard deviation was used to describe the normally distributed quantitative data. When quantitative data were not normally distributed, median and corresponding range (minimum, maximum) was used to describe data. For categorical variables, numbers (proportions) were used for presentation. Spearman's test was used to examine the correlation between independent variables. We used multivariable ordinal logistic regressions to estimate the odds ratio (OR) of each potential predictor for a better like. To perform multivariable ordinal logistic regressions, each platform of “like” was independently divided into quartile (Q1, Q2, Q3, and Q4). We utilized restricted cubic spline (RCS) analysis to capture the dose–effect relationship associated with “like” and playback time. The JAMA, GQS, and Modified DISCERN score systems were used to adjust results (Model 1) and further adjusted for additional content and source (Model 2). P value less than 0.05 was regarded as statistical difference. All statistical analysis was performed by using R software (version 4.2.2) and SPSS statistical software (Version 26.0).
Results
Overview of the video selection process
A total of 406 stroke-relevant videos were identified from YouTube (n = 126), Bilibili (n = 142), and TikTok (n = 138). After strict screening, a total of 11 duplications, 10 advertisements, and 85 nonrelevant videos were excluded. Ultimately, 300 videos were selected for inclusion, with 100 videos sourced from YouTube, 100 from Bilibili, and 100 from TikTok (Figure 2).

Overview of stroke-relevant videos selection process in the three social media platforms.
Basic information of included videos
For videos that collected from YouTube, issue years ranged from 2010 to 2024. For videos that collected from Bilibili, issue years ranged from 2018 to 2024. For videos that collected from TikTok, issue years ranged from 2021 to 2024. The number of stroke-relevant videos has increased over the years (Figure 3A). Table 1 presented the basic information of included stroke-relevant videos for three social media platforms. As newly emerging social media platform, the upload time of TikTok’ videos was shortest, followed by Bilibili and YouTube (mean upload time 173.39 days for TikTok, 895.35 days for Bilibili, 1871.82 days for YouTube) (Table 1, Figure 3B). Regarding video playback time, TikTok had an average time of 79.5 s, Bilibili had an average of 244 s, and YouTube had an average of 432 s (Table 1, Figure 3C). We further summarized user's “like” for each social media platform video. As Table 1 and Figure 3D showed, videos collected from TikTok received more “likes” than those from the other two platforms, indicating a high user engagement on this platform. However, we did not observe any differences in the comments across the three platforms (Figure 3E).

The issue years (A), upload time (B), playback time (C), likes (D), and comments (E) of included stroke-relevant videos of three social media platforms.
Basic information of included videos for three social media platforms.
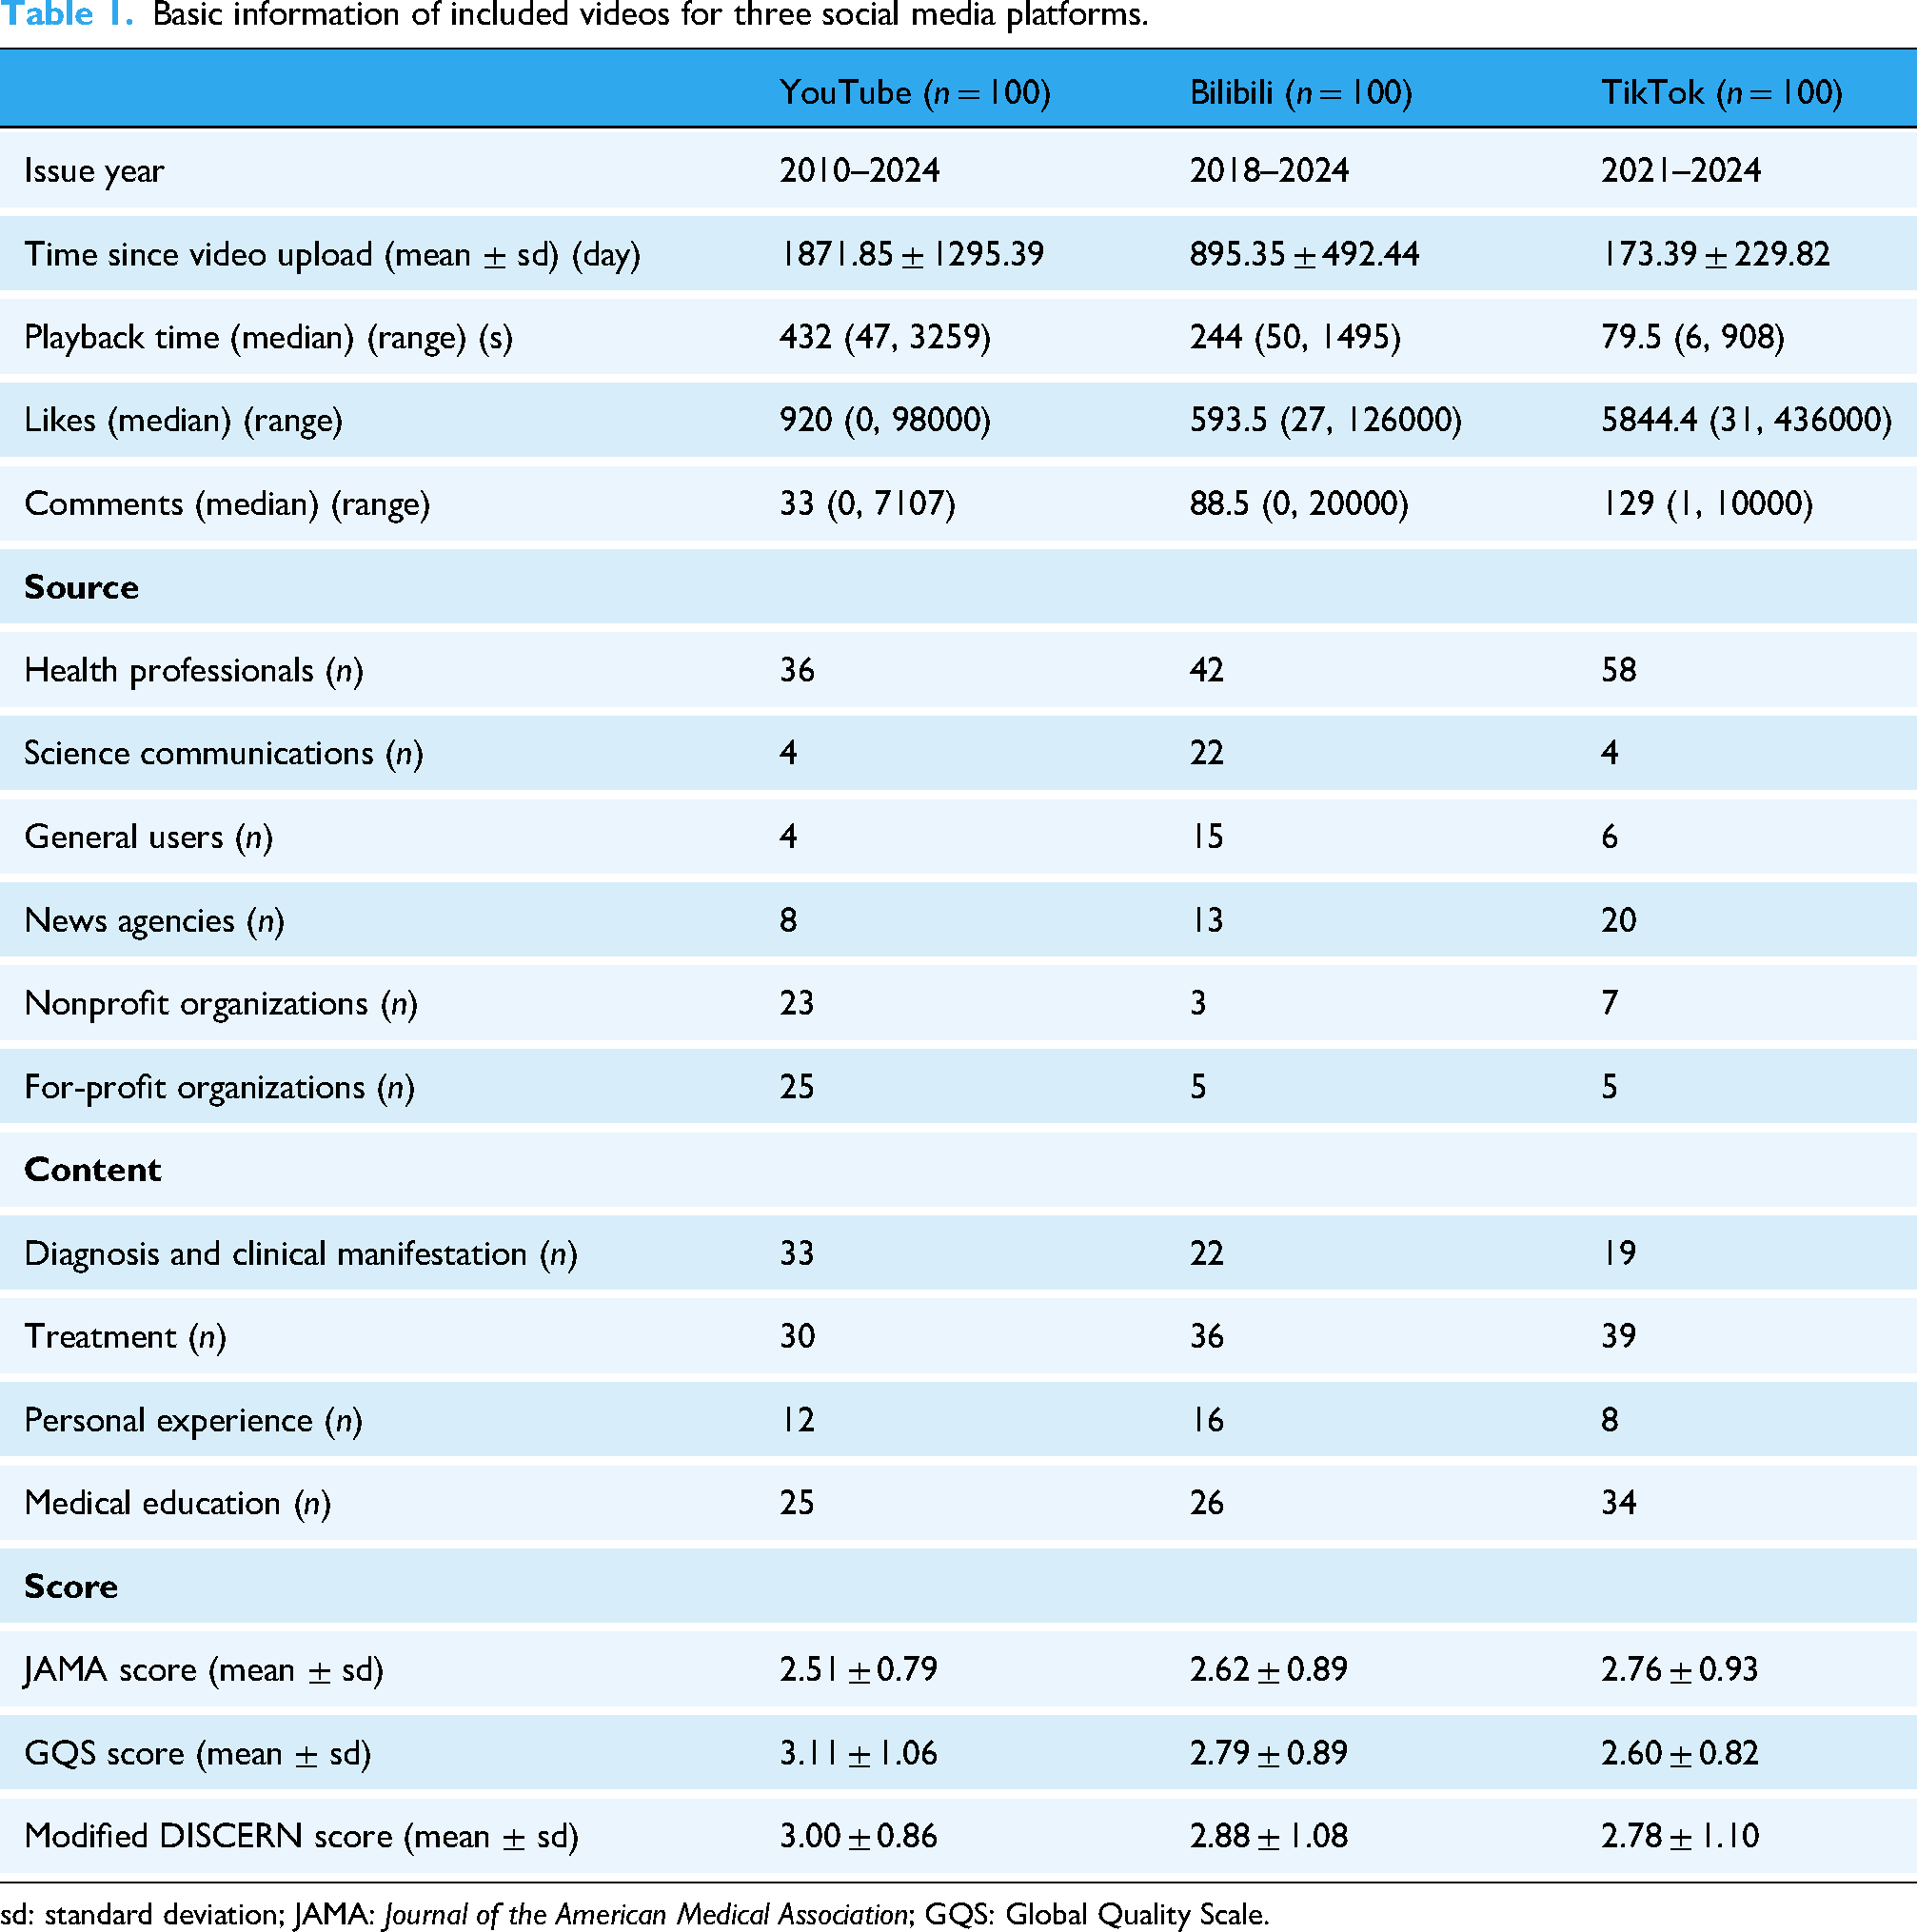
sd: standard deviation; JAMA: Journal of the American Medical Association; GQS: Global Quality Scale.
To further explore the relationship between “like” and “comment,” we conducted a correlation analysis on these two indicators for the same video. As shown in Figure 4, for the same video, “like” and “comments” volume was positively correlated (p < 0.0001), indicating that videos that receive more likes tend to have more comments. More comments mean more communication.

The Spearman's test results of between like and comment of (A, B) YouTube, (C, D) bilibili, and (E, F) TikTok.
Next, we attempt to explore the source and content condition of included stroke-relevant videos. Detailed information about the source is described in Table 1 and Figure 5A. With respect to the source, “health professionals” constitute the dominant component. The proportion of these “health professionals” reached 36% for YouTube, 42% for Bilibili, and 58% for TikTok. The second source of included videos was “for-profit organizations” for YouTube (25%), “science communications” for Bilibili (22%), and “news agencies” for TikTok (20%). In terms of contents, for YouTube, the item “treatment” holds the majority of contents (33%), followed by “diagnosis and clinical manifestation” (30%), “medical education” (25%), and “personal experience” (12%). For Bilibili, the item “treatment” also holds the majority of contents (33%), followed by “medical education” (26%), “diagnosis and clinical manifestation” (22%), and “personal experience” (16%). For TikTok, the item “treatment” also holds the majority of contents (39%), followed by “medical education” (34%), “diagnosis and clinical manifestation” (19%), and “personal experience” (8%) (Table 1, Figure 5B). We also further assess the quality of included stroke-relevant videos by using JAMA, GQS, and Modified DISCERN score systems. However, we did not find any difference across the three platforms (Table 1, Figure 5C–E).

The bar charts presented the source (A) and content (B) of stroke-relevant videos of three social media platforms. The violin graph showed the Journal of the American Medical Association (JAMA) score (C), Global Quality Scale (GQS) score (D), and Modified DISCERN (E) results.
A total of 300 videos were included in the content analysis. All included videos demonstrated good performance (score more than 3) in terms of accuracy and evidence support, suggesting that social media platforms can provide high-quality and scientifically accurate stroke-related information to viewers. As Figure 6 showed, the total score of Bilibili (mean score 37.01) and TikTok (mean score 37.16) was significantly higher than YouTube (mean score 35.56); however, no significant difference was found between Bilibili and TikTok (Figure 6).

The violin graph presented the results of content analysis, which were measured with accuracy, completeness, timeliness, evidence support, consistency, ethics, clarity, clinical relevance, actionability, and fluency.
Results of logistic regressions
Table 2 showed the results of multivariable ordinal logistic regression analysis for predicting better “like” for each social media platform. The variables included content (diagnosis and clinical manifestation, treatment, personal experience, medical education), source (health professionals, science communications, general users, news agencies, nonprofit organizations, for-profit organizations), playback time, JAMA score, GQS score, and Modified DISCERN score. For YouTube, of the variables included, statistically significant predictors of better “like” were health professionals (OR 3.95, 95%CI 1.27–12.27, p = 0.017) and nonprofit organizations (OR 4.35 95%CI 1.27–14.83, p = 0.019). For TikTok, personal experience (OR 15.6, 95%CI 1.72–141.25, p = 0.015), health professionals (OR 18.37, 95%CI 1.95–173.40, p = 0.011), science communications (OR 1698.80, 95%CI 29.25–98671.77, p < 0.0001), general users (OR 318.08, 95%CI 15.90–6362.23, p < 0.0001), and news agencies (OR 17.53, 95%CI 1.56–196.88, p = 0.020).
Multivariate order logistic regression analysis for better like.
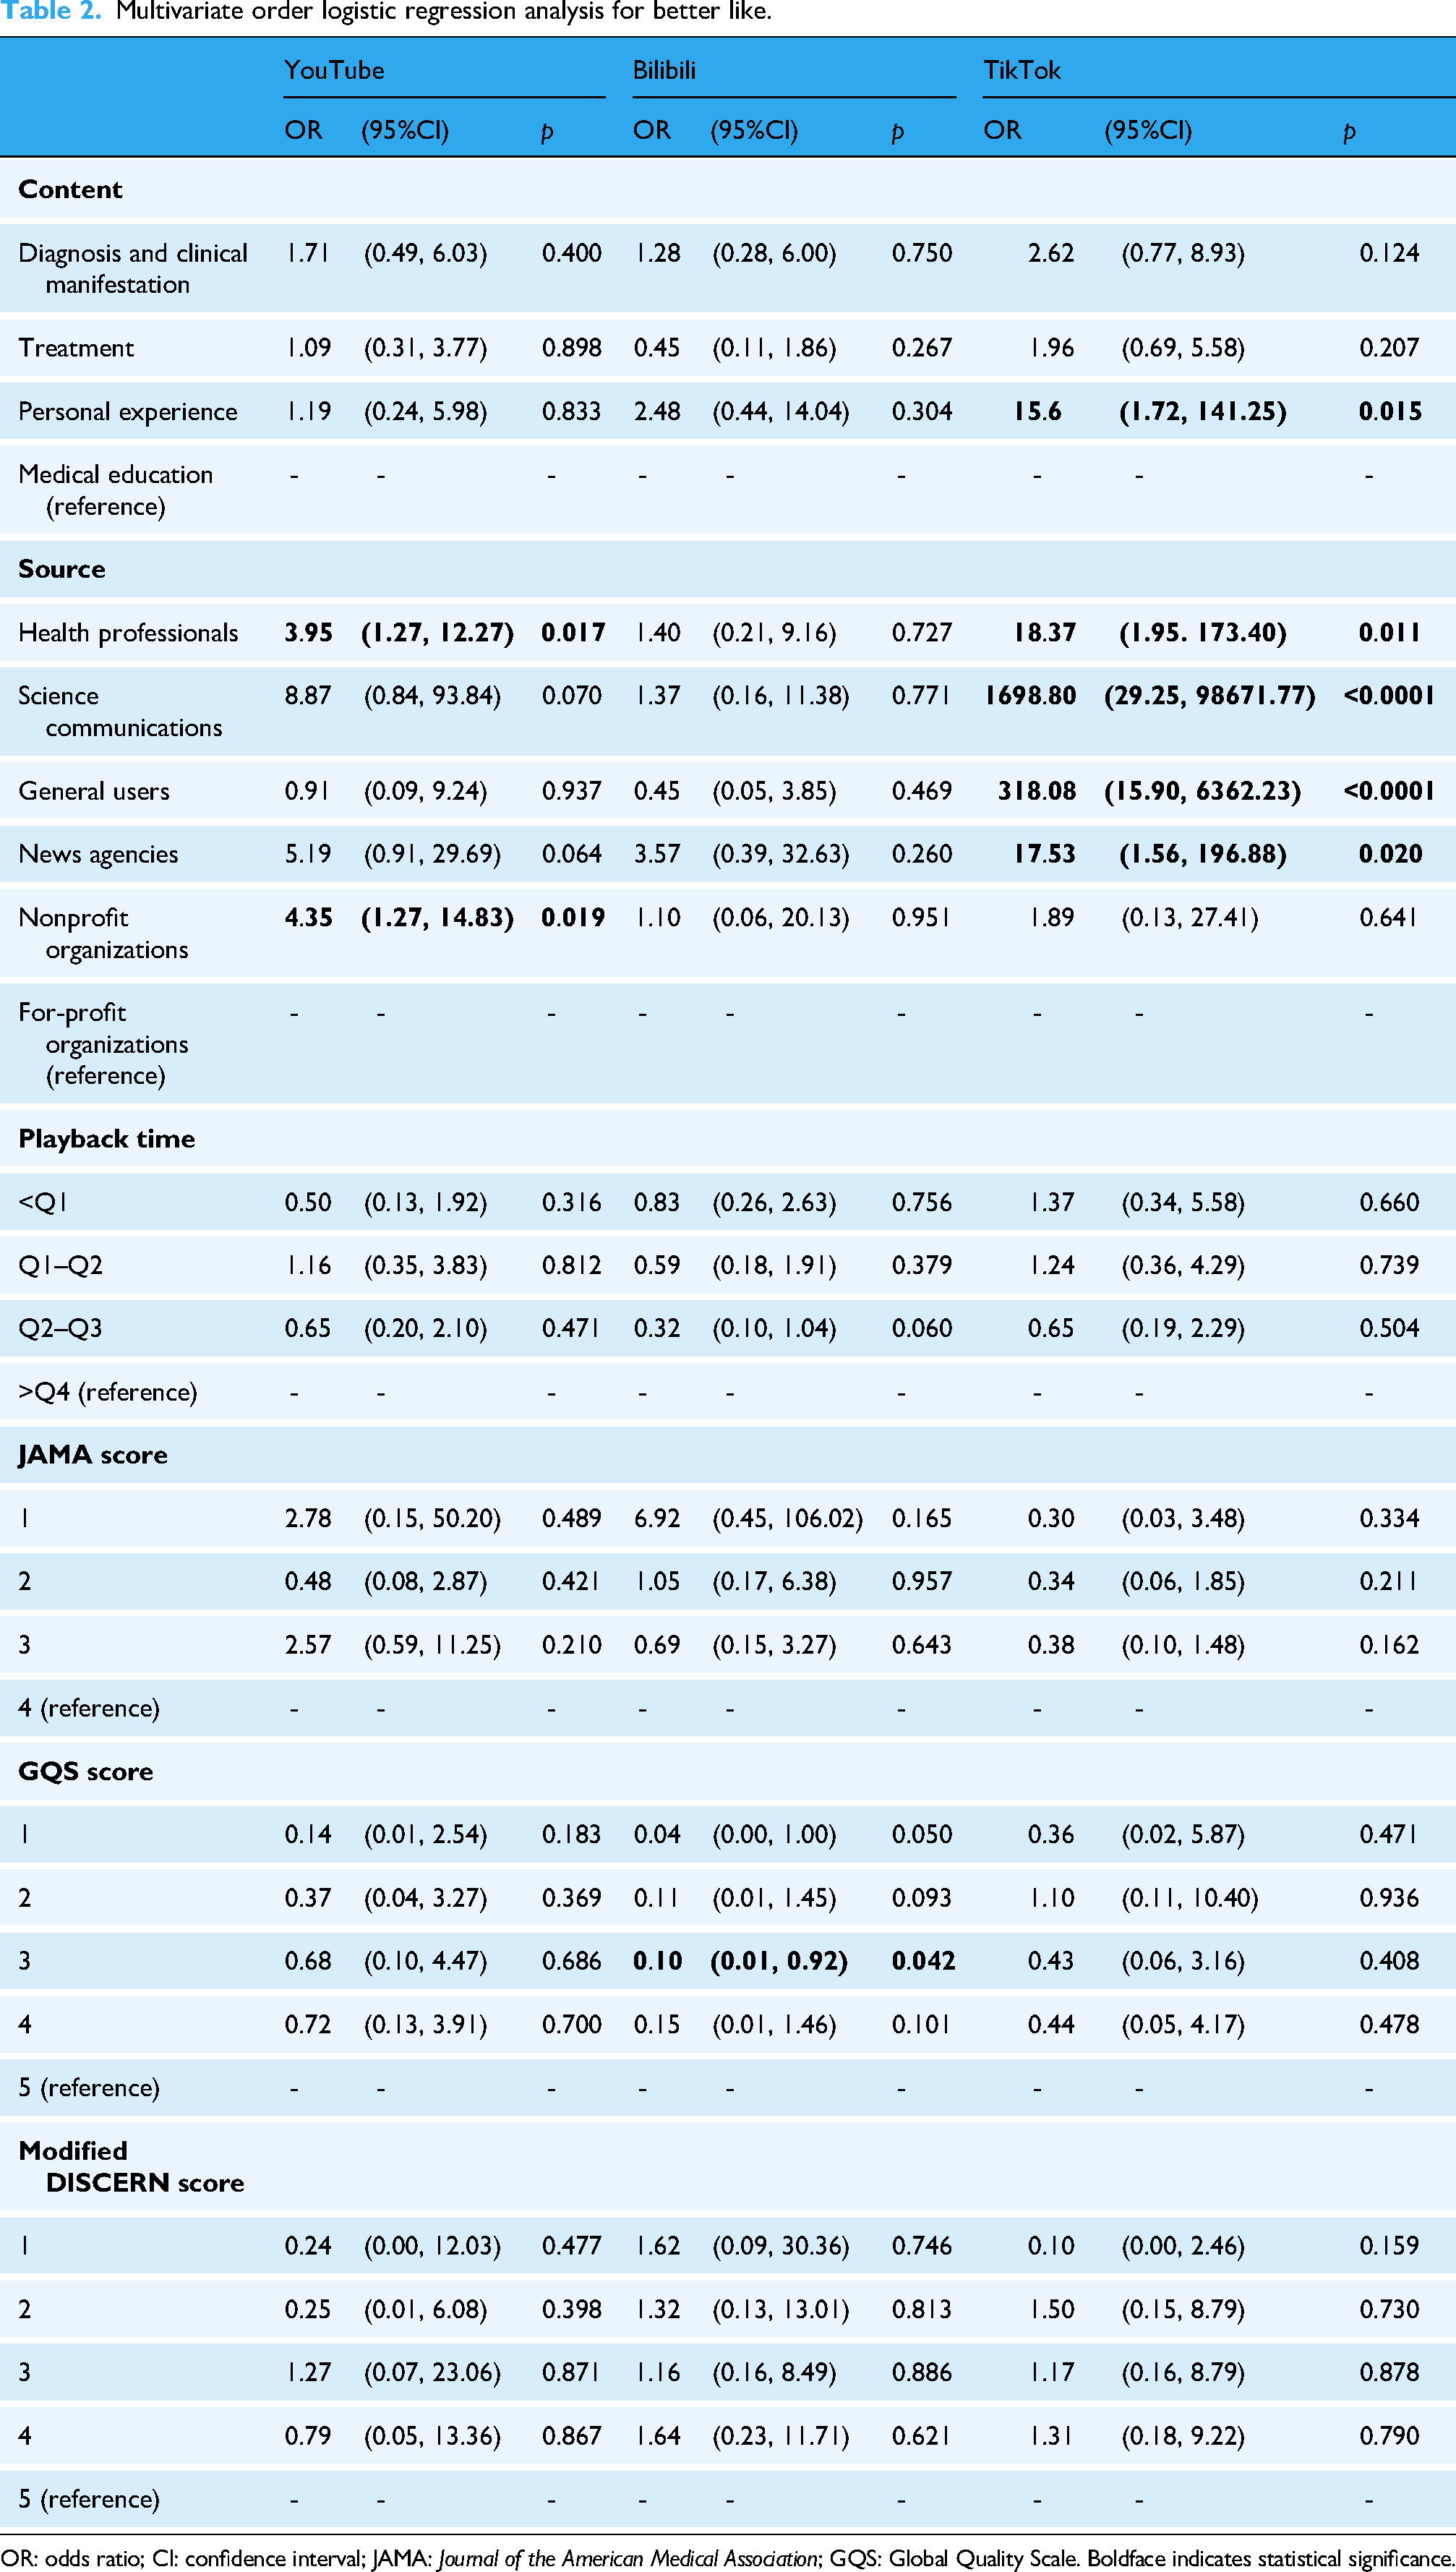
OR: odds ratio; CI: confidence interval; JAMA: Journal of the American Medical Association; GQS: Global Quality Scale. Boldface indicates statistical significance.
Dose–response relationships between playback time and the degree of like
Restricted cubic spline analysis was employed to assess the dose–response relationship between playback time and like. To reduce the influence of confounding factors, three score systems (JAMA, GQS, and Modified DISCERN) were adjusted (Model 1), and additional factors, including source and content, were further adjusted (Model 2). As Figure 7 presented, the relationship between playback time and like was linear. When the playback time exceeds a certain point (YouTube: 433.5518 s; Bilibili: 243.80302 s; TikTok: 79.86608 s), the video may cause dislike among users.

The dose-relationship between playback time and like was assessed by using restricted cubic spline (RCS) analysis for (A) YouTube, (B) bilibili, and (C) TikTok.
Discussion
In this cross-sectional study, the stroke-relevant videos were obtained from three widely used social media platforms YouTube, Bilibili, and TikTok, and the results underscore the significance of social media in the stroke-relevant information spread. Despite no significant difference in quality (assessed by using three widely used score systems) across the three platforms, some other interesting findings were revealed: 1) TikTok had the shortest video playback time compared to other platforms with a mean 79.5 s, but obtains the most “like”; 2) more “like” means more comments, indicating that videos enhance communication; 3) health professionals are the major sources of these videos, offering guarantee of the correctness of content; 4) in terms of source, “health professionals,” “science communicators,” “general users,” “news agencies,” and “nonprofit organizations” were identified as favorable “source”; meanwhile, in terms of content, “personal experience” was identified as favorable “content”; 6) video playback time has a linear inverse relationship with the likes.
Results of GBD 2022 show that stroke is still an important global disease burden source. Prevention is an extremely important measure to reduce disease burden for both healthy individuals and those with a history of stroke. 20 The global advancements in digital technology and the evolution of social media have profoundly altered the approach to implementing prevention measures. People can effectively use these digital technologies and social media to obtain health-relevant information. Similarly, clinicians and educators also can use these technologies to spread health-relevant information.21–23 Collecting information from stroke survivors, who may not be high morbidity, is important for stroke second prevention. However, it is difficult to accomplish due to low morbidity, lacking supervision. A cross-sectional survey, conducted by Clancy et al., revealed that approximately 79.1% (280 out of 354) of the participants utilized the internet on a daily basis, while 40.8% (118 out of 289) accessed social media on their phone or tablet every day. 24 Therefore, social media platforms play a significant role in stroke prevention. As an important part of social media form, videos can effectively and clearly convey health knowledge. Denny et al. found that video-based educational interventions were associated with improved stroke outcomes. 25 A study of feasibility and cost-effectiveness in Nepal indicated that digital social media campaigns raise stroke awareness in low-and middle-income countries. 26 A systematic review, conducted by Garg et al., suggested that social media can be harnessed as a tool of education and research. 27 Compared with previous studies, the current study further explored how to further enhance stroke-relevant information dissemination via digital social media. In this study, we identified several factors, such as video playback time, that can affect the efficiency of stroke-related information dissemination. We demonstrated a negative correlation between video playback time and video popularity. Additionally, we found that specific content (e.g., personal experiences) or sources (e.g., health professionals, science communicators) were associated with enhanced audience engagement. However, while video media platforms have revolutionized information sharing, they also inadvertently contribute to the rapid spread of misinformation. The lack of stringent fact-checking mechanisms and the algorithmic amplification of sensational content may lead to the spread of incorrect stroke-related information. Therefore, it is imperative to strengthen the regulatory mechanisms for video media platforms and optimize their recommendation algorithms.
Under three widely used score systems setting, there is no significant difference among YouTube, Bilibili, and TikTok, indicating a comparable quality of stroke-relevant videos collected from these platforms. A dose–response relationship between playback time and likes was first revealed using RCS analysis. Restricted cubic spline analysis indicated that longer playback time means less “like,” which suggested that video producers should consider shortening the time of videos and refining content to cater to viewer. Furthermore, the “personal experiences” video format was associated with a higher number of likes compared to other formats, identifying it as a potential positive factor for guiding the production of high-quality stroke-related videos. The production of high-quality stroke-related videos for prevention purposes could be enhanced with these findings.
However, there are some limitations that should be noted, necessitating cautious interpretation of our results. Firstly, it should be noted that access to the international version of TikTok was not available due to political restrictions, which may have resulted in the omission of some relevant data. Secondly, it is difficult to clearly distinguish the stroke type (such as ischemic stroke, intracerebral hemorrhage) in a specific video, leading to a loss of this important variable. Thirdly, identifying viewer information is also difficult. We failed to analyze the viewer's characteristics. Fourth, since these videos were all collected from YouTube, Bilibili, or TikTok, it was not feasible to uniformly define the implication of a “like” across differing cultural and platform-specific contexts. The “like” solely represents viewer's engagement and the popularity of the videos, but not a direct evaluation metric of the video's quality and platforms.
Conclusions
The current study provided important and credible evidence for establishing the role of social media platforms in the spread of stroke-relevant knowledge. The results of this study contribute positively to enhancing both the quality and content of these online videos, thereby fostering a more accurate public perception of stroke. Our findings suggest that YouTube, Bilibili, and TikTok all stand out as exceptional social media platforms. To enhance viewer engagement, regardless of the platform, video creators should strive to make their videos more concise.
Supplemental Material
sj-docx-1-dhj-10.1177_20552076261416720 - Supplemental material for YouTube, Bilibili, and TikTok serve as important stroke-relevant information sources: A cross-sectional study
Supplemental material, sj-docx-1-dhj-10.1177_20552076261416720 for YouTube, Bilibili, and TikTok serve as important stroke-relevant information sources: A cross-sectional study by Hongxin Shu, Yue Zhu, Tengfeng Yan, Weilin Zhang, Zihan Huang, Mingyu Liang, Zhihui Long, Fengyi Lv and Wei Tu in DIGITAL HEALTH
Footnotes
Acknowledgements
The authors thank the staff of the Department of Neurosurgery, The Second Affiliated Hospital, Jiangxi Medical College, Nanchang University. Particularly, the authors thank RAJU DATHEPUTHE for checking grammar.
Ethical approval
This study did not utilize clinical data, human specimens, or laboratory animal. All information used in this study was sourced from publicly available videos content published on platforms such as YouTube, Bilibili, and TikTok. These videos are publicly accessible, and no personal privacy information was involved during the data collection process and no risk of privacy leakage. All analyzed content was publicly available, and the study did not involve the collection or processing of users’ private information. In accordance with relevant ethical review guidelines, ethical approval for this study was not required.
Contributorship
HS was involved conceptualization, software, methodology, and writing—original draft; YZ in visualization and investigation; TY in visualization and investigation; WZ in validation and writing—original draft; ZH in validation and writing—original draft; ML in validation and writing—original draft; ZL in validation and writing—original draft; FL in validation and writing—original draft; WT in conceptualization and writing—review & editing.
Funding
The authors disclosed receipt of the following financial support for the research, authorship, and/or publication of this article: This work was supported by the Natural Science Foundation of Jiangxi Province, Postdoctoral Research Foundation of China, National Natural Science Foundation of China, (grant number 20224BAB216074, 20232BAB206085, 2022M721452, 82403635).
Declaration of conflicting interests:
The authors declared no potential conflicts of interest with respect to the research, authorship, and/or publication of this article.
Data availability
All the data used in the study was publicly available at the time of data collection and did not require individual consent for use.
Supplemental material
Supplemental material for this article is available online.
References
Supplementary Material
Please find the following supplemental material available below.
For Open Access articles published under a Creative Commons License, all supplemental material carries the same license as the article it is associated with.
For non-Open Access articles published, all supplemental material carries a non-exclusive license, and permission requests for re-use of supplemental material or any part of supplemental material shall be sent directly to the copyright owner as specified in the copyright notice associated with the article.