
Abstract
The disparity in the data from intensive care units, where stroke victims and heart attack patients make up a minority, makes this effort extremely difficult. A well-known difficulty in data mining is handling unbalanced data. The main contribution of this work is a method that accurately identifies and categorises minority-class data, even in highly imbalanced datasets with small class sizes. This work predicts stroke from the balanced and compressed data from MIMIC III dataset. The Convolutional Neural Network-Gated Recurrent Unit with Imbalanced Data Handling (CNN-GRU-IDH) is proposed. Additionally, it reduces the amount of data transferred by compressing healthcare data using the Lempel Ziv Markov Chain Algorithm (LZMA). Class imbalance problems are addressed with the Synthetic Minority Over-sampling Technique (SMOTE). Notably, this study adds a novel element by employing the Improved Multi-Objective Wolf Pack Algorithm (IMOWPA) to choose the appropriate K nearest neighbour value for SMOTE. The suggested model surpasses existing models when used on the dataset, obtaining a remarkable accuracy rate of 87.66% and 85.63% of F1 score for 70% of training and 30% of testing data. The CNN-GRU-IDH approach, which tries to forecast the incidence of strokes, is used as the major data classification technique. This study makes a substantial advancement to improving patient-specific early stroke prediction, which might save lives and lower death rates.
This is a visual representation of the abstract.
Keywords
Introduction
Ischaemic stroke, another name for a stroke, is a localised softening or necrosis of brain tissue brought on by insufficient cerebral blood flow, which causes ischaemia and hypoxia, hemiplegia, verbal impairment, mental coma, etc.1,2 On the other hand, myocardial infarction also known as a heart attack that arises because of deficient blood flow or blockages interrupting the blood flow to or from the heart muscle and other organs.3,4 An alarmingly high mortality rate of up to 54% is experienced in stroke complicated by a heart attack, which is defined as cerebral infarction occurring concurrently with a heart attack. 5 Acute left heart failure, cardiogenic shock and ventricular arrhythmia are the three main causes of mortality in these situations.1,4,6 This delay might be crucial and may cause abrupt fatalities in heart attack patients given the quick onset of heart attacks. Through the examination of medical markers besides troponin, this study seeks to predict heart attacks in stroke patients. Troponin is a heart muscle protein that regulates cardiac contraction. Upon impairment of heart, troponin levels rise suddenly in the arteries. Therefore, it becomes a key attribute for diagnosing myocardial infarction. The goal is to make it possible for stroke patients who are having a heart attack to receive rapid treatment. Key medical indicators such as SpO₂ and heart rate help to evaluate oxygen distribution and cardiac capacity and are vital for detecting cardiovascular distress. Glucose and creatinine levels provide insight into metabolic and renal health which are strongly influence the risk of heart disease. Respiratory rate and SBP (systolic blood pressure) are the additional indicators for cardiopulmonary function and identifying hypertension. Based on these characteristics, a data processing technique has been created to foretell heart attacks in stroke patients. 7
Big data, the Internet of Things (IoT), and artificial intelligence (AI) are advancing quickly, opening up intriguing possibilities for applications that will alter industrial services. These potentials are accompanied by a number of significant problems, such as worries about latency, dependability and efficiently processing the enormous volumes of data created by IoT devices while maintaining a good level of service. Deep learning and active learning enable the interactive systems like autonomous vehicles, face recognition and expression analysis in various applications, speech recognition using natural language processing approaches, and also can be integrated to optimise in deployment, etc.6,8 Notably, deep learning (DL) has shown to be essential for understanding how diseases spread, particularly in light of the present global health crisis. 1 Healthcare systems using AI enables incessant monitoring, automatic anomaly detection, timely alerts is possible by analysing real-time data collected from sensors and electronic records and critical patterns generates from the data using AI algorithms such as machine learning (ML) and deep learning and its latest evolutions.This helps to predict the required outcomes and shows that intelligent systems transform healthcare applications from a reactive approach to a proactive rely on the principles of AI algorithms that enhances the well-being of the patient and causes to get effective outcomes.
Data mining and ML are essential tools for analysing and making predictions from large medical datasets in the contemporary healthcare scenario. The development of diverse prediction models, particularly for illness diagnosis, is the main focus. Due to the large number of elements contained in medical data, key characteristics are frequently carefully chosen to ensure reliable illness diagnosis. Consequently, it is essential to thoroughly study these important elements. 9 Furthermore, it is crucial to address the problem of managing minority cases. Clinical experience suggests that stroke patients who have experienced heart attacks are far less prevalent than stroke patients who have not, leading to an unbalanced dataset. For instance, there are around 30 times more stroke patients without heart attacks than instances with both illnesses (82 cases) in the Medical Information Mart for Intensive Care III (MIMIC III) database.10,11 Traditional ML techniques frequently prioritise characteristics from samples of majority data, disregarding minority data and frequently provide experimental findings with high acc but low P. 10 The data distribution for feature extraction in earlier classification algorithms is not successfully balanced by using conventional oversampling and under-sampling procedures. This research presents unique integrated approaches to balance the unbalanced data (general unevenness) distribution and improve classifier performance when used on such data in order to solve this. The objective is to address the issues posed by imbalanced (class-level inequality) datasets involving stroke patients, where traditional ML approaches frequently achieve high accuracy but fall short of reliability because they primarily concentrate on majority data characteristics while ignoring minority ones. In order to address this problem, this research introduces novel integrated approaches at the data level, successfully balancing the data distribution and improving classifier performance while working with such datasets. Primary multi-variate vital-sign predicting attempts have been facing challenges like performance and generalizability. Hu et al. 11 presented that even with neural networks using essential attributes and data for experimentation, worsening prediction required improvement in beyond the early threatening scores. Correspondingly, Blackwell et al. 12 described that a solo general model struggles compared to event-specific models in detection of in-patient deterioration. These limitations highlight the dire need of more robust approaches to address the aforementioned and high-dimensional clinical time-series data.
This article's primary contributions are:
First the MIMIC III dataset is pre-processed. Then, Healthcare data is compressed using LZMA (Lempel-Ziv-Markov Chain Algorithm) to reduce the amount of data transferred. SMOTE (Synthetic Minority Oversampling Technique)
13
is used to address issues with imbalanced data. To identify the K value of SMOTE, it utilizes IMOWPA (Improved Multi-Objective Wolf Pack Algorithm) optimization technique. CNN-GRU (Convolutional Neural Network-Gated Recurrent Unit) classification uses the data to train a machine to predict the likelihood that stroke patients would also experience a heart attack. This study utilises the MIMIC III database to evaluate performance measures.
The remaining sections of the study are organised in the form of follows: the relevant works are summarised in the second section, the suggested model is briefly explained in the third section, the results and validation analysis are shown in the fourth section, and the summary and conclusion are provided in the fifth section.
Related works
Sowjanya and Mrudula 14 developed a comprehensive two-step approach to address the challenges provided by imbalanced datasets in predictive modelling. Two improvements – Distance-based SMOTE (D-SMOTE) 15 and Bi-phasic SMOTE (BP-SMOTE) – were initially presented to boost the SMOTE's effectiveness. The strategic coupling of these adjustments with carefully selected classifiers to increase prediction acc outperformed the performance of typical SMOTE techniques. In the second stage of their plan, they created an ensemble stacked framework that included DL, ML and ensemble algorithms. This framework demonstrated a considerable gain in acc when compared to solo algorithmic methods for ML like Naive Bayes, Decision Trees and Neural Networks as well as ensemble techniques like Voting, Bagging and Boosting. It is interesting that Sowjanya and Mrudula introduced two innovative techniques called as Stacking CNN 16 and Stacked recurrent neural network (RNN), 17 which merged DL with the Stacking methodology. These new techniques provided considerably higher levels of P, with acc rates between 96% and 97%. Only a few of the datasets included in their study were the Framingham the dataset, the Wisconsin Hospital Breast Cancer Data, and the Novel Coronavirus 2019 dataset.
Using the Decision Tree model, BiLSTM DL, and a successful data balancing strategy, Woniak et al. 18 proposed an integrated IoT system model. With specially adjusted versions of well-known balancing algorithms as adaptive synthetic sampling and SMOTE-Tomek, they conducted comprehensive testing on data preparation. With the help of their technology, medical teams and patients may obtain automated diagnoses produced by the DL model and share safe documents while also evaluating questionnaires. By reaching great acc (above 96%), P (above 88%), and RC (RC) (above 96%), their research confirmed the efficacy of the suggested paradigm in illness diagnosis.
Peng et al. 19 presented a fault detection and diagnosis (FDD) method that combines active learning with semi-supervised learning methods in their work that was printed in the International Journal of Statistics in Computing. By carefully selecting annotated samples from unlabelled dataset, this method effectively identifies both known and unknown kinds of failures while lowering labelling costs. They created a new network-based semi-supervised classifier with dynamic graph construction in order to predict labels for imbalanced data and identify distinct classes. Their analysis of real and simulated datasets for vehicle air intake equipment revealed that their technique outperformed state-of-the-art methods for fleet-level FDD.
Xu et al. 20 proposed a special Global Contextual Multiscale Fusion Network (GCMFN) to enhance machines medical condition recognition. This network incorporated a multi-dilated fusing level and a non-local activating module for effective multi-scale feature discovery. Furthermore, they improved diagnostic effectiveness in imbalanced circumstances by using an online labelling smoothing approach. Through experiments on benchmark datasets related to various machine performance monitoring tasks, they demonstrated GCMFN's capabilities as a potential diagnostic tool.
Pan et al. 21 created the Power-law-based SMOTE (PL-SMOTE) to address the imbalance issue in multi-class serum statistical energy-based resampling (SERS) data. In order to balance the percentage of minority cases and class overlaps, their strategy incorporated a modifying factor. By carefully adjusting the deep neural networks model's settings using the PL-SMOTE method, they were able to develop a perfect cancer screening model with exceptional macro averaged RC and F2 scores. This method may be utilised alongside SERS cancer screening in other multi-class imbalanced situations.
A DL-based approach was suggested by Alourani et al. 22 to predict patient mortality using the MIMIC III dataset. They employed a number of variables to evaluate the success of their model, including the acc, F1 score, RC, P and time to execution. The results showed the model's capacity to predict patient death with acc, possibly helping to establish patient care priorities and reducing mortality rates. In their research, they compared their conclusions to cutting-edge models.
To improve the selection of mobile clients with higher data quality and transmission circumstances for model uploading, Zhang et al. 23 suggested a unique scoring-aided federated learning architecture. By devising a client selection technique based on scoring and combining channel state information and data rate into the scoring algorithm, their solution solved the problems presented by long-tailed data. Their suggested framework outperformed the industry standard FedAvg in experimental findings, which showed its superiority.
With the use of X-ray and near-infrared imaging, Shafi et al. 24 investigated sophisticated computer vision methods as well as ML and deep-learning models for diagnosing dental diseases. They called attention to problems with interpretability, socioeconomic inequality and a lack of data. Their assessment identified research difficulties, gave a thorough review of X-ray and near-infrared imaging systems, and assessed the effectiveness of existing techniques using openly available benchmarks. Ethics-related issues and potential research avenues in oral disease detection were discussed at the survey's conclusion.
An artificial neural network-based method was used by Raza et al. 25 to forecast maternal health concerns. They presented DT-BiLTCN, a unique deep neural network design that combines bidirectional long short-term memory networks, decision trees and temporal convolutional networks. They used synthetic minority oversampling to correct the disparity in class and were highly accurate in foretelling the threats to pregnant women's health.
A method of oversampling based on human and automatic augmentation was presented by Silveira et al. 26 who also tested several methods of classifier selection. Using decision trees, random forests and multi-class AdaBoosted decision trees, they used dynamic classifier selection techniques. Their method of utilising unbalanced and small datasets to predict chronic kidney disease in its early stages showed exceptional acc.
IMOWPA optimisation, the LZMA 27 data compression method, CNN-GRU classification and unique modelling approaches 28 are all used in this study to solve data imbalance while including SMOTE. This work also presents a thorough strategy. This underlines how important it is for healthcare to anticipate strokes accurately.
Proposed method
Figure 1 represents the overall flow of the proposed work.
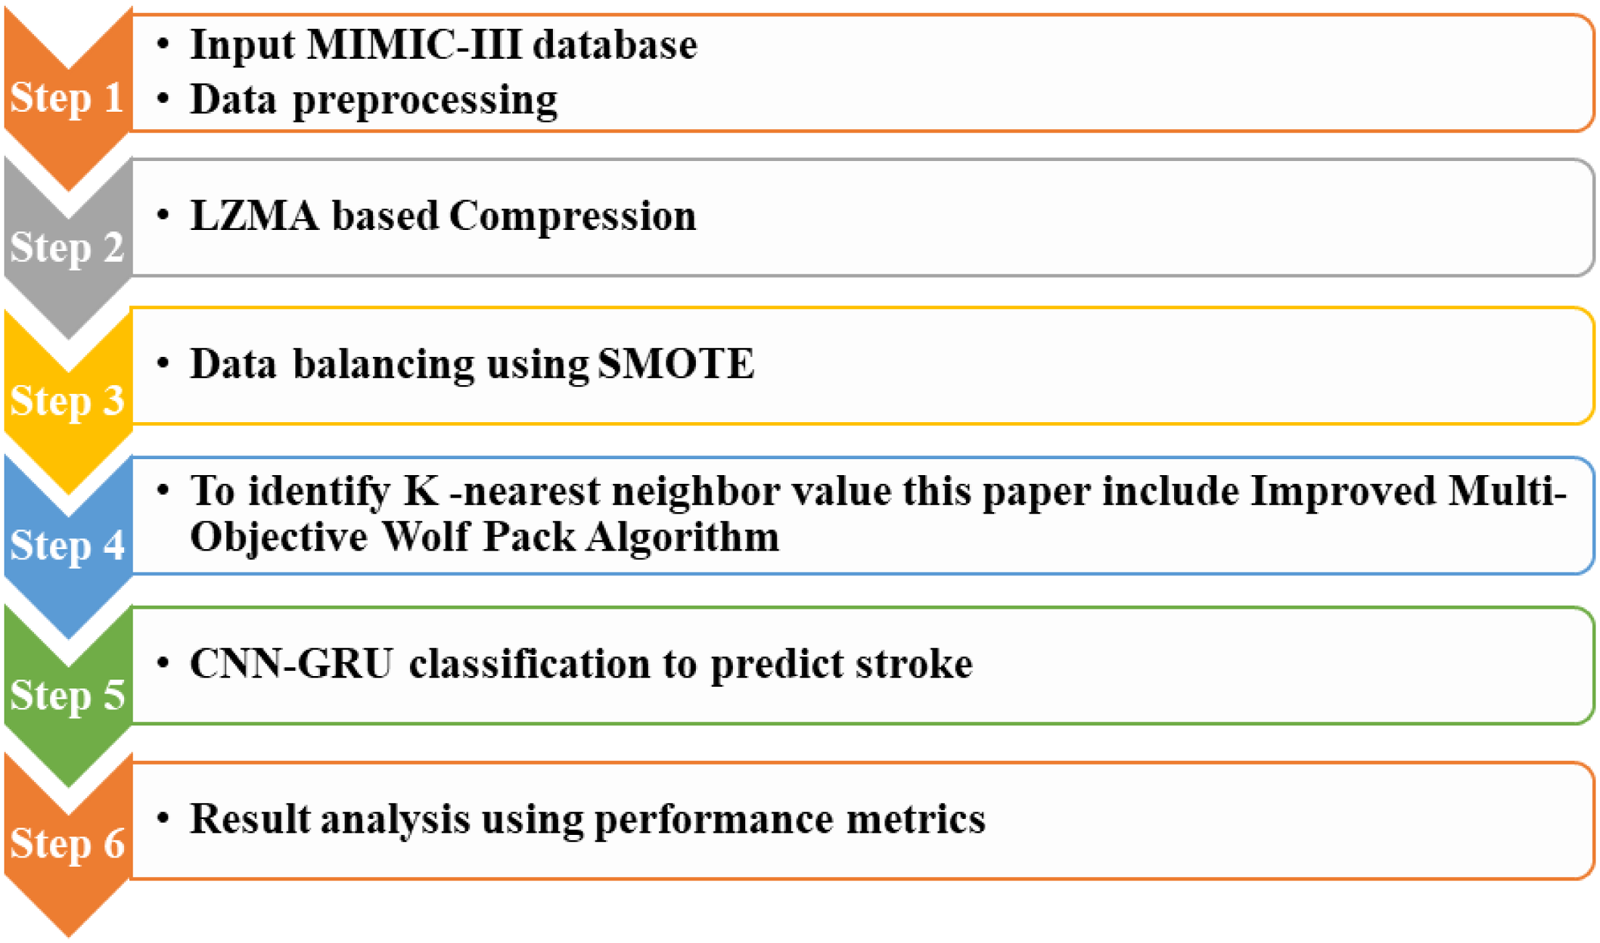
Proposed work flow.
Dataset analysis and data pre-processing
The MIMIC III database will be used as the main data source for the evaluation of the proposed model. The MIT laboratory's MIMIC III acts as a comprehensive database for important medical data. This large database consists of 26 CSV files that combine medical data from a sizable cohort of 46,520 patients, with an emphasis on the adult population, which consists of 38,606 people. While the ‘Icu-stays’ file painstakingly documents time-related information relating to patients’ admissions to and discharges from the Intensive Care Unit, the ‘Chart events’ file diligently records comprehensive medical examination data.
The gateway used to access the MIMIC III database was PostSQL. The ‘d-icd-diagnoses’ chart entries in this database include all of the illness categories assigned to each patient. The ICD9-Code value for cerebral infarction was used as filtering criteria to specifically find cases of stroke. Additional filters were then used, choosing samples from patients whose ages were more than 18 and whose stays lasted longer than 12 hours. And 2488 stroke sample datasets were produced as a consequence of the careful filtering procedure. As described in the reference, 29 troponin levels were used to assess if a heart attack had occurred in these samples. The occurrence of a heart attack was indicated by a troponin value of 1, whereas the absence of a heart attack was indicated by a value of 0. The 2488 stroke samples were divided into 2406 samples without heart attacks and 82 samples with heart attacks as a result.
Statistics for the 2488 stroke samples’ missing data are there in this database. Notably, two items – X. haemoglobin A1e and triglycerides – showed an excessive amount of missing data points and were subsequently eliminated (shown in purple). The strategy entailed filling in the gaps with average values obtained from already-existing data points within the corresponding indication in order to address missing data in the remaining medical indicators. A dataset of 2488 stroke patients and 34 medical markers was produced as a result of this method. In data analysis and prediction, taking into account extra medical markers is not always useful. It could result in more expensive computations and possible inter-index disturbances. To determine the effect of each medical indication on Troponin levels, a T-test was used. Two hypotheses were developed to begin this investigation:
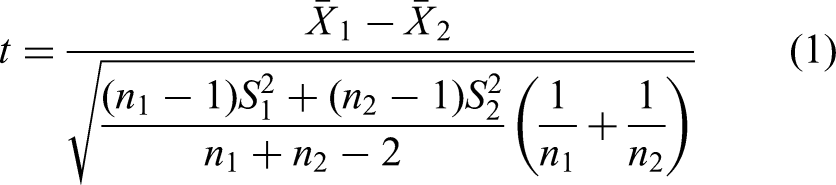
Among them,
Process for compression/decompression using LZMA
The LZMA model is used to compress and then decompress healthcare data after data pre-processing. The efficient reduction of data transmission and storage is the goal of this compression strategy. Pavlov built on the LZ_77 compression model when he created LZMA. It makes use of dynamic dictionary compression and sliding window-based interval coding methods, providing benefits including quick processing times, high compression rates and reduced decompression space needs. The ability of LZMA to accommodate dictionary sizes ranging from 4 KB to several million MBs is a significant feature. This versatility results in more cache spaces being allocated for searches and greater compression rates. LZMA uses a system where many possible matches are saved in a Hash table to speed up the process of finding longer string matches and quickly finds matching letters. For effective data retrieval, a binary search tree/Hash linked list data structure is also used. In order to optimise its efficiency for various dictionary sizes, the LZMA encoder additionally configures several hash algorithms for 2, 3 and 4 adjacent bytes.
Data balancing using SMOTE
One class is significantly under-represented in the MIMIC III dataset when compared to another, revealing a major class imbalance. This study uses the SMOTE in an effort to lessen the difficulties caused by the inherent class imbalance. SMOTE is an effective strategy for dealing with this problem since it corrects the imbalance by producing fictitious data points for the minority class. The K-Nearest Neighbour (KNN) technique, which locates data points that are close to one another in the feature space, is an essential part of the SMOTE approach. SMOTE picks a data instance and its closest neighbours when such data points have been found. After that, it uses this data to generate fake data instances that connect the chosen data point to its neighbours. By providing synthetic data that is different from the original minority class data, this interpolation approach successfully allays worries about overfitting.
The number of instances of synthetic data that will be created may be set by users, giving SMOTE flexibility. SMOTE randomly chooses an original data instance for synthetic generation if the necessary amount of synthetic data is negligibly little in comparison to the size of the original dataset. Conversely, when a substantial number of synthetic instances is needed relative to the original dataset size, the method automatically generates synthetic data instances according to a predefined oversampling ratio. The SMOTE technique's primary inputs are the oversampling ratio (N), the count of nearest neighbours (k) and the number of minority data instances (T). Finding and choosing the nearest neighbour is the first step in the procedure. The next step is to interpolate data from these neighbours to the original minority class instances to create synthetic instances. If we take the minority class as an example, it would be represented as


K-value identification of SMOTE by IMOWPA
The Wolf Pack Algorithm (WPA) is inspired by the wolf's hunting propensity for predatory behaviour. It encompasses the three different types of cognitive behaviour that may be seen in wolves: siege, calling and roaming. A hierarchical structure is created inside this algorithm, with the leader wolf standing in for the best performer. A renewal process is used to maintain the wolf pack's quality; the strongest wolves are kept while the lesser ones are eliminated, as described in reference [30]. WPA has experienced issues with being stuck in local optima and converging too quickly since it was first created to address continuous function optimisation concerns. Three important intelligent behaviours in WPA have been improved in response to these drawbacks and in an effort to modify the algorithm to the stroke problem. By incorporating these upgrades, the proposed framework not only broadens the search space but also facilitates the discovery of globally optimal Pareto solutions, leading to more balanced and accurate results.
Population initialization
The quality of the first answer has a direct impact on how well the algorithm performs. While it is a widely used method that encourages variation among the starting population, random initialisation cannot guarantee the quality of the answers. Three different rules are used to produce the starting population in the context of optimisation:
The process that aims to reduce the maximum completion time; The technique focused on reducing energy consumption Figures and The process of random generation.
Each of these rules receives a certain amount of the population size in order to improve the quality of the first solutions: 40% for the first rule, 40% for the second rule and 30% for the random generation technique. With this allocation technique, this want to provide the optimisation process a better place to start.
Ranking of non-dominated crowds
After categorising individuals into distinct groups, the non-dominated crowding ranking technique is used to assess the amount of congestion or crowding inside each level. This method successfully updates the locations of imaginary wolves as the iterative process progresses, allowing the wolf packs to keep the most promising solutions while removing the less effective ones. Figure 2 depicts the non-dominated sorting procedure graphically.

Sorting without dominance.
It's crucial to distinguish between persons in the same layer after individual stratification. Each person's advantages and disadvantages are distinguished using the crowding distance. Formula (3) illustrates how to calculate the crowding distance of people. The people with greater crowding distances are dispersed across the throng. One may assess the distribution homogeneity of the solution set based on the crowding distance.
Intelligent behaviour design
Crossover and mutation operators inspired by genetic algorithms have been introduced into each of the three intelligent behaviours inside the WPA framework in order to guarantee a wide range of workable solutions and improve the local search capabilities of the algorithm. Furthermore, by using a non-dominated ranking technique and an elite retention strategy, the algorithm's capacity to find workable solutions is strengthened. Specialised crossover and mutation procedures have been painstakingly constructed in order to preserve the integrity of solutions and prevent the formation of incorrect outcomes following the application of intelligent behaviours. These processes care for both the encoding method and the particularities of stroke. Specifically, a Partially Mapped Crossover is used for the summoning behaviour, a dual-layer mutation is used for the roaming behaviour, and a mutation operator is used for the besieging behaviour.
In terms of wandering behaviour, there are two types: machine wandering and process wandering. Figure 3's depiction of the process wandering feature focuses our attention on the random selection of stepa1 process codes, each of which corresponds to a distinct work piece. These chosen codes are then organised in a random order and put into the open spaces inside the first run of process codes. The various location vectors used by these stepa1 process codes help to direct the motion of the wolves-detection devices.

Process wandering behaviour.
During the calling practice, a random selection is taken from a set of at least two machines, each of which corresponds to its own machine set, under the situation where machine wandering continues with step stepa2 = 1. For the machine code wandering operation, this choice is made. The wolf pack is evaluated using the non-dominated crowding degree ranking technique. A subset of the top Pareto solutions is chosen at random to form the Xleader solution set. Next, the Partially Mapped Crossover (POX) crossover approach is used as follows and also shown in Figure 4.

Flowchart for POX crossover operation. POX: Partially Mapped Crossover.
At the same positions as the number of serials of the associated work pieces, the serial values of the elements are relocated to child X1’. These numbering systems for the component were chosen at random from parent X1. After then, two complementary, non-empty sets, Q1 and Q2, are given the component serial numbers at random. Serial numbers for the work pieces from parent Xleader that correspond to set Q2 are successively inserted into child X1's open places. In contrast, the parent Xleader, which is holding set Q1, contains component serial numbers that are removed and placed into the child Xleader while maintaining their original places. Finally, keeping their arrangement in alphabetical order, the set of Q2 component serial numbers from parent X1 is picked and entered into the open slots of child Xleader’. Figure 5 depicts the POX crossover procedure in graphic form.

Structure of GRU model. GRU: Gated Recurrent Unit.
Adjustments to the machine code may be adjusted as required since the siege behaviour only applies to the process code. The customisable integer parameter known as ‘stepc’, which stands for ‘siege step size’, acts as a warning sign for increasing wandering behaviour. Consider the process code for artificial wolf Xi, which is [1,1,2,3,3,1,2,2,3] and contains the unique code number 9. It's vital to keep in mind that during the siege stage, the best solution range might easily vary owing to an inappropriate setting of the siege step size. Usually, a step size between 0 and 9 is chosen at random.
Typically, between one-third and 50% of all the different codes are used to determine this step size. In order to update the wolf pack, the siege behaviour process must be incorporated. To do this, R synthetic wolves with the lowest scent concentration value – that is, those with a higher goal function value – must be eliminated. The next step is to create R new synthetic wolves utilising a non-dominated crowding sorting technique. The range of [M/(2b), M/b], where ‘b’ denotes the population update percentage factor and ‘M’ denotes the quantity of synthetic wolves, is where the value of R often falls.
Flow of the algorithm
To summarise, the IMOWPA algorithm steps’ flow chart and specifics are explained as follows:
Step 1: Set the algorithm's parameters to zero.
Step 2: Q =? is established, the objective function value for each artificial wolf in the initial population is determined, the population is swiftly sorted into layers, and the set is updated.
Step 3: The fitness value is assessed to see if the maximum number of walks, Tmax, has been attained. The best-performing artificial wolves are chosen if the fitness assessment shows that the maximum number of walks has not been reached. Then, for the detection wolves, these chosen wolves exhibit the double walk behaviour, requiring modifications to both process coding and machine coding. The detecting wolves’ locations are then adjusted in response to these activities. Up until the Tmax requirements are satisfied, this procedure is repeatedly repeated. When Tmax is reached, the algorithm moves on to step 4.
Step 4: The remaining artificial wolves are classified as the aggressive wolves, and the summoning procedure is started by the detecting wolves. During this step, one of the detecting wolves is chosen at random to carry out a POX operation. The POX crossover approach is then used to modify the placements of the aggressive wolves depending on the determined prey odour concentration value for each manufactured wolf.
Step 5: For carrying out the siege behaviour, an enraged wolf works with identifying the wolf. The target for the siege is chosen at random during this behaviour from the locations of fictitious wolves demonstrating the best fitness values for each optimised sub-goal. Each false wolf's placement is altered when the siege behaviour is finished. The better Pareto solutions are then determined using the computed and recorded optimised objective function values. Individuals are sorted, and then the outside profile set is updated.
Step 6: Population renewal based on the viability of the strongest.
Step 7: Analyse the algorithm to see if it has achieved the termination condition. If so, then the Pareto optimum solution set should be used to produce a set of optimal solutions. If not, move on to step 3.
Classification using CNN-GRU
In this stage of the procedure, the data are classified to see whether a stroke sickness exists or not using the CNN-GRU model. The fully connected (FC), pooling and layers of convolution make up the CNN, a multi-layer neural network structure. The feature extraction in this system is handled by the pooling and convolution layers, while the classification of medical data is handled by the FC layer. There are intricate relationships between each layer and the one that sits above it, with the outputs of one layer serving as inputs to the next. The network parameters are trained and fine-tuned using the back propagation (BP) method.
The Long Short-Term Memory (LSTM) network 13 is composed of three fundamental gates: the entry gate, updated gate and forgot gate. On the other hand, the GRU is a simpler model with only two gates: the gate that resets and the update gate. These gates are essential for judging the relevance of incoming data. The vital information is maintained, while the less significant information is eliminated. As a result, neural units within the same layer of the CNN-FC network are not directly connected. The GRU network is used in lieu of the CNN-FC layer to transform classification problems into sequence-based tasks. The CNN's detection effectiveness is increased by taking into consideration the classification outcomes of every map of features when deciding how to categorise the map of features that follows it in the same hidden layer. In Figure 6, the recommended GRU framework is shown. Additionally, the dropout technique is utilised to lessen any overfitting issues that may arise from the CNN-GRU method by periodically disabling certain neural units inside the hidden layer.
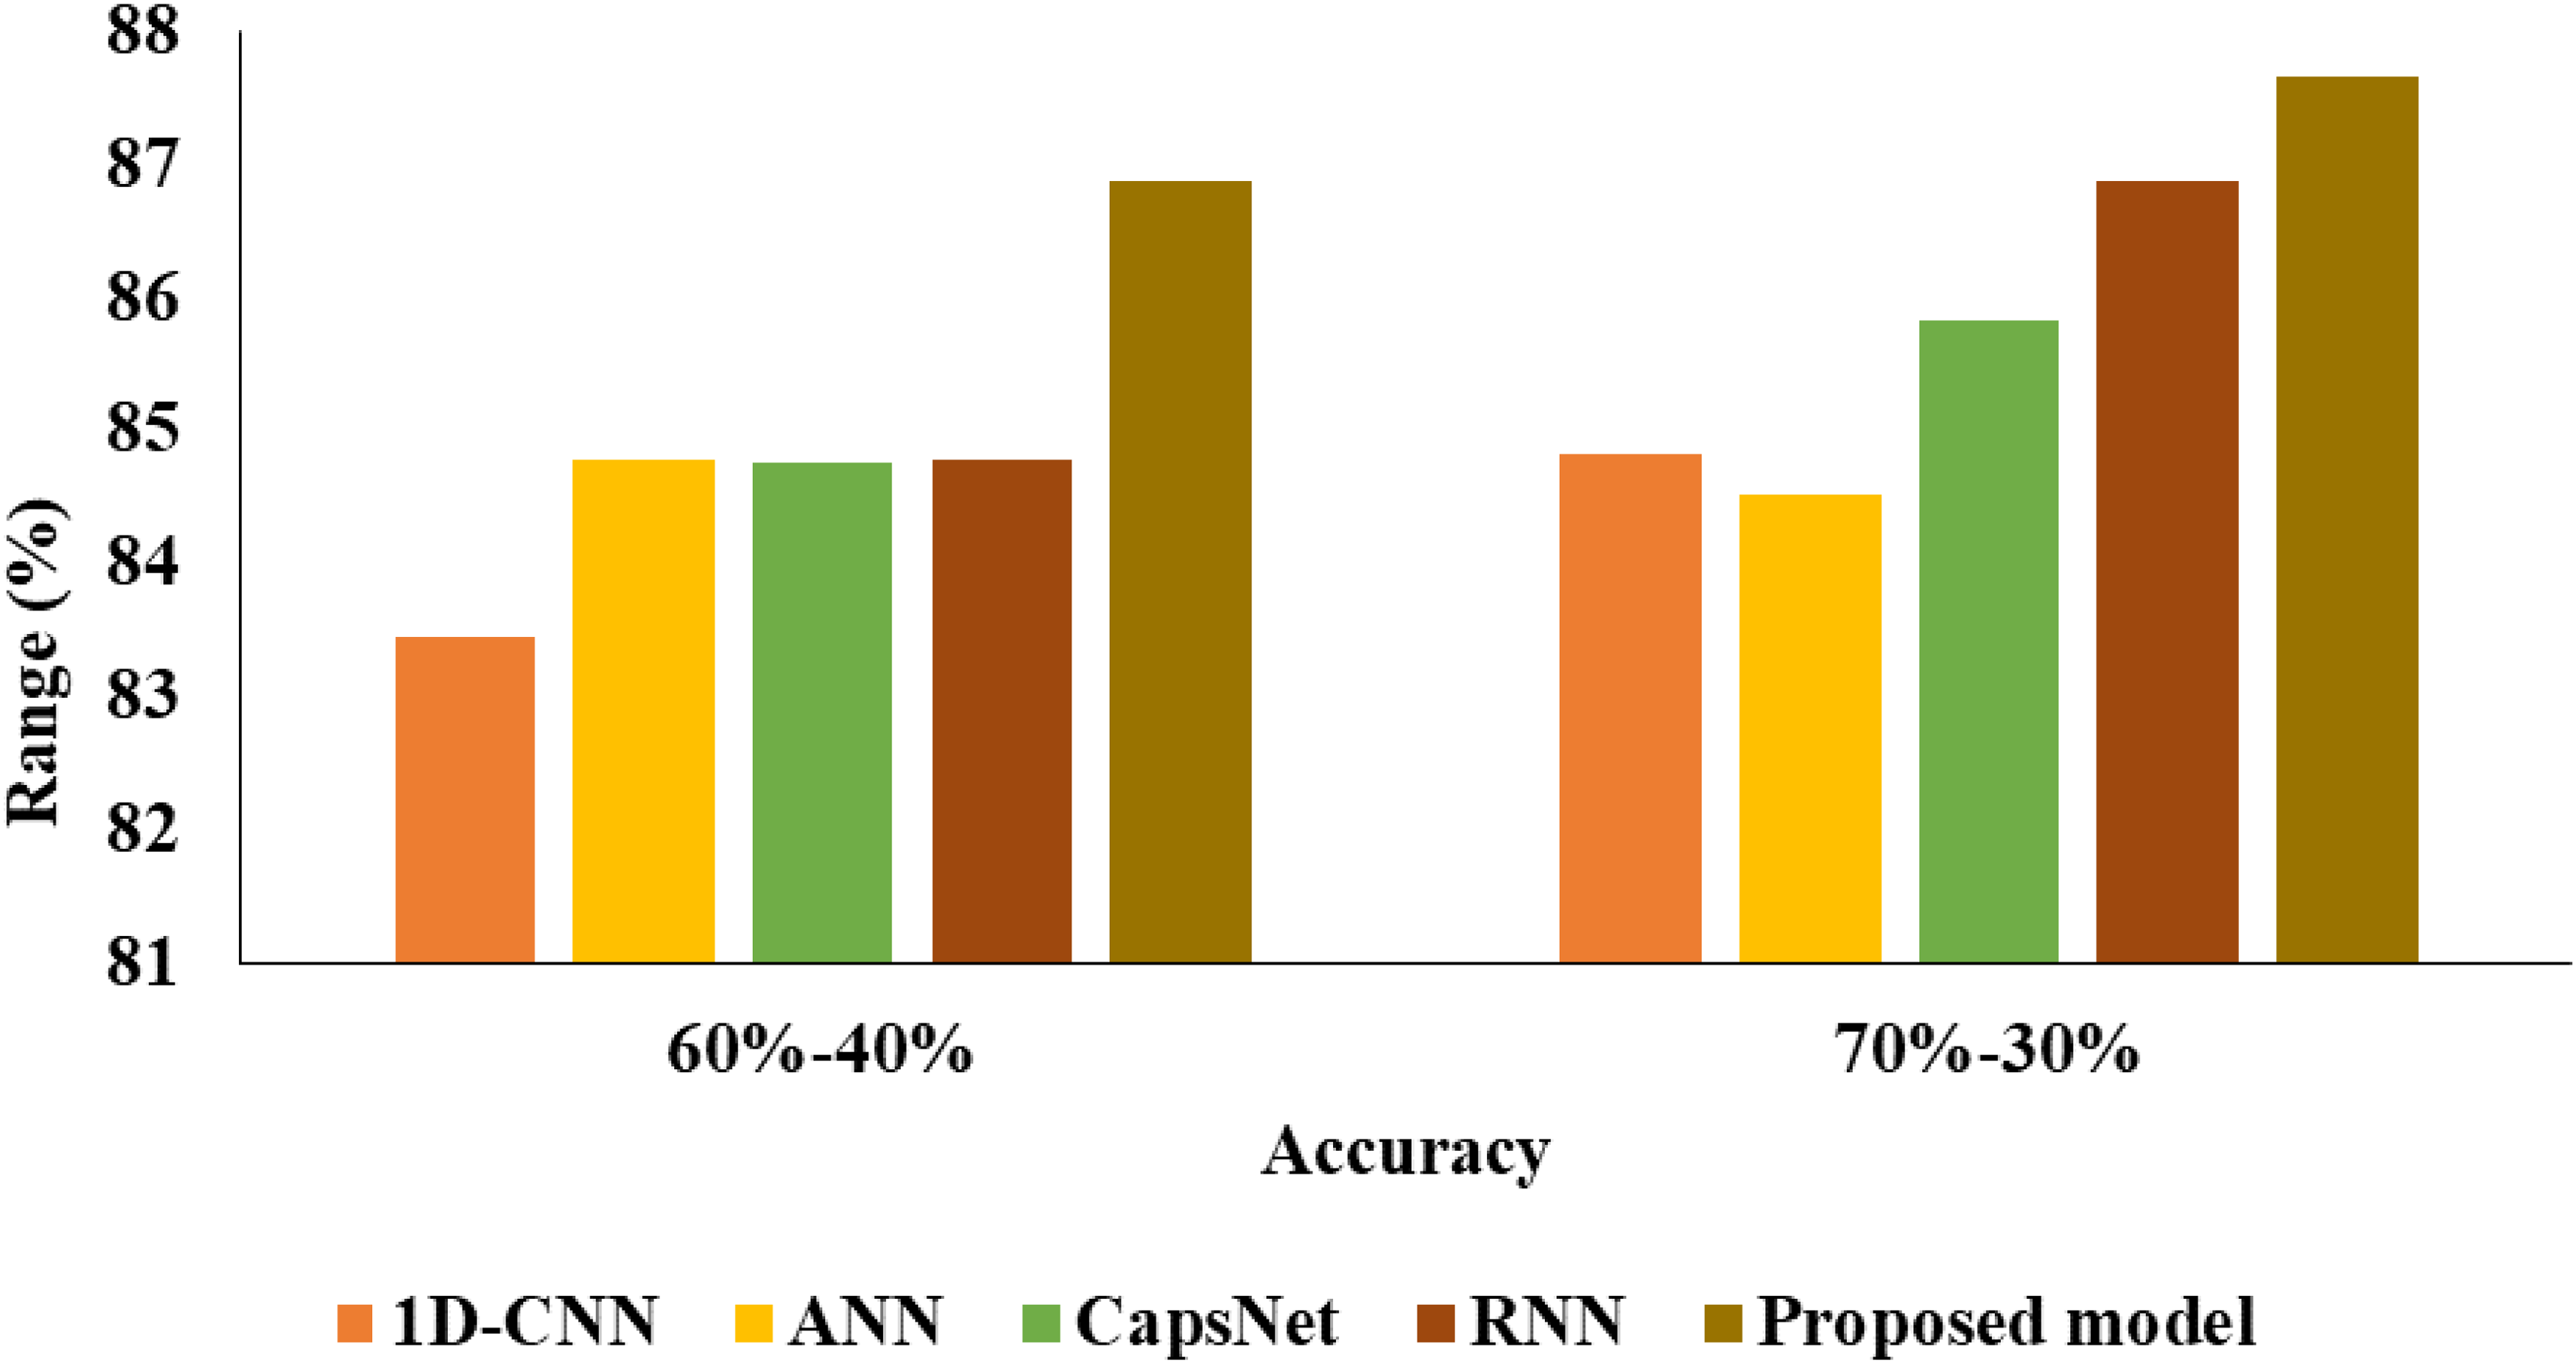
Accuracy analysis.
The feature extraction process is carried out inside the CNN-GRU framework by adding a unique CNN input along with resizable layers for convolution and pooling of various sizes. Equation (4) is used to calculate all of the feature maps that are produced in the first convolution layer.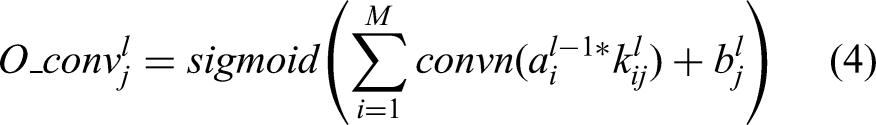

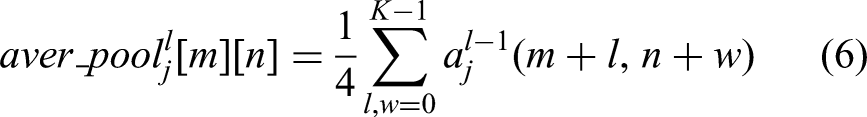
Establishing connections between each feature in the feature maps resulting from the final CNN pooling layer and a matching GRU technique is what comes next. The softmax function, which is obtained from equation (7) and used for the categorisation of medical data, is then used to stimulate the GRU findings. Each GRU output is evaluated collectively during the testing rounds using a voting system to determine the final detection outcome.
Results and discussion
Experimental arrangement
In this part, the WEKA 3.8.6 environment is used to assess the efficacy of the DL models. The GNU (General Public Licence) was used to produce and distribute WEKA, a free JAVA-based data mining tool. It offers a huge library of models for activities. The tests used the following PC specifications: Windows 10 Home with a 64-bit operating system, an x64-based processor, an Intel(R) Core(TM) i7-9750H CPU running at 2.60 GHz or 2.59 GHz, and 16 GB of memory.
Performances metrics
A variety of assessment indicators were used in this study to evaluate the effectiveness of the suggested approach. Accuracy (Acc), the Receiver Operating Characteristics Curve (AUC), F1 score (F1), precision (P), Recall (RC), and Average Precision (AP) are some of these measurements. By calculating the average epoch training time, abbreviated ‘e-Time’, the computational cost of training was also assessed. Equation (8) was used to calculate acc:
The standard metrics used in classification evaluation are defined in this paragraph. True positive is denoted by TP, true negative by TN, false positive by FP and false negative by FN. These metrics are essential for evaluating how well categorisation models work.
Equation (9) is used to compute the P:
The RC is derived using equation (10) below:
Equation (11) gives the formula for calculating the F1:
Using area under the ROC curve (AUC) curves, the true positive rate and false positive rate are compared across various decision criteria. The weighted mean of acc acquired at each threshold is calculated by AP, which represents the P-RC curve.
From Table 1 and Figures 7 to 11 the analysis based on 60% to 40%, 1D-CNN had 83.46% of acc, 87.45% of AUC, 80.85% of F1, 82.10% of P, 79.64% of RC and 0.7431 of AP. ANN had 84.78% of acc, 88.51% of AUC, 81.87% of F1, 85.62% of P, 78.44% of RC and 0.7661 of AP. CapsNet had 84.77% of acc, 88.07% of AUC, 82.84% of F1, 81.87% of P, 83.83% of RC and 0.7572 of AP. RNN had 84.79% of acc, 89.13% of AUC, 82.63% of F1, 82.63% of precsion, 82.63% of RC and 0.7590 of AP. The proposed model achieves 86.88% of acc, 90.58% of AUC, 85.03% of F1, 85.03% of P, 85.03% of RC and 0.7886 of AP.

AUC analysis.
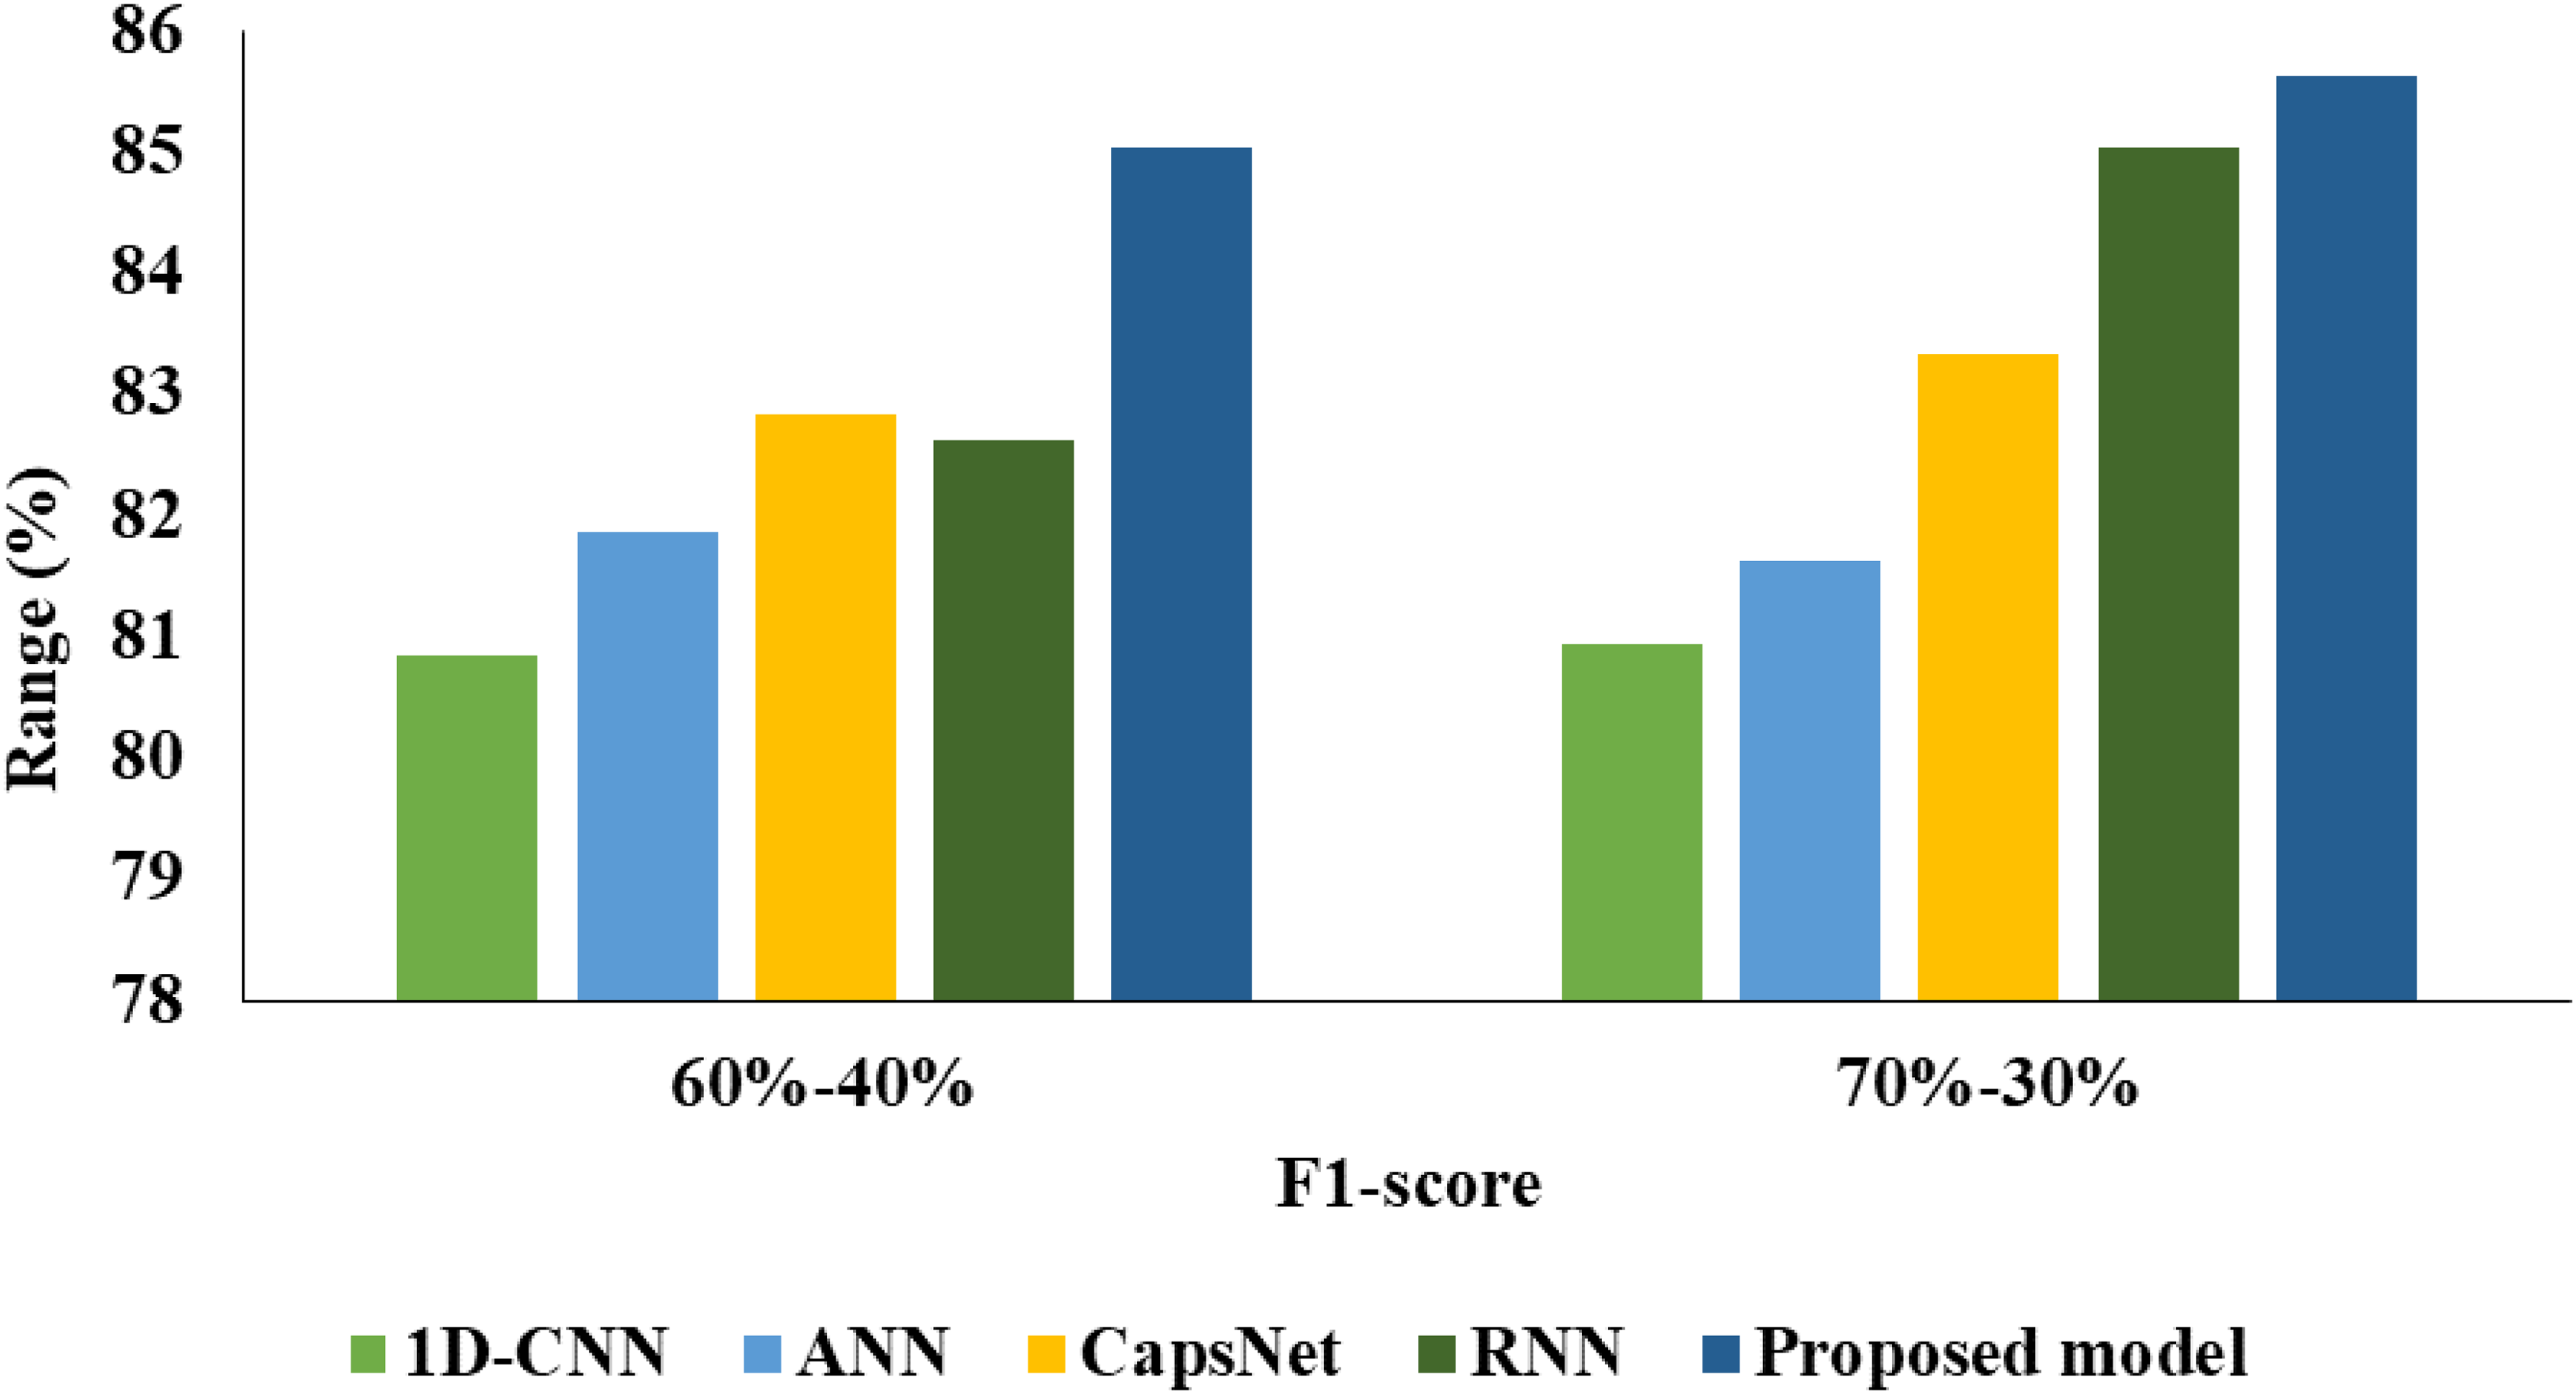
F1 analysis.

P analysis.

RC analysis. RC: Recall.

AP validation. AP: Average Precision.
Analysis of proposed model for 60% to 40%.

Acc: accuracy; AP: Average Precision; AUC: area under the ROC curve; RC: Recall; RNN: recurrent neural network.
From Table 2 and Figures 6 to 11 the analysis based on 70% to 30%, 1D-CNN had 84.82% of acc, 87.97% of AUC, 80.95% of F1, 81.51% of P, 80.41% of RC and 0.7339 of AP. ANN had 84.51% of acc, 86.49% of AUC, 81.62% of F1, 85.06% of P, 78.44% of RC and 0.7618 of AP. CapsNet had 85.83% of acc, 87.87% of AUC, 88.33% of F1, 85.99% of P, 80.84% of RC and 0.7791 of AP. RNN had 86.88% of acc, 90.58% of AUC, 85.03% of F1, 85.03% of P, 85.03% of RC and 0.7886 of AP. The proposed model achieves 87.66% of acc, 91.35% of AUC, 85.63% of F1, 87.50% of P, 83.83% of RC and 0.8044 of AP. Since models have a tendency to memorise the dominant class, imbalanced datasets might make them more susceptible to overfitting. By offering a more balanced training set, SMOTE helps to lower this risk. This can improve model generalisation and, as a result, increase model acc on test data.
Analysis of proposed model for 70% to 30%.

Acc: accuracy; AP: Average Precision; CNN: Convolutional Neural Network; RC: Recall.
The IMOWPA efficiently optimises the K value of SMOTE, which improves the creation of synthetic data for unbalanced datasets, according to Table 3. Because the IMOWPA optimisation model outperforms all other methods in terms of acc, it is the most effective predictor overall. If compared to IMOWPA, the convergence rates of the Firefly Algorithm (FA), Ant Colony Optimisation (ACO), Cuckoo Search Optimisation (CSO), Harmony Search Optimisation (HSO), and Whale Optimisation Algorithm (WOA) may be slower, leading to longer optimisation times.
Optimisation analysis.
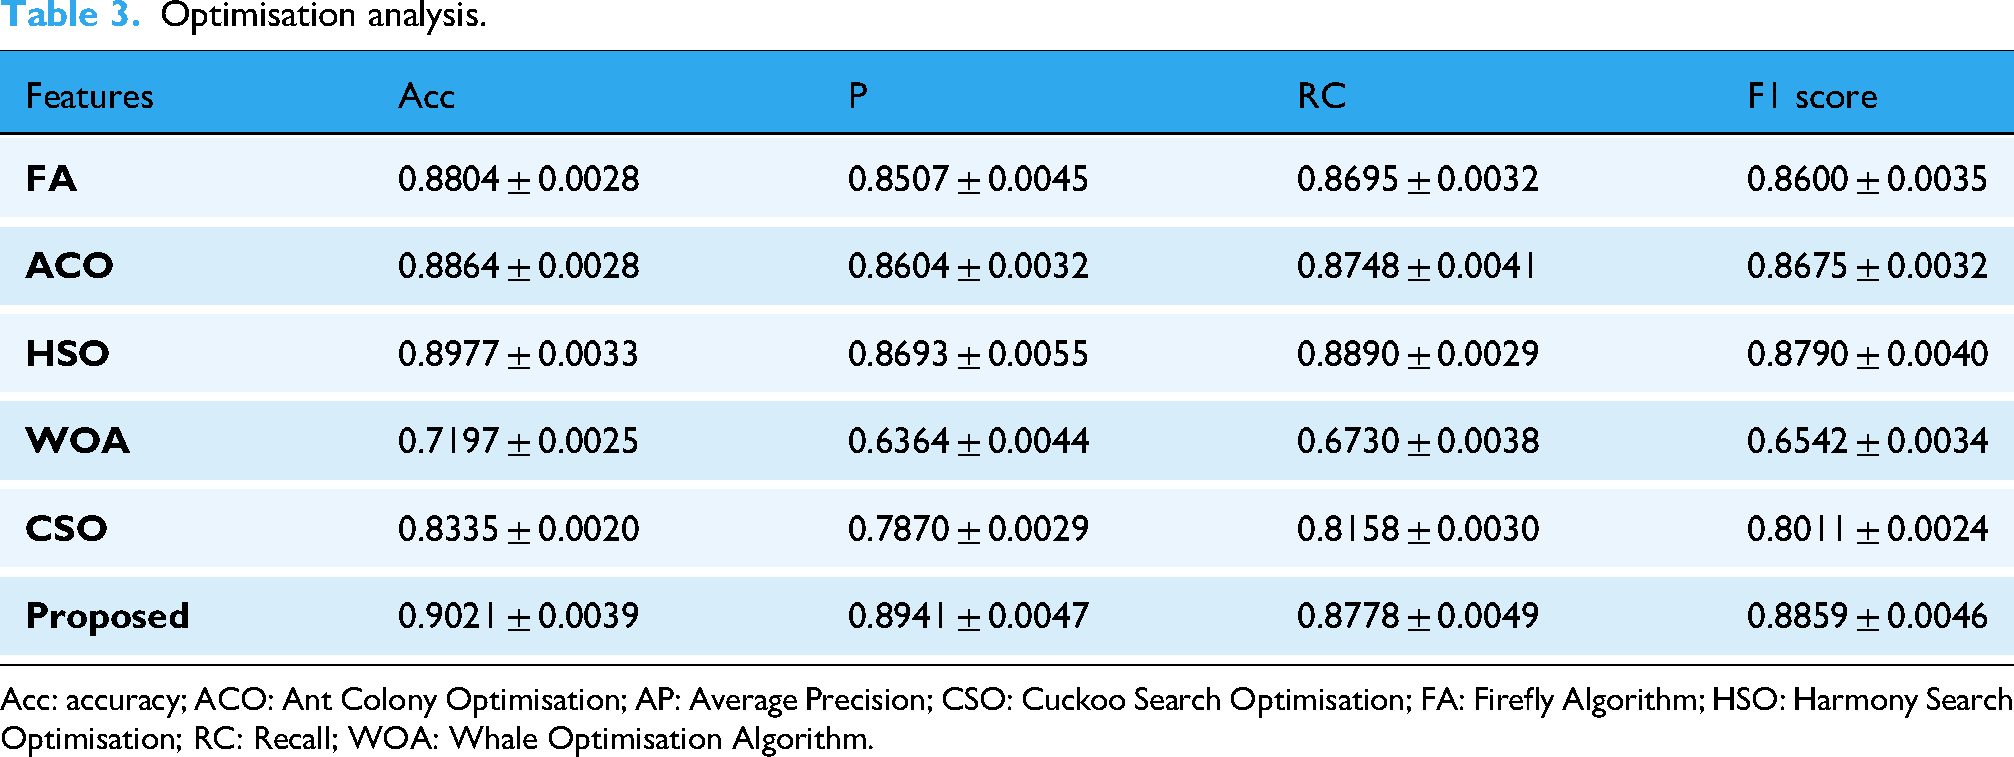
Acc: accuracy; ACO: Ant Colony Optimisation; AP: Average Precision; CSO: Cuckoo Search Optimisation; FA: Firefly Algorithm; HSO: Harmony Search Optimisation; RC: Recall; WOA: Whale Optimisation Algorithm.
Conclusion
In scientific research, addressing the problem of imbalanced datasets is of paramount importance. Graph theory also encounters such unbalanced sets. The minority class is more significant in these datasets, although it is represented by many fewer instances than the dominant class. When dealing with a large number of examples belonging to the majority class, conventional classification techniques face difficulties that often result in high acc but decreased reliability when categorising the minority class. In order to address this issue, this work presents unique hybrid methodologies at the data level with the goal of balancing the distribution of the data and improving classifier performance. A new CNN-GRU-IDH model has been created in this study to identify illnesses in a cloud-based setting with IoT capabilities. The model uses LZMA-based data compression, Imbalanced Data Handling (IDH) based on SMOTE, CNN-GRU-based classification, and IMOWPA for calculating the ideal K value. On benchmark datasets, several simulations were run to demonstrate how well the CNN-GRU-IDH model performed, outperforming current state-of-the-art techniques. The CNN-GRU-IDH model therefore shows potential as a useful real-time diagnostic tool for the healthcare industry. Notably, the proposed model outperforms previous models with a high acc rate of 87.66%. The development of outlier identification and clustering approaches may be necessary to improve the CNN-GRU-IDH model's classification performance in the future.
Footnotes
Author contributions
RA, UM, KS: Conceptualization; UM, RA, GGT: Methodology; UM, RA KS, JKKA: Formal analysis & data curation; RA, UM, SKB, JKKA, SJM: Writing – original draft preparation; RA, SJM, SKB, GGT: writing – review & editing; RA, SJM, UM, GGT, SJM: Supervision. All authors have read besides approved the published version of the manuscript.
Funding
The authors received no financial support for the research, authorship, and/or publication of this article.
Declaration of conflicting interests
The authors declared no potential conflicts of interest with respect to the research, authorship, and/or publication of this article.