
Abstract
Introduction
Acute dizziness accounts for approximately 4% of emergency department (ED) visits, with stroke often missed. Current methods for stroke detection in dizzy patients have notable limitations, with vestibular strokes missed in a substantial proportion of ED visits. This study aimed to develop a machine learning (ML) tool to assess stroke risk in patients with acute dizziness.
Methods
We developed an ensemble model combining four ML algorithms using structured electronic medical record data and unstructured ED physician notes. Model performance was evaluated on a holdout test set and compared with the ABCD2 score using area under the receiver operating characteristic curve (AUC), net reclassification improvement (NRI), integrated discrimination improvement (IDI), and decision curve analysis.
Results
The ensemble model achieved the highest AUC at 0.880, significantly outperforming the ABCD2 score (AUC 0.673) and individual ML models. The ensemble model demonstrated superior calibration with the lowest Brier score and showed greater clinical utility across different risk thresholds. Features extracted from unstructured clinical text substantially enhanced model performance, with models combining structured and unstructured data consistently outperforming those trained on structured data alone.
Conclusions
Our ensemble prediction model effectively stratifies stroke risk in ED patients with acute dizziness. By integrating natural language processing of clinical notes with structured patient data, the model offers a more accurate risk assessment than traditional methods. The implementation of this tool could improve patient outcomes by directing advanced neuroimaging to high-risk patients while avoiding unnecessary testing in low-risk patients, ultimately enhancing patient safety and optimizing resource utilization.
Introduction
Acute dizziness accounts for approximately 4% of emergency department (ED) visits worldwide, ranging from benign vestibular disorders to life-threatening stroke. 1 The challenge for emergency physicians lies in accurately differentiating between these conditions, as misdiagnosis can cause significant morbidity and mortality. Despite its importance, stroke remains one of the most frequently missed diagnoses in patients presenting with dizziness or vertigo in emergency settings.
Current diagnostic methods face notable limitations. Routine neurological exams often fail to detect subtle deficits from posterior circulation strokes, which can be small and spare main neural pathways. 2 Vestibular strokes are missed in up to 35% of ED visits, versus only 4% for those presenting with motor weakness. 3 Computed tomography scans have poor sensitivity for posterior fossa ischemia, 4 while magnetic resonance imaging (MRI), though more sensitive, is more resource-intensive and often unavailable in emergency settings.
Existing assessment tools include the ABCD2 score, 5 the head impulse, nystagmus, and test of skew (HINTS) exam, 6 the STANDING diagnostic algorithm, 7 and the TriAGe+ score. 8 While the latter three outperform ABCD2 in identifying the causes of central vertigo,9–11 emergency physicians often struggle with administering and interpreting these tests properly. 12 HINTS can produce false positives in patients without acute vestibular syndrome, leading to unnecessary imaging. 11 At the same time, HINTS, STANDING and TriAGe+ require specialized neurological assessment that may be difficult to perform in busy EDs with varying levels of staff expertise. 13
Known stroke predictors in patients with dizziness include advanced age, male gender, diabetes, atrial fibrillation, previous cerebrovascular disease, recurrent vertigo, and high blood pressure at ED presentation.14–18 These factors, combined with clinical features, can help assess risk. Electronic medical records (EMRs) include both structured data (such as demographics and vital signs) and unstructured text (like clinical notes) that may contain useful information for predicting stroke risk in these patients.
A clinical decision tool for stroke risk assessment in patients with acute dizziness is urgently needed due to current diagnostic challenges. With stroke frequently misdiagnosed and existing methods limited, emergency care has a significant gap. Therefore, this study aims to develop and validate a prediction model using EMR data through natural language processing (NLP) and machine learning (ML) to assess the risk of stroke in ED patients with acute dizziness.
Methods
Study setting and data source
This retrospective study was conducted at Ditmanson Medical Foundation Chia-Yi Christian Hospital, a 1000-bed tertiary teaching facility in southern Taiwan. The ED handles 75,000 to 105,000 annual visits. Data came from the Ditmanson Research Database (DRD), a de-identified research repository containing administrative claims, EMRs, and National Death Index vital status data. Previously described in literature, 19 the DRD houses clinical data for approximately 1.6 million hospital patients. It contains structured data (demographics, diagnoses, prescriptions, procedures, ED triage information, physiological measurements, laboratory results) and unstructured text (physician notes, nursing notes, radiology reports, and pathology reports).
Study population
Taiwan’s EDs use the Taiwan Triage and Acuity Scale, 20 adapted from the Canadian system, which organizes complaints by organ systems. Triage nurses assess each patient’s primary complaint, which formed the basis for our study population selection.
As shown in Supplemental Figure S1, we extracted triage data using SQL from the DRD for patients ≥20 years who visited the ED for acute dizziness (2012 to 2021). Dizziness complaints included vertigo, lightheadedness, gait imbalance, and nonspecific dizziness. We included only initial visits for patients with multiple presentations, excluded those lost to follow-up (no visits within two years), and removed patients with confirmed stroke during the ED visit, unavailable EMR data, or no blood tests.
To predict acute stroke in dizzy patients, we focused on strokes within seven days post-ED visit. We excluded patients with stroke diagnoses from 8 to 365 days post-visit. Those diagnosed within seven days were classified as stroke cases, while those without any stroke diagnosis within one year served as non-stroke controls.
Features
Features were extracted from structured and unstructured data. Structured data (Supplemental Table S1) includes demographics, stroke risk factors, triage information, vital signs, and laboratory results. Due to the link between inflammation and stroke risk, 21 inflammatory markers (neutrophil-to-lymphocyte, monocyte-to-lymphocyte, platelet-to-lymphocyte, and platelet-to-white blood cell ratios) were also considered.
Variables with >50% missing data were excluded. Outliers, defined as ±4 standard deviations from the mean, 22 were imputed along with missing data using multivariate imputation by chained equations (MICE), first on the training set and then on the holdout test set using the derived prediction matrix. The MICE algorithm sequentially fills in missing values one variable at a time using other variables as predictors. 23 This process iterates multiple times until convergence or a preset iteration limit is reached.
For continuous variables, predictive mean matching prevented out-of-range imputations, while logistic regression handled categorical variables. MICE created five imputed datasets; continuous variable values were averaged, 24 and categorical variables used the mode. After imputation, continuous variables were normalized to zero mean and unit standard deviation, while categorical variables were binary encoded (0 = absent, 1 = present).
We extracted unstructured data from ED physician notes. Two text vectorization methods were tested: a basic “bag-of-words” (BOW) approach and a deep learning approach using the bidirectional encoder representations from transformers (BERT) language model. Text preprocessing included: (1) spell-checking and auto-correction using Jazzy spell checker (https://github.com/kinow/jazzy); (2) expanding acronyms with a clinical terms list; (3) removing non-ASCII and non-word special characters; (4) converting to lowercase; (5) lemmatizing words; (6) removing stop words. Only steps 1 through 3 were needed for the BERT approach.
For BOW, we built a document-term matrix with columns representing unique words and rows representing patient documents. Matrix cells indicated word presence. To reduce redundancy and improve efficiency, 25 we removed words that appeared in fewer than 5% or more than 95% of training documents and applied penalized logistic regression with 10-fold cross-validation to identify predictive words.26,27
For BERT, we used the language model to convert clinical text into context-aware vectors. BERT is a deep neural network that uses bidirectional transformers trained through masked language modeling and next-sentence prediction. 28 We specifically employed ClinicalBERT, 29 a version adapted for medical text.
Model building
Figure 1 illustrates the model-building process. We combined features from both unstructured clinical text and structured data. The dataset was divided by year into a training set (2012–2018) and a holdout test set (2019–2021), as shown in Supplemental Figure S1. Models were developed using the training data, with the holdout test set reserved exclusively for final evaluation to prevent information leakage. To enhance the robustness of our findings, we conducted supplementary analyses to provide preliminary evidence of model transferability within our single-center cohort. First, we split the holdout test set into two subsets by time period (year 2019 and years 2020 to 2021) because documentation styles may have evolved over time due to physician turnover or the arrival of new physicians. Second, we split the holdout test set by sex to assess consistency across diverse patient populations. Machine-learning model development workflow.
Supplemental Methods detail the implementation of model construction, including handling class imbalance, hyperparameter tuning, and cross-validation. In brief, to address class imbalance in medical datasets that biases ML models toward majority classes, 30 we tested random oversampling and undersampling techniques to balance minority and majority classes. We developed prediction models using four algorithms: artificial neural networks (ANN), logistic regression (LR), random forest (RF), and support vector machines (SVM). We performed 10-fold cross-validation three times on the training set to optimize hyperparameters (Supplemental Table S2), text vectorization, and class balancing methods. Model performance was evaluated using the area under the receiver operating characteristic curve (AUC).
We then created four ensemble models using the optimized ML models as base models. Ensemble learning improves performance over individual models by reducing variance or bias.31,32 Using predicted probabilities from the four base models, we calculated mean, median, maximum, and minimum values for each patient to create four ensemble models. We evaluated these models on the holdout test set, using an LR model trained solely on structured data as the baseline. Shapley additive explanation (SHAP) analysis 33 was used to interpret model outputs and identify important features.
Experiments were conducted on a system equipped with an NVIDIA GeForce RTX 3090 GPU, running Linux 6.8.0-60-generic-x86_64 with glibc 2.35, Python 3.10.12, and CUDA 12.1. Model training utilized imbalanced-learn 0.12.3, scikit-learn 1.5.2, torch 2.4.1, transformers 4.45.2, and shap 0.46.0.
Clinical model for comparison
The ABCD2 score evaluates stroke risk after transient ischemic attack. 5 It assigns points for age (1 for 60–69 years; 2 for ≥70), blood pressure (1 for systolic ≥140 mmHg or diastolic ≥90 mmHg), clinical features (2 for unilateral weakness; 1 for speech disturbance without weakness), symptom duration (1 for 10–59 minutes and 2 for ≥60 minutes), and diabetes (1 point). The score ranges from 0 to 7 and helps estimate the likelihood of a stroke within 2–7 days. Studies have demonstrated its ability to predict stroke risk in patients with dizziness.9,34
Statistical analysis
Patient characteristics were summarized using counts and percentages for categorical variables and means with standard deviations for continuous variables. Group differences were assessed using chi-squared tests (categorical) and t-tests (continuous).
For each model, we calculated sensitivity, specificity, positive predictive value (PPV), negative predictive value (NPV), and likelihood ratios (LR). Sensitivity measures the ability to correctly identify true stroke cases, while specificity measures the ability to correctly identify those who will not have a stroke. PPV and NPV indicate the probability that a “positive” or “negative” prediction by the model is correct in a real-world clinical setting. LRs indicate how much a test result will change the odds of having a stroke. A higher positive LR (LR+) and a lower negative LR (LR-) suggest a more clinically useful test.
The ABCD2 threshold was ≥4.9,34 Model discrimination was assessed using the AUC on the holdout test set. AUC is a global measure of how well the model distinguishes between stroke and non-stroke cases. An AUC of 1.0 is perfect, and an AUC of 0.5 is no better than a coin flip. An AUC value above 0.7 is considered clinically acceptable. 35
The ensemble model’s discrimination ability was compared to ABCD2 and other models using DeLong’s method. 36 Continuous net reclassification improvement (NRI) and integrated discrimination improvement (IDI) indices 37 were calculated, with higher values indicating better discrimination. Calibration was assessed via the Brier score, where lower scores signify better calibration. Finally, decision curve analysis was used to estimate net benefit for examining clinical utility, which reflects the improved decision-making capacity provided by each model. 38
All data preprocessing and statistical analyses were conducted using R version 4.3.1 (R Foundation for Statistical Computing, Vienna, Austria) and Stata 15.1 (StataCorp, College Station, Texas). Two-tailed p-values of 0.05 were considered statistically significant.
Results
Characteristics of the study population
Characteristics of the study population.

Data are given as n (%) and mean (standard deviation).
ALT, alanine aminotransferase; AST, aspartate aminotransferase; BT, body temperature; BUN, blood urea nitrogen; DBP, diastolic blood pressure; ED, emergency department; eGFR, estimated glomerular filtration rate; IHD, ischemic heart disease; MCH, mean corpuscular hemoglobin; MCHC, mean corpuscular hemoglobin concentration; MCV, mean corpuscular volume; MLR, monocyte-to-lymphocyte ratio; MPV, mean platelet volume; NLR, neutrophil-to-lymphocyte ratio; PLR, platelet-to-lymphocyte ratio; PR, pulse rate; PWR, platelet-to-white blood cell ratio; RBC, red blood cell; RDW-CV, red cell distribution width-coefficient of variation; RR, respiratory rate; SBP, systolic blood pressure; WBC, white blood cell.
Construction of prediction models
Supplemental Figure S2A shows the highest AUC values after hyperparameter optimization from three 10-fold cross-validations on the training set across various algorithm-feature combinations. Models using only structured data showed lower AUCs than those using unstructured clinical text. Models combining both data types achieved higher AUCs across all algorithms. The baseline model (structured data only) reached an AUC of 0.803. The highest AUCs for ANN, LR, RF, and SVM models were 0.857, 0.852, 0.872, and 0.879, respectively. Their specific resampling methods, feature sets, and hyperparameters appear in Supplemental Table S3. Among ensemble models, the one averaging predictions from all four models achieved the highest training set AUC (Supplemental Figure S2B).
Comparison of prediction performance
Comparative performance of machine learning models and the ABCD2 score for stroke prediction. This table evaluates model performance on a holdout test set. Values represent the primary estimate followed by the 95% CI in parentheses.

Data are reported as percentages with (95% CI), except AUC and LRs.
AUC, area under the receiver operating characteristic curve; ANN, artificial neural network; CI, confidence interval; LR, logistic regression; LR+, positive likelihood ratio; LR-, negative likelihood ratio; NPV, negative predictive value; PPV, positive predictive value; RF, random forest; SVM, support vector machine.
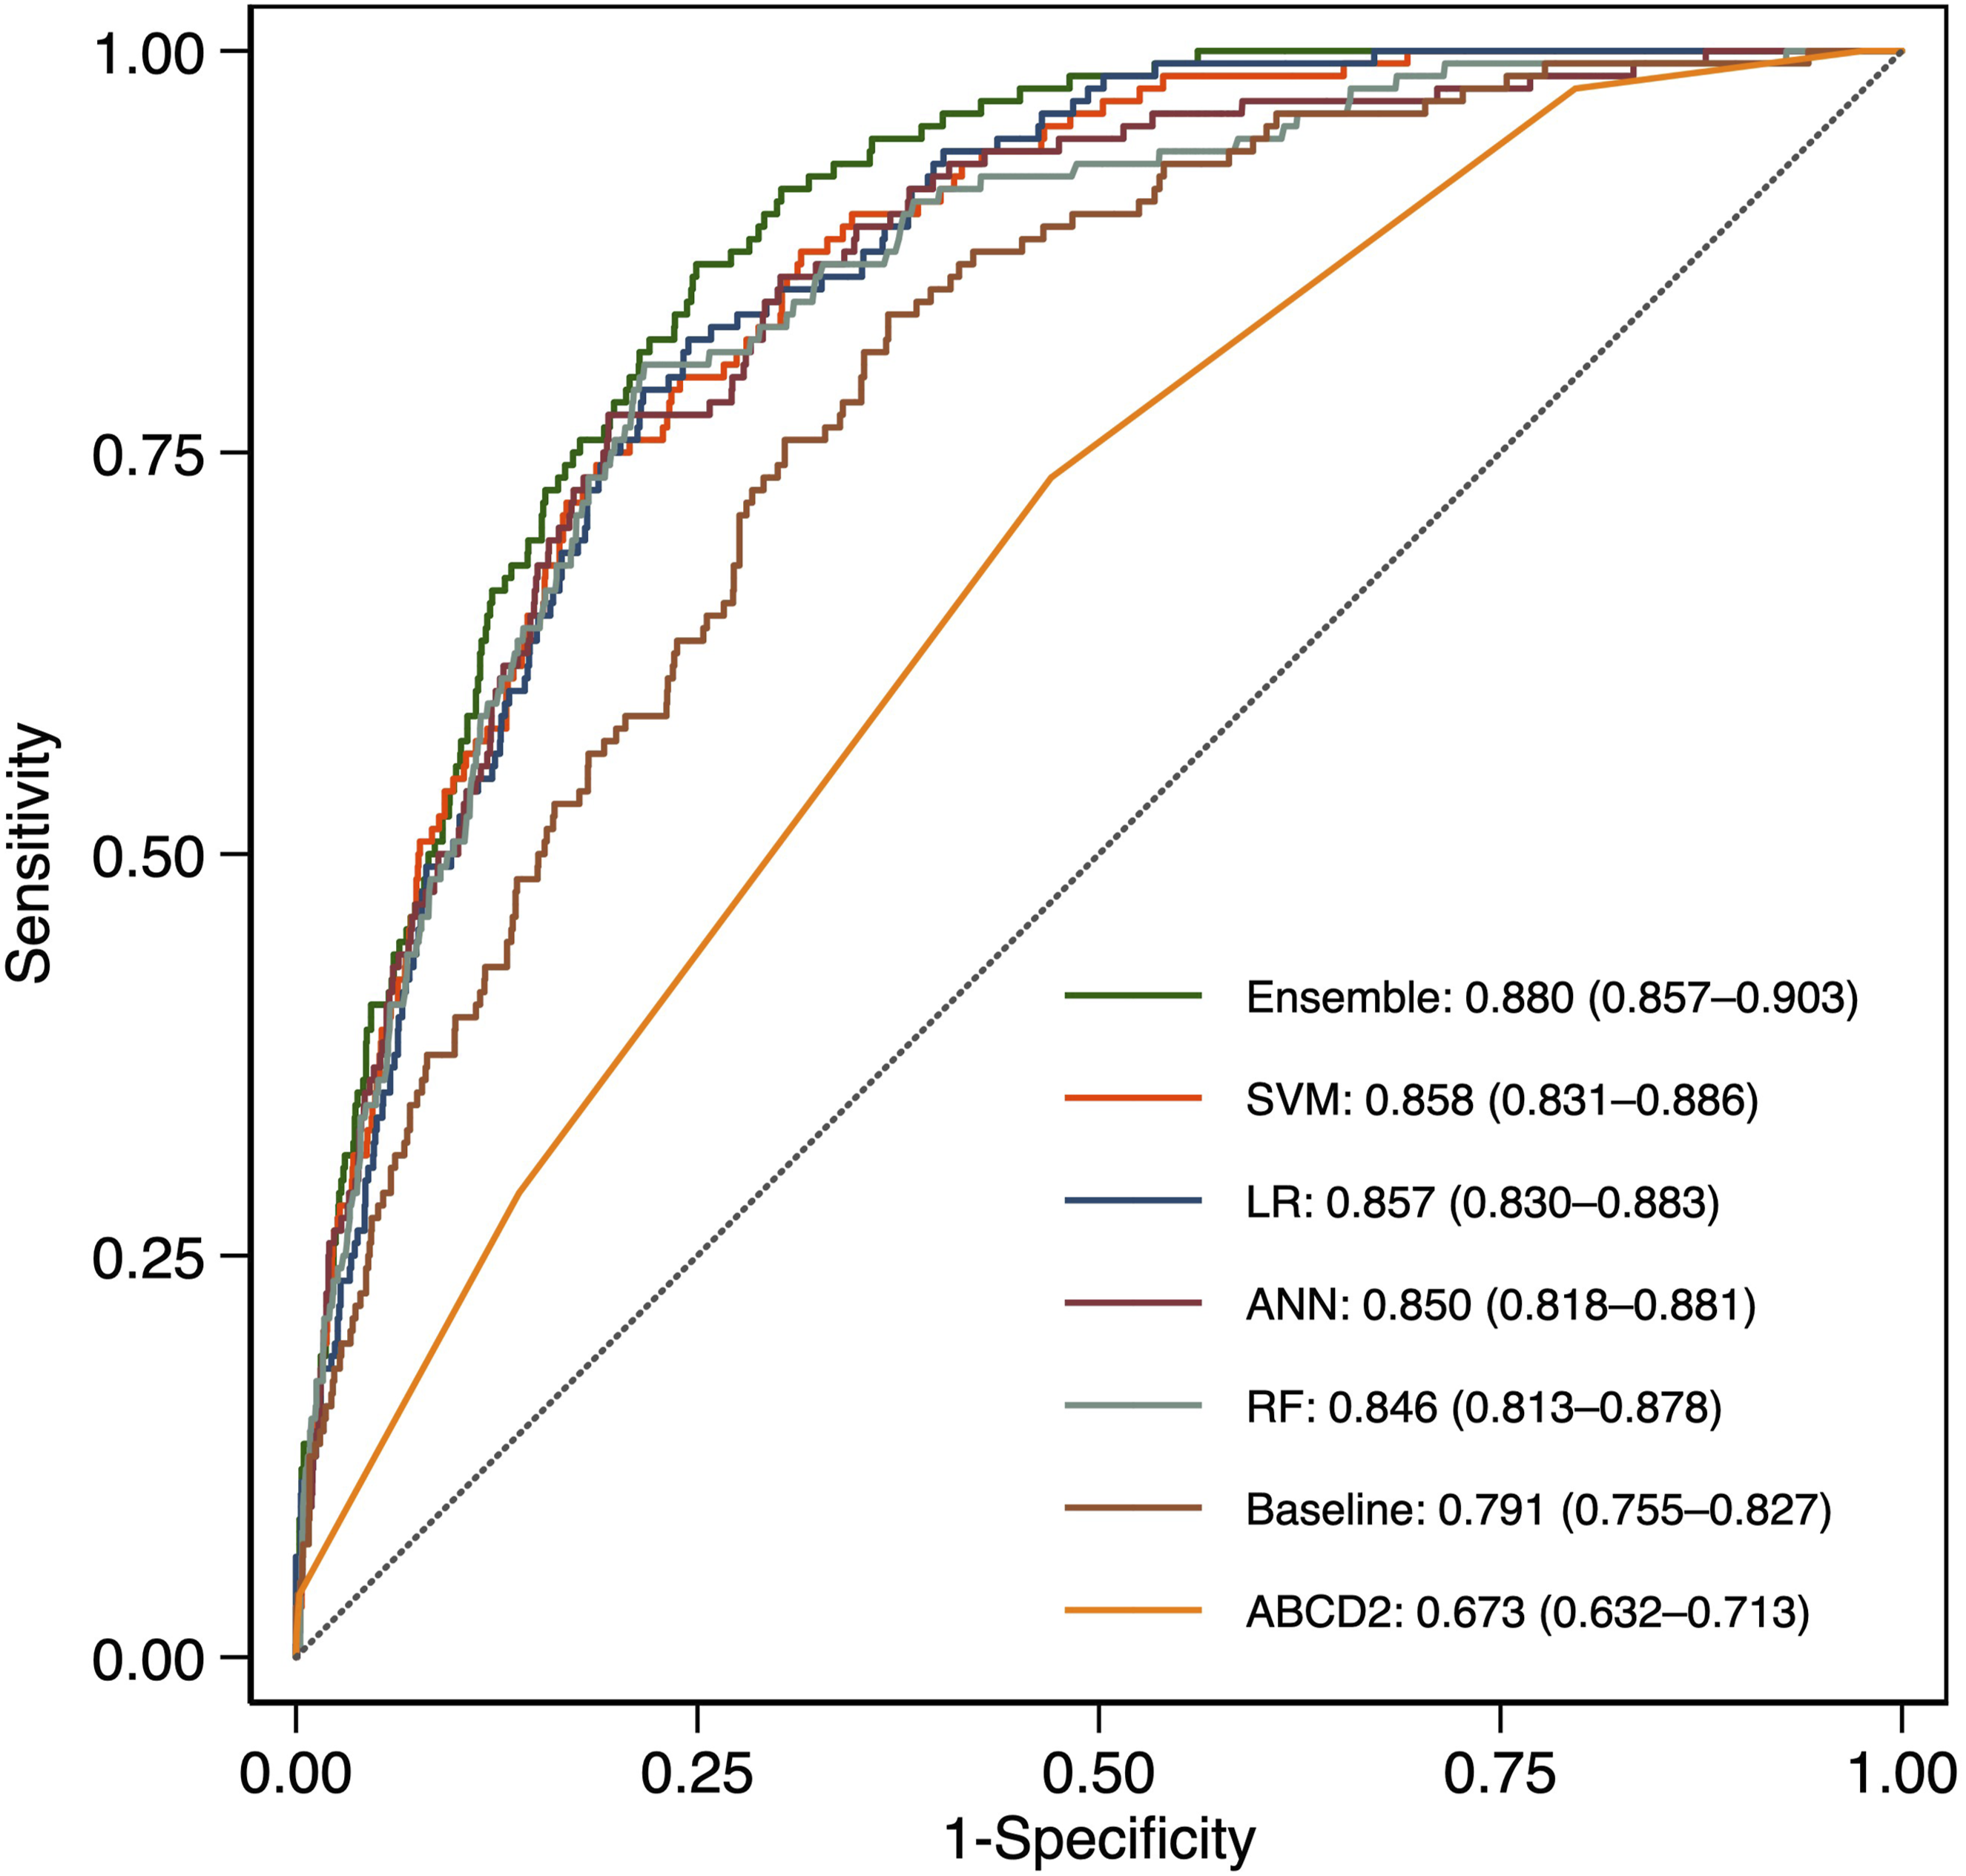
ROC curves comparing model performance.
All models showed high NPVs, with ABCD2 having the lowest PPV (8.1%) and LR+ (1.56). Among ML models, ANN achieved the highest PPV (24.0%) and LR+ (5.58), but the lowest sensitivity (50.0%). The ensemble model ranked second in PPV (20.8%) and LR+ (4.64), with comparable sensitivity (72.7%). Figure 3 shows net benefit curves across risk thresholds, with the ensemble model demonstrating superior clinical utility. Decision curve analysis comparing clinical net benefit across prediction models.
Supplemental Tables S5 to S8 present the results of supplementary analyses that used different holdout test sets to assess consistency across varying time periods and patient populations. These results were consistent with the main analysis. The ABCD2 score had the lowest AUCs, ranging from 0.644 to 0.704, whereas the ensemble achieved the highest AUCs, ranging from 0.854 to 0.901. Similarly, the ABCD2 score had the lowest PPV and LR+ values among all the models, while the ensemble model ranked second in terms of PPV and LR+.
Feature importance
We used SHAP analysis to identify key features for stroke prediction in patients with acute dizziness. Figure 4 shows the top 20 features from the baseline model (structural data), while Figure 4 shows the top 20 from the RF model (combined structural and unstructured data). Important predictors included age, male gender, risk factors (hyperlipidemia, hypertension), vital signs (systolic blood pressure, temperature, etc.), laboratory values (creatinine, hematocrit, etc.), and inflammatory markers (monocyte-to-lymphocyte and platelet-to-white blood cell ratios). Words like “left,” “tomography,” and “brain” in ED physician notes were also significant contributors. Bee swarm plots illustrating the relative impact of clinical, demographic, and textual features on the predictive output of the baseline (a) and random forest (b) models on the holdout test set.
Discussion
We developed a stroke risk assessment tool for ED patients with acute dizziness using an ensemble of four ML models. This ensemble outperformed both the ABCD2 score and individual ML models in discrimination, calibration, and clinical utility. Our study found that incorporating unstructured clinical text features significantly improved prediction performance compared to the baseline model, which used structured data alone.
Comparison of models
We evaluated various ML algorithms and feature sets to develop our clinical decision tool. All models exceeded the acceptable AUC threshold of 0.7. 35 The ensemble approach integrated predictions from base models, enhancing discriminatory ability. Ensemble learning enhances accuracy, robustness, and efficiency in the presence of complex or noisy data,39,40 making it a popular choice in healthcare analytics.
Prior studies have investigated ML models for stroke prediction in dizzy ED patients,41–44 using various algorithms and features. Most relied on video-oculography,41–43 requiring specialized equipment. One study, like ours, utilized EMR clinical data and provider notes, 44 but created separate models for structured and unstructured data without integration, and did not explore advanced NLP technologies, such as large language models.
Utility of clinical text
Clinical text analysis enhances ML models for predicting patient outcomes and diagnosing diseases by leveraging rich, unstructured data from clinical narratives. 45 Research shows that combining free-text notes with structured EMR data enhances stroke prediction accuracy.46–48 This integration provides a deeper understanding of patient histories and symptoms, thereby improving the performance of stroke prediction models. 49
For ML algorithms to process clinical text effectively, textual data must be converted to numerical vectors. Various NLP techniques can vectorize text, from simple word-count methods like BOW to sophisticated BERT embeddings. The optimal vectorization method varies by algorithm and classification task.50,51 Our study demonstrates that the optimal vectorization approach varies depending on the specific ML algorithm employed, underscoring the importance of selecting the proper technique to maximize model performance.
Influential features
Beyond traditional risk factors like age, hyperlipidemia, and hypertension, other influential features included systolic blood pressure, hemoglobin, creatinine, and blood cell counts, confirming findings from a previous study. 44 We also identified inflammatory markers (monocyte-to-lymphocyte and platelet-to-white blood cell ratios) among the top features. While these markers correlate with stroke severity and prognosis,52,53 their reliability as biomarkers for differentiating acute ischemic stroke requires further research.
While ED physician notes improved model performance, black-box BERT models reduce interpretability. 54 Despite this, we incorporated several approaches to enhance the interpretability of the prediction model. We used BOW vectorization, which, through SHAP analyses, provides transparent insights into which clinical variables and textual features drive model decisions and offers more interpretable textual features than BERT embeddings alone. Although this approach identified influential words, their interpretation remains challenging and often requires domain experts to evaluate contextual meaning. Nevertheless, expert-verified textual features could help refine prediction models.
Clinical implications
A critical finding in our study is that approximately 4.2% (595/14,280) of patients initially discharged from the ED without stroke identification received delayed stroke diagnoses within seven days. This rate aligns with published literature reporting that 3–5% of acutely dizzy patients in the ED have cerebrovascular disease. 1 Although this proportion is modest, it represents a significant patient safety concern,55,56 as delayed diagnosis is associated with increased morbidity, missed opportunities for time-sensitive interventions such as thrombolysis and thrombectomy, and failure to initiate secondary prevention, resulting in higher rates of recurrent stroke. Several factors contribute to this diagnostic challenge 56 : posterior circulation strokes often present with isolated dizziness and no obvious focal deficits 2 ; computed tomography scans have poor sensitivity for acute posterior fossa strokes 4 ; and cognitive biases may lead to premature closure on benign diagnoses, such as benign paroxysmal positional vertigo.
Our ensemble prediction tool addresses these challenges by systematically integrating vascular risk factors, vital signs, laboratory results, and analysis of free-text physician notes to capture subtle stroke indicators that may be overlooked during time-pressured evaluations. Our tool was trained on ED patients with acute dizziness, not just those with acute vestibular syndrome. It achieves a discrimination ability (AUC 0.880) comparable to existing tools, such as HINTS and TriAGe+ (both with an AUC of 0.88). 11
A sensitive clinical decision support tool could flag high-risk patients who might otherwise be discharged, prompting additional evaluation. Clinical implementation should integrate the tool into ED workflows to provide real-time risk stratification and actionable recommendations, while allowing physician overrides with documented reasoning. However, it is important to recognize that not all delayed diagnoses are preventable. Furthermore, model sensitivity must be balanced against specificity to avoid excessive false positives. Our tool’s threshold is adjustable to optimize sensitivity and PPV. Test-positive cases can undergo expedited MRI57,58 for stroke screening, enabling timely treatment and mitigating patient safety issues.
Strengths and limitations
This study’s main strengths include effectively managing missing data and class imbalance, common issues in medical datasets that impact model reliability. Systematic missing data can render models less representative of the population, introducing bias and limiting their generalizability. 59 Missing data also reduces statistical power, affecting reproducibility. Similarly, training data biased toward one class can skew model predictions, 30 reducing accuracy for underrepresented classes and limiting generalization to new datasets. 60
This study has several limitations. First, although various holdout sets were used to verify model transferability, this study was conducted on a single-site dataset, which limits the generalizability of its findings. It should be considered an initial proof-of-concept for integrating structured EMR data with unstructured clinical text using advanced NLP and ML techniques to predict stroke risk in dizzy patients in the ED. Prospective multicenter validation studies are necessary to confirm the model’s generalizability across diverse healthcare settings before widespread clinical implementation. Second, there was some outcome assessment bias, as patients hospitalized for stroke outside the study hospital could not be identified. This could lead to an underestimation of stroke risk. Third, we did not compare the developed models to physiology-based approaches, such as the HINTS exam, because no such data were available. Fourth, differences in terminology and style in clinical documentation across healthcare organizations may affect the transferability of the developed models.
Fifth, using the BERT language model limits interpretability. Future research may explore attention mechanisms to identify which portions of clinical text most influence BERT-based predictions. Moreover, clinical validation studies in which physicians review model predictions alongside feature importance explanations to assess clinical face validity are important. Finally, our tool has not been tested in real-world clinical settings. Prospective validation is needed to confirm that implementation reduces delayed diagnosis rates in clinical practice. With appropriate implementation and ongoing validation, such tools have the potential to reduce diagnostic errors, improve patient outcomes, and optimize resource utilization in emergency care settings.
Conclusions
We developed an ensemble prediction model using NLP and ML techniques to assess stroke risk in dizzy ED patients. The model could be integrated into the hospital information system to provide personalized and efficient risk assessment. By targeting advanced neuroimaging at high-risk patients while avoiding unnecessary tests for low-risk ones, this tool could enhance patient safety, reduce errors, and optimize resource allocation.
Supplemental material
Supplemental material - Developing a clinical decision support tool for stratifying stroke risk in patients presenting with dizziness to the emergency department: A retrospective cohort study
Supplemental material for Developing a clinical decision support tool for stratifying stroke risk in patients presenting with dizziness to the emergency department: A retrospective cohort study by Sheng-Feng Sung and Ya-Han Hu in Digital Health.
Footnotes
Acknowledgments
The authors thank the Clinical Data Center of Ditmanson Medical Foundation Chia-Yi Christian Hospital for providing administrative and technical support. This study is based on data from the Ditmanson Research Database (DRD), provided by Ditmanson Medical Foundation Chia-Yi Christian Hospital. The interpretation and conclusions contained herein do not represent the position of Ditmanson Medical Foundation Chia-Yi Christian Hospital.
Ethical considerations
The study protocol was approved by the Institutional Review Board of Ditmanson Medical Foundation Chia-Yi Christian Hospital, which waived the requirement for informed consent for this study (approval number: IRB2022111).
Consent to participate
The need for informed consent was waived for this study due to its retrospective design.
Author contributions
SFS conceived the study, performed statistical modeling, and drafted the manuscript. YHH supervised the study and critically revised the manuscript. All authors participated in manuscript revision and approved the final version.
Funding
The authors disclosed receipt of the following financial support for the research, authorship, and/or publication of this article: This work was supported by the National Science and Technology Council [grant number NSTC 112-2221-E-705-001-MY2]. The research funder had no role in the design, conduct, or interpretation of the study, nor in the decision to submit it for publication.
Declaration of conflicting interests
The authors declared no potential conflicts of interest with respect to the research, authorship, and/or publication of this article.
Data Availability Statement
The authors do not have permission to share the data due to local regulations governing the use of electronic medical records.
Guarantor
YHH.
Supplemental material
Supplemental material for this article is available online.