
Abstract
Objectives
To establish a robust and clinically applicable approach for integrating heterogeneous multisource biomedical data, particularly continuous glucose monitoring (CGM) profiles and structured electronic health records (EHRs), in order to enhance the diagnostic accuracy and clinical utility of diabetic retinopathy (DR) detection.
Methods
This study proposed a deep hierarchical attention network (DHAN) for multisource biomedical data fusion. First, to address the heterogeneous forms of different data sources, two specific subencoders were designed, a hybrid architecture for time-series CGM sensors and a structured encoder for EHRs. Second, an entity-embedding mechanism was added to the EHR subencoder to fuse heterogeneous feature types within EHRs. Finally, a deep hierarchical attention mechanism was proposed to dynamically capture inner-source saliency and inter-source correlations.
Results
Using the dataset provided by Shanghai Sixth People's Hospital, 559 patients were included, comprising 157 with DR and 402 without. DHAN achieved the best performance across multiple experiments, with a diagnostic accuracy of 0.89. Its comprehensive performance, including an F1-score of 0.80 and a G-mean of 0.89, further demonstrates its robustness.
Conclusions
The results indicate that DHAN is a viable approach for diagnosing DR in patients with type 2 diabetes. By effectively fusing multisource heterogeneous data, DHAN can be embedded within CGM sensors to enable remote concurrent diagnosis of DR. Moreover, it provides a generalizable paradigm for multisensor systems requiring fusion of data from multiple sources.
Keywords
Introduction
Diabetic retinopathy (DR) is one of the severe complications in type 2 diabetes (T2D) and a leading cause of preventable blindness on a global scale.1,2 According to the International Diabetes Federation, approximately one-third of patients with diabetes develop some form of DR. The early stages of the disease may not present noticeable symptoms, making regular eye examinations critical for early detection and treatment. 3 Existing screening methods primarily rely on retinal fundus photography by ophthalmologists or automated image-based algorithms. Although these methods are highly effective, they require dedicated imaging hardware and trained graders, which limits their use in primary care settings. 4 These limitations highlight the urgent need for automated, accurate, and scalable diagnostic solutions, motivating the growing adoption of artificial intelligence (AI)-based approaches for DR diagnosis.
In recent years, remarkable progress has been achieved in automated DR screening and grading driven by deep learning. Khan et al. 5 investigated a deep learning architecture for DR diagnosis using VGG Network in Network architecture, which enhanced the overall training speed in real time. Ai et al. 6 developed an ensemble model combining of InceptionV3, Xception, and ResNeXt101, which outperformed single networks. Similarly, Yasashvini et al. 7 examined hybrid convolutional neural networks (CNNs) with ResNet and DenseNet to grade DR risk in patients using optical coherence tomography fundus images. Mukherjce and Sengupta 8 introduced a hybrid CNN framework capable of extracting discriminative features from retinal fundus images. To capture higher-order vascular structures, Sundar and Sumathy 9 proposed graph neural networks with variational autoencoders, achieving better robustness than traditional CNNs. Novel hybrid architectures, such as hierarchical feature fusion CNN 10 enabled hierarchical and multiscale feature fusion, enhancing screening accuracy to 98.7%. In addition, a faster R-CNN was used to perform the lesion-level localization, demonstrating strong cross-dataset generalization. 11 Beyond algorithmic advances, studies have shown that integrating telemedicine into routine eye care can mitigate challenges, such as patient accessibility, and improve screening rates for populations at risk. 12 AI-based systems were also expected to reduce the burden on healthcare professionals by enabling remote screenings and minimizing the need for face-to-face consultations, as highlighted in the systematic review by Far et al. 13 Such improvements are particularly critical in underresourced regions with limited access to specialized eye care. Nevertheless, fundus-image-based methods often struggle to detect fine-early lesions, such as microaneurysms, leading to high false-negative rates at the preproliferative stage of DR.
Recently, telemedicine in diabetes management has expanded through the use of nonimaging biomedical data, such as continuous glucose monitoring (CGM) sensors and electronic health records (EHRs). An extensive review by Vyas et al. 14 demonstrated the ability of machine learning in utilizing EHR data to determine the most appropriate treatment pattern for inpatient care in T2D. Young et al. 15 established a machine learning model based on EHR data from more than 80 million patients to identify at-risk individuals to and facilitate referrals for eye care. These findings indicated the potential of machine learning to revolutionize early detection and treatment planning. Jin 16 discussed the role of AI in facilitating anticipatory care, which enabled healthcare professionals to provide tailored nutritional and activity recommendations based on the CGM data. Sadagopan et al. 17 emphasized the significant potential of biosensors in CGM systems, demonstrating innovations capable of redefining chronic disease management. The integration of AI and ongoing surveillance technologies was the groundwork for the further development the personal healthcare intervention. Li et al. 18 asserted that CGM and predictive models can enhance the clinical outcomes, assisting in controlling glucose levels and expanding access to diabetes care for underserved populations. CGM and EHR data also showed high potential for DR risk stratification. Sun and Zhang 19 proposed a five-module ensemble technique to diagnose and analyze the DR based on EHR data, demonstrating the feasibility of using EHR measurement data for diabetic complications and treatment planning. Wang et al. 20 found that the area under the curve (AUC) metric derived from CGM sensors was an independent and significant factor in DR classification. Although the efficacy of AI models might be improved by incorporating multisource data, most studies have relied on single-source measurements, thus limiting their capability to provide broad, multiperspectives insights and resulting in performance shortcomings.
Recent advances in multisource measurements have shown the value of fusing heterogeneous data.21–24 In industrial condition monitoring, multiple vibration sensors signals were fused via cross-correlation functions to predict equipment failure, outperforming single-sensor methods. 24 Similarly, Choi and Hummel 25 integrated multisource air quality sensor arrays via a probabilistic spatiotemporal model, reducing prediction errors by 40% and 11% in two environmental monitoring applications. Traditional methodologies for multisource data fusion have been introduced, including Bayesian method, 26 Dempster–Shafer theory,27,28 fuzzy logic, 29 and voting mechanisms. 30 However, these methods struggled with high-dimensional biomedical measurement data owing to their computational complexity. Furthermore, machine learning and deep learning techniques have emerged as powerful alternatives.31,32 Translating these principles into biomedical measurements, CGM sensors and EHR data could enable DR diagnosis in situations were limited to specialized imaging devices are limited.
This study aims to address two fundamental challenges in multisource biomedical data fusion for DR diagnosis. First, CGM sensors generate high-dimensional time-series data, 33 whereas EHR measurements provide structured, semantically rich tabular data with mixed feature types. 34 Consequently, designing a network architecture for capturing both inner-source heterogeneity and inter-source format differences presents a considerable challenge. Second, it is crucial to determine the relative importance of inner- or inter-source features for ensuing stability and adaptability of the multisource data fusion. To address these challenges, we propose a deep hierarchical attention network (DHAN) to learn and integrate information from both CGM sensors and EHR measurements for DR diagnoses in T2D patients, as shown in Figure 1.

The general framework of the proposed multisource hierarchical attention network. It includes source encoders (EHR subencoder, CGM subencoder), a hierarchical attention module, and a classifier network module. EHR: electronic health record; CGM: continuous glucose monitoring.
The primary contributions of this study are summarized as follows:
Clinical validation of multisource fusion: We verify the clinical feasibility of combining CGM time-series and EHR structured data for DR diagnosis. The study provides a practical framework for precision healthcare and remote management of diabetes complications. To the best of our knowledge, this work represents the attempt to integrate multisource heterogeneous data from CGM and EHR for remote intelligent DR diagnosis, thereby avoiding the drawbacks associated with frequent follow-up fundus examinations. Dual-branch subencoder: We develop a novel dual-branch subencoder network to handle the CGM time-series data and EHR tabular data. The CGM branch leverages a hybrid CNN–long short-term memory (LSTM) structure to capture fine-grained temporal patterns of blood glucose fluctuations, and the EHR branch has an entity-embedding module to handle categorical and continuous variables separately and independently, eliminating the constraints of traditional homogeneous features. Hierarchical attention network for multisource data fusion: To enhance multisource integration, a hierarchical attention network combined with inner-source attention and inter-source attention is proposed for uncovering the latent biomedical correlations and improving the robustness and efficient of fusion process. Experimentation on real clinical data: We also perform extensive experiments on a real-world clinical dataset from Shanghai Sixth Hospital, demonstrating that our model always outperforms state-of-the-art machine learning and deep learning baselines. Furthermore, ablation studies are conducted to assess the contribution of each component, including the entity-embedding and hierarchical attention modules.
Method
Problem formulation
Patients with T2D undergo various medical tests and wear CGM sensors in clinical scenarios. EHR measurement data were static values that record the results of a patient's multiple medical measurements. We denoted this set as X:


EHR subencoder
EHR data often provided insights into the distinctive features of patients with T2D, whether the patient has DR. However, EHR data typically contained mixed-type features.32,33 In this study, to maximize portability of wearable sensors, we used several simple and easy-to-access features, as listed in Table 1.
The detail of the EHR measurement data in T2D patients.
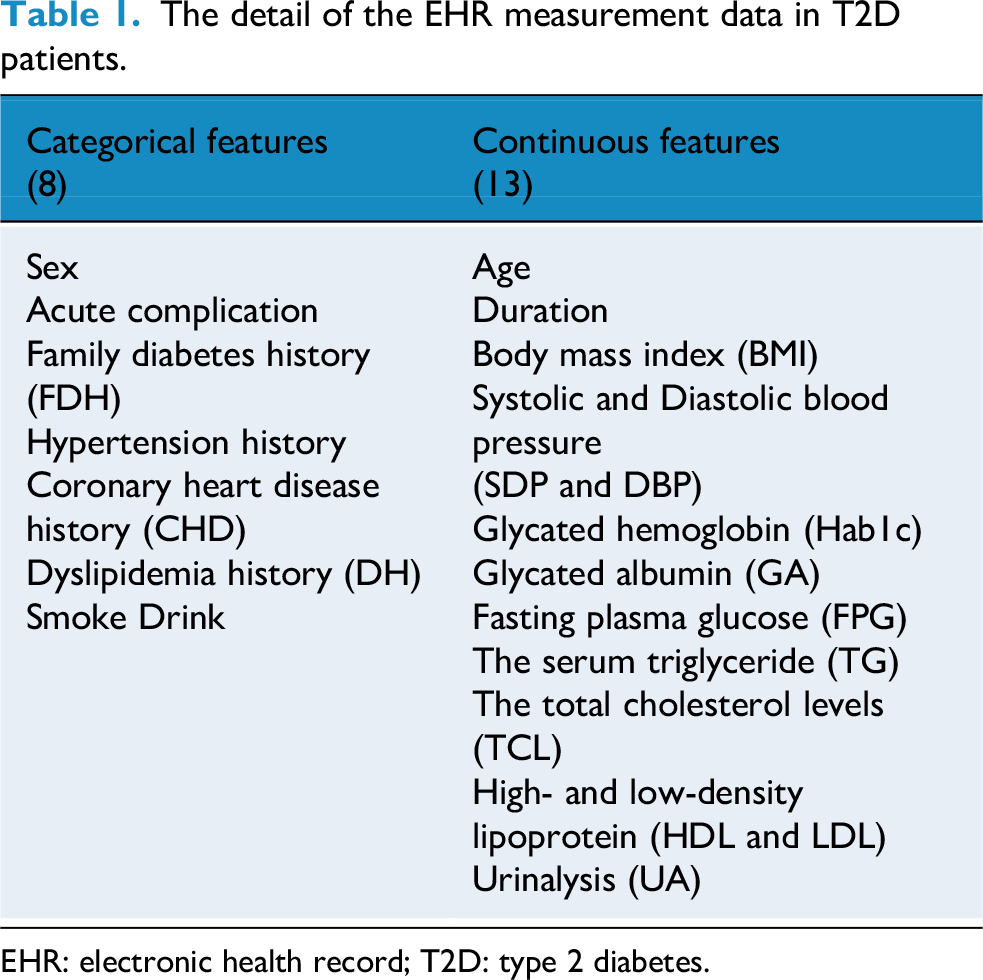
EHR: electronic health record; T2D: type 2 diabetes.
To enable the network to learn from mixed-type features in EHR data, we employed entity embedding to convert categorical features into numerical form. Given the target-valued representation of a categorical variable 
The dimension d of the embedding could be chosen arbitrarily. Here, we set d = [D/2], where D is the cardinality of vocabulary
To perform entity embedding, the integer value 

CGM subencoder
As CGM sensor data inherently contained time-series information, the inclusion of LSTM networks with memory cells allowed preservation of temporal context during processing. 36 Consequently, a dedicated subencoder was formulated by integrating LSTM and CNN layers to extract pertinent features from CGM sensor data. The objective was to harness the potential of CGM sensor data in reflecting the intricacies of diabetic complications. Instead of directly feeding G into the subencoder for training, a preliminary preprocessing step was applied to transform the original G into real inputs.
Analysis of real hospital data revealed that the majority of patients wore the CGM sensors for more than 5 days. Sequences of this length exhibit sufficient complexity to maintain discernible features, without posing undue challenges for neural networks. Accordingly, we retained sequences of 5 days (comprising 1440 data points) and discarded the remainder. Additionally, CGM sensors often caused some fragmentation of the missing data. For less than 15 min (three points), spline interpolation was used to complete the sequence.
37
For gaps longer than 15 min, the sample was discarded. Because both the mean and fluctuations of glucose data were equally reflective of diabetic complications, we did not normalize or de-trend them before feeding them into the subencoder. After these preprocessing steps, G′ as the input of the CGM subencoder, was an array with a size of 288
To extract latent features from CGM, a subencoder was constructed using CNN and LSTM layers. The raw features 
Hierarchical attention mechanism for heterogeneous source data
This section aimed to combine all the CGM sensor and EHR measurement features extracted by the CGM and EHR subencoders for final diagnosis. Although both features from different sources were related to the DR diagnosis, their relative importance may vary. As a result, a hierarchical attention mechanism was constructed to leverage all valuable information from these diverse sources. As shown in Figure 2, the structural diagram of the hierarchical attention mechanism consisted of two components: inner-source attention and inter-source attention.
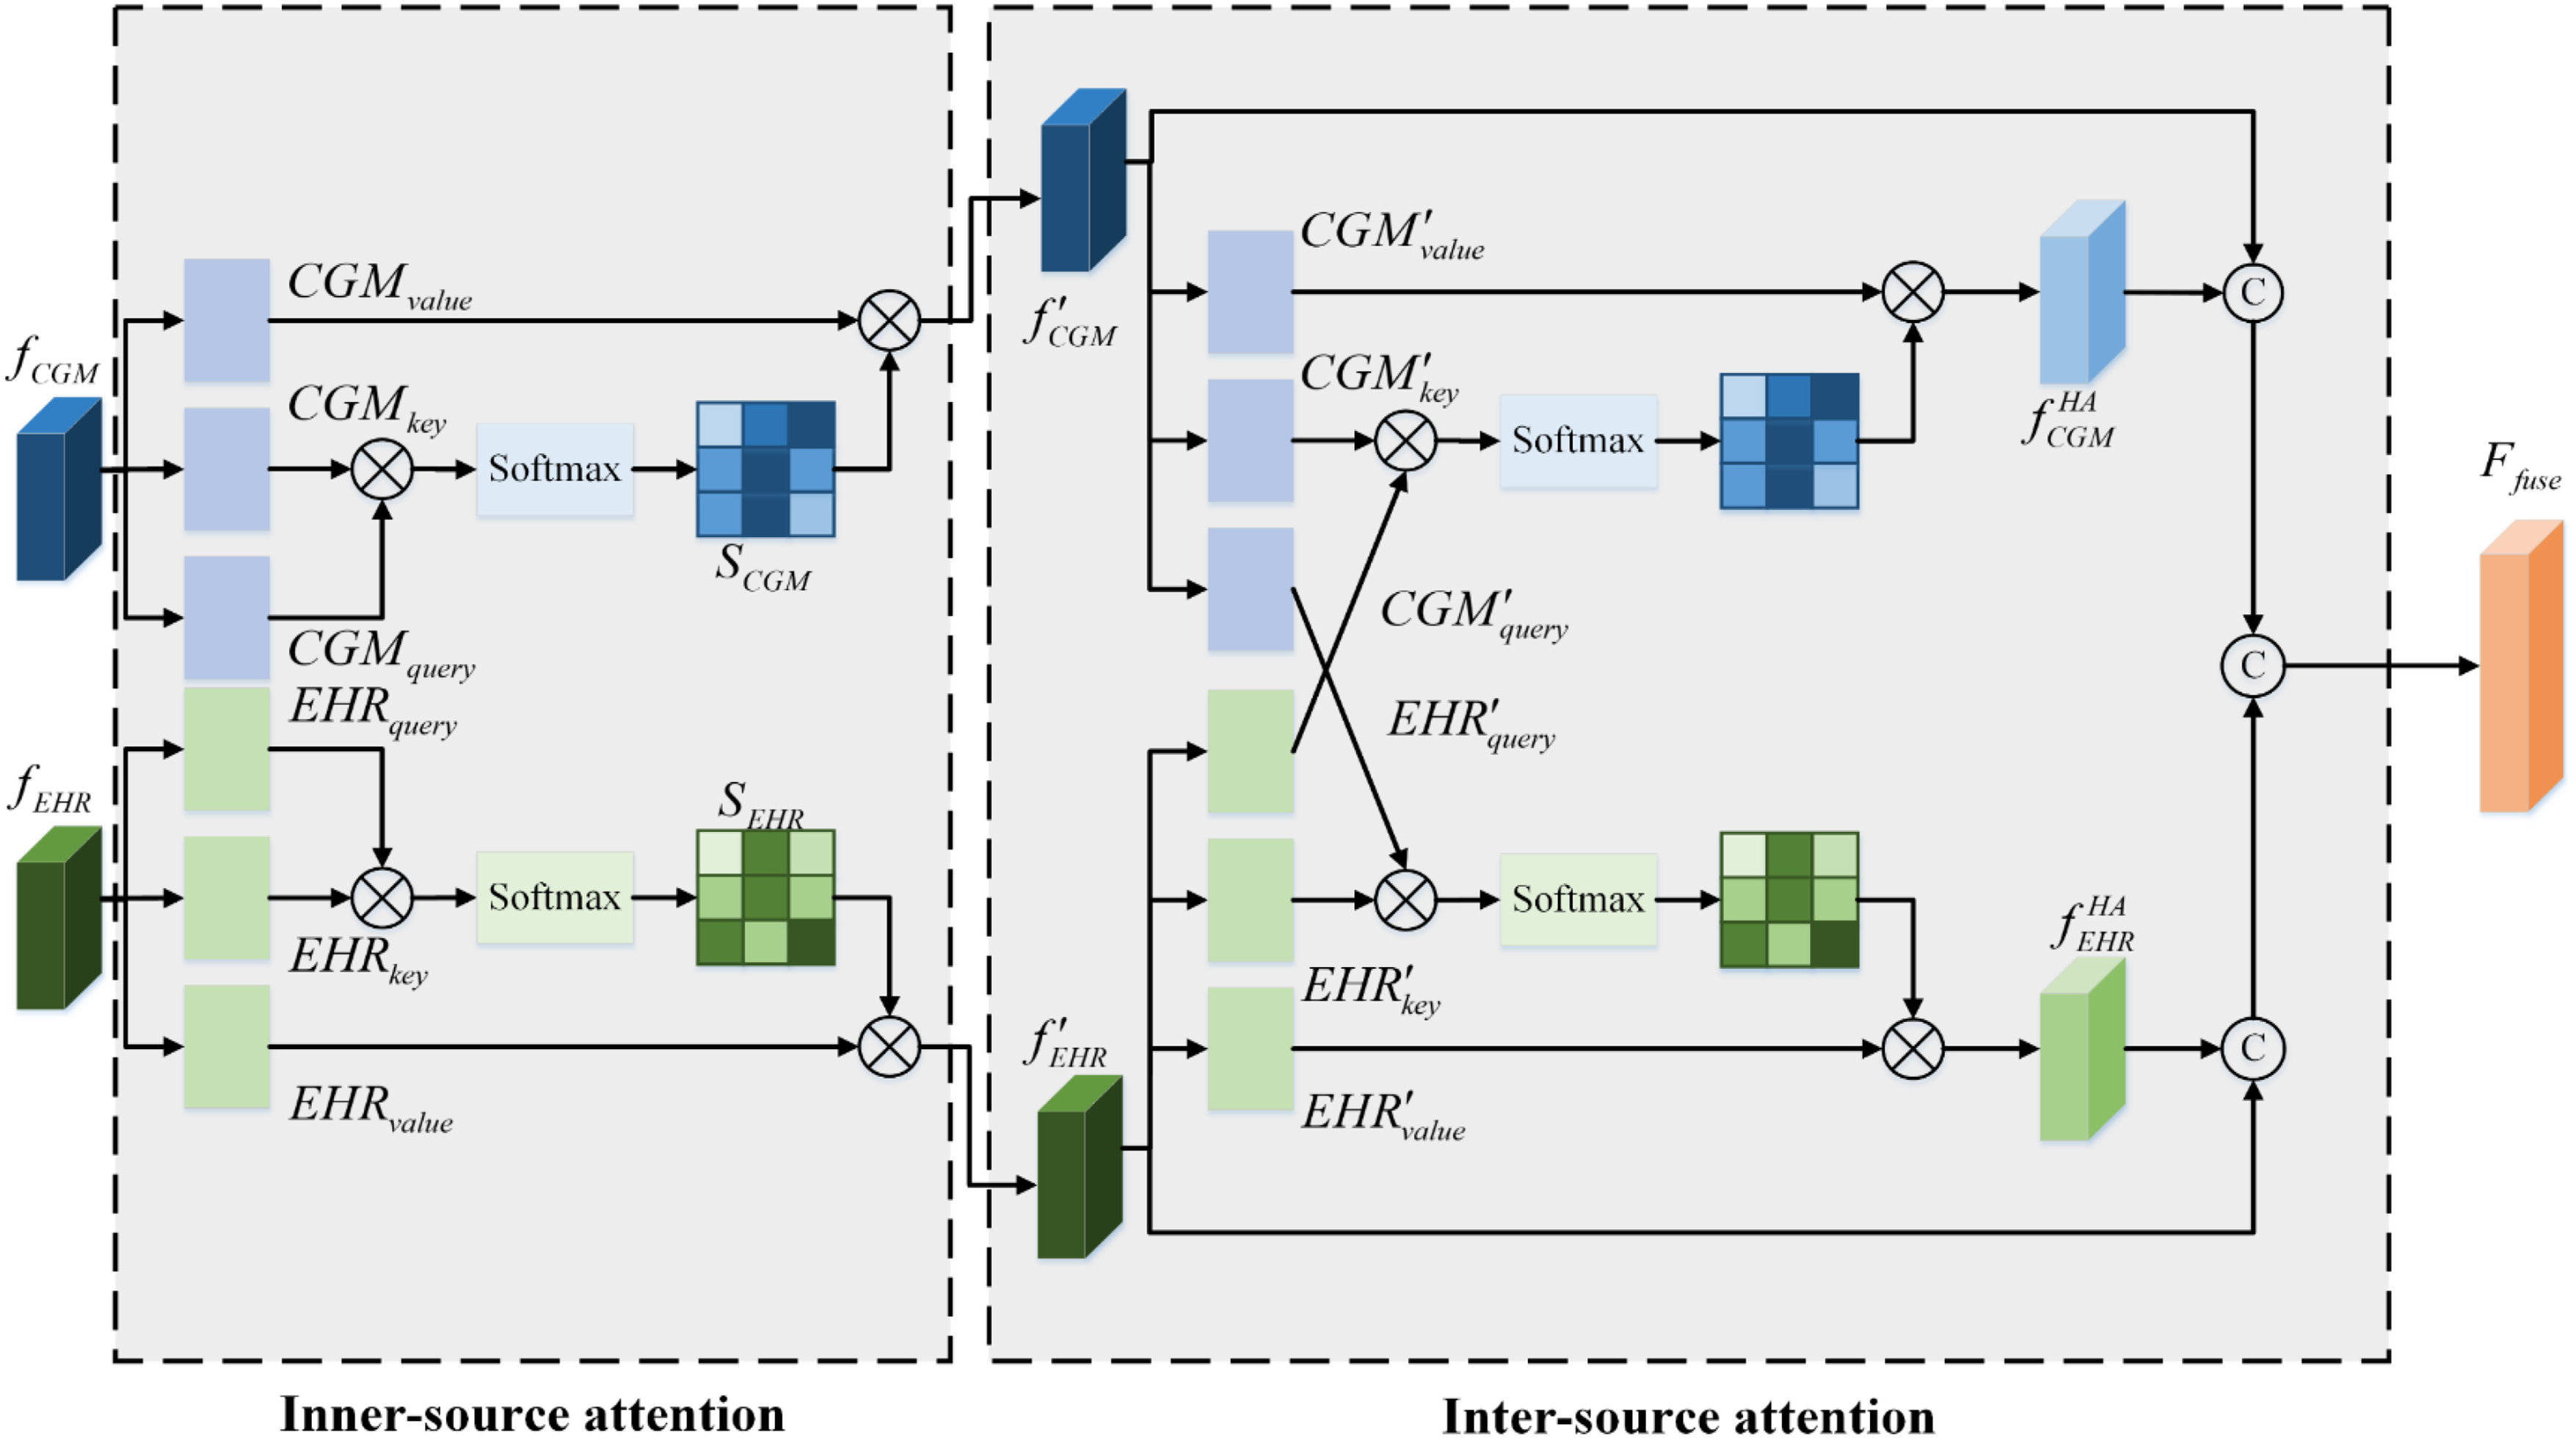
Overall framework of the hierarchical attention module. It includes the inner-source attention and the inter-source attention. The
Inner-source attention
The inner-source attention was designed to propagate and aggregate information within each source.38–40 This made the features extracted more focused, and the generated results gained a degree of interpretability. The details of the inner-source attention are introduced below.
The feature f is given by the CGM subencoder and the EHR subencoder. Based on 

By multiplying 
Inter-source attention
After that, each source feature map was fed into the inter-source attention module. The feature extraction processes of the two sources, when limited to inner-source attention, remain independent and lack cooperation, resulting in restricted representation capability. Inter-source attention was therefore introduced to reinforce relationships between these sources and integrate different source information across them.41,42 The outputs of inner-source attention served as the inputs to the inter-source attention, as shown in Figure 2. The module was designed with two symmetrical branches. This structure not only preserved valuable source-specific information but also enhanced the relevance and interactivity of multisources.
Taking the CGM branch as an example, a cross-attention network was used for feature fusion between the CGM and EHR. This enabled the model to jointly process subfeature information from different source domains.
43
Unlike inner-source attention, CGM attention features were converted into key and value vectors. In addition, EHR attention features were converted into query vectors. The calculation processes were as follows:


Target diagnosis network and optimization
The output CGM and EHR features contained a lot of information about the attention weights for different sources after the hierarchical attention mechanism. To avoid model degradation and provide more interactive information while preserving the original source information, the inner-source attention features were combined. A shallow neural network was then employed for diagnosis. Specifically, the diagnosing task was formulated as a binary classification problem, meaning that the DR complications in T2D were divided into two categories: {with DR, without DR}. The diagnostic network consisted of two fully connected layers and one dense layer.
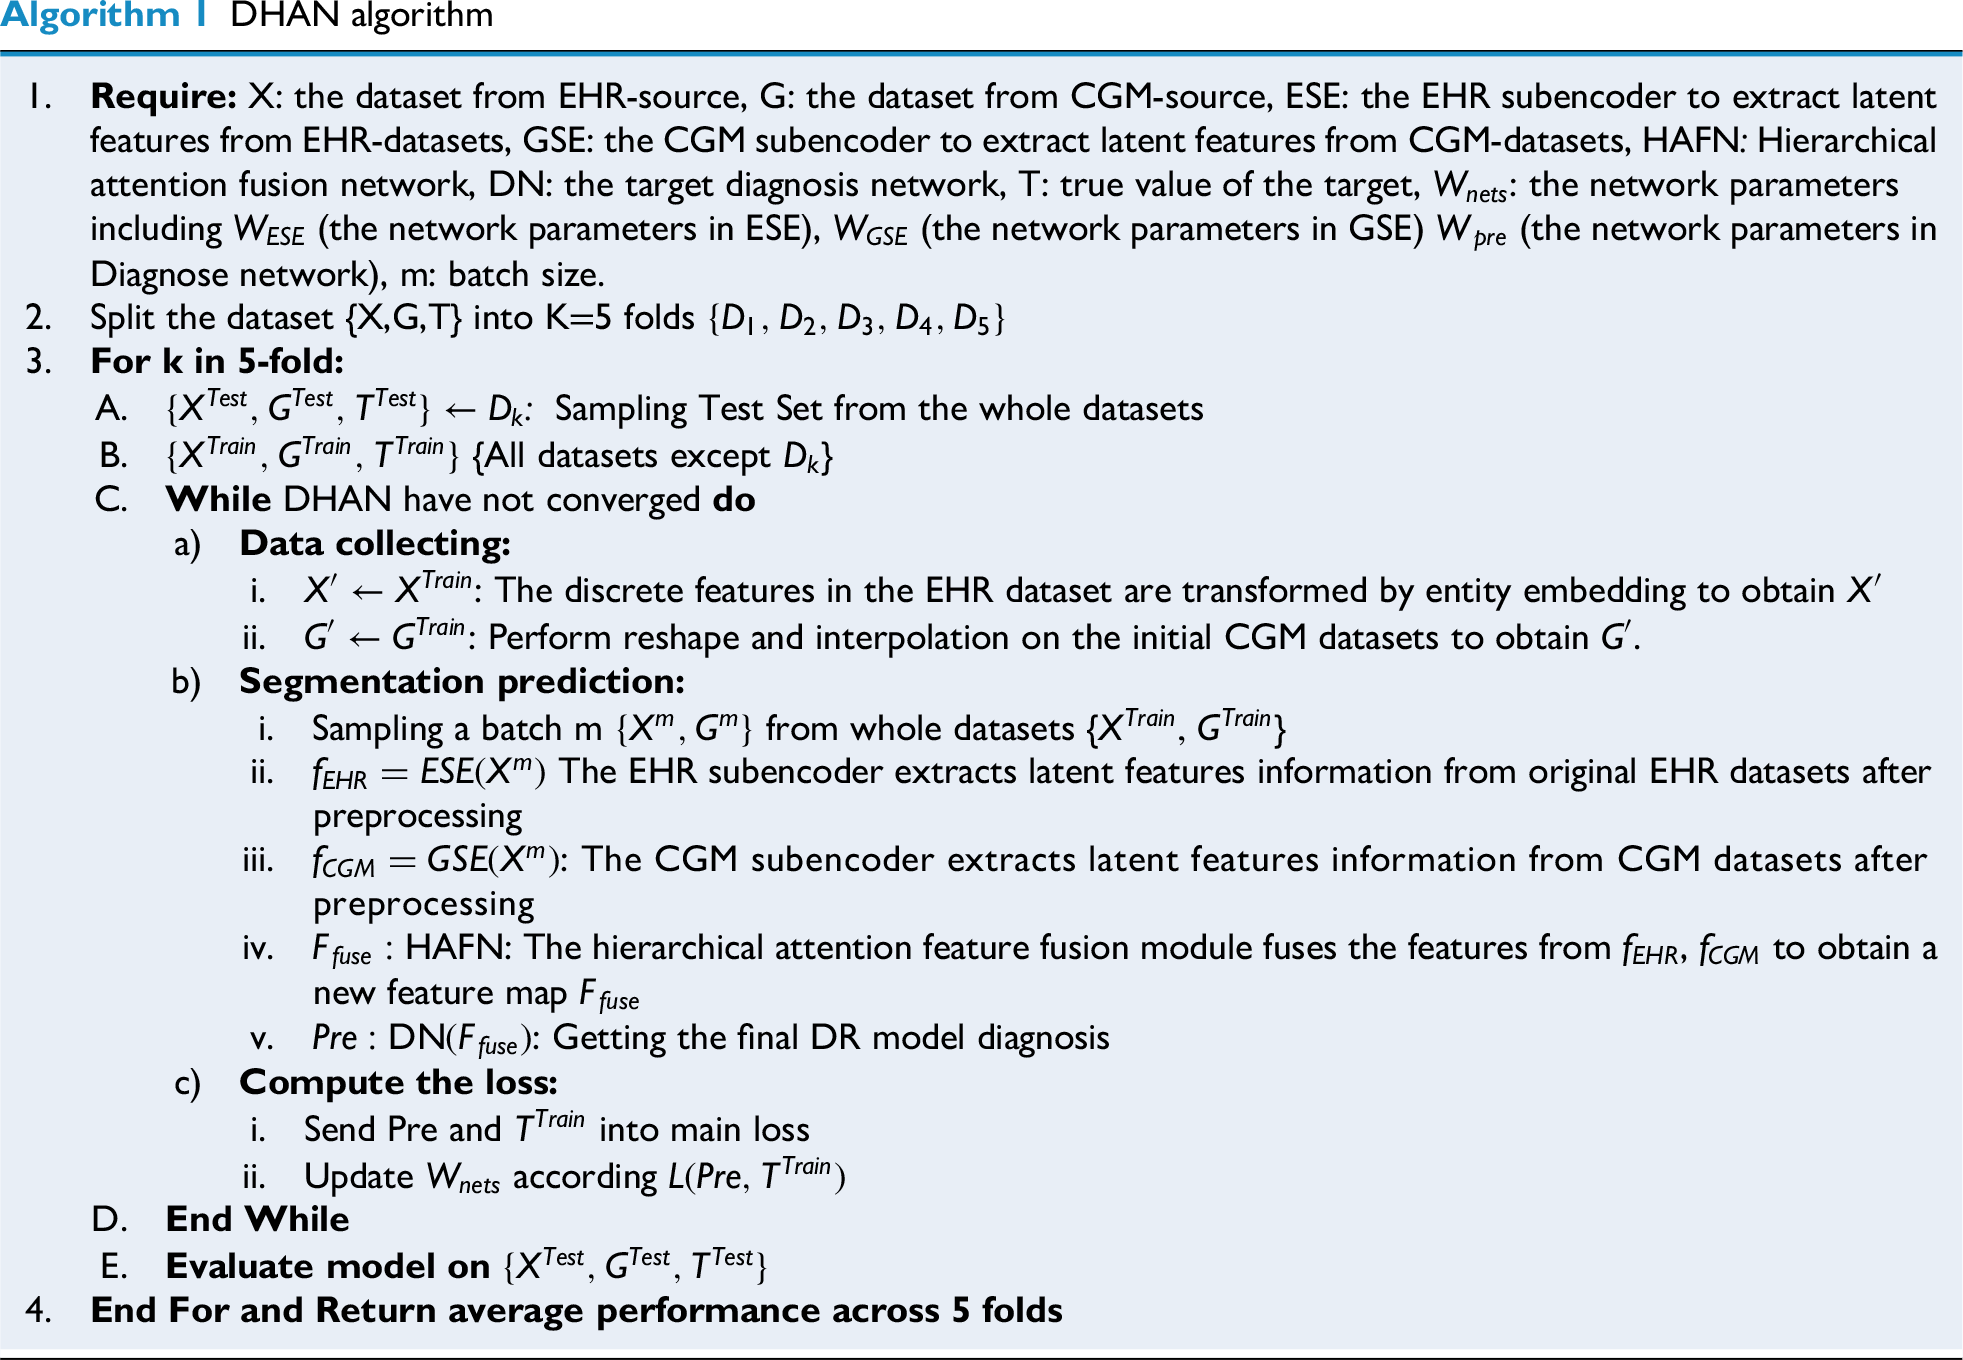
As show in Figure 3, training phase was the first phase of the three stages, followed by network assessment and utilization. The optimal model was obtained through continuous training with five-fold cross-validation and parameter evaluation in the first phase. The whole training steps were summarized in Algorithm 1. After that, the network was applied to validation dataset using the optimal classification model in the validation/testing phase.

Flowchart of the multisource heterogeneous attention network training.
Results
Data sources
This retrospective study followed the principles of the Declaration of Helsinki. Approval was granted by the Research Ethics Committee of Shanghai Jiao Tong University School of Medicine Affiliated Sixth People's Hospital. All the participants included in the study have informed consent. Patient inclusion criteria for this study were as follows: hospitalized patients, stable on treatment for at least 3 months, age ≥18 years, and with at least 5 days of CGM valid readings. Exclusion criteria included hyperglycemic hyperosmolar state, severe or recurrent events within the last 3 months, diabetic ketoacidosis, malignancy, or a history of psychiatric disorders. Each patient wore CGM sensors (iPro2, Medtronic, Inc., USA) during the 7 days of hospitalization, adhering to strict dietary and exercise controls to minimize the influence of extraneous factors on the dynamics of glucose fluctuations. The sensors used subcutaneous electrodes to measure blood glucose concentration via glucose oxidase, recording values every 5 min. CGM data from the first and last days were removed, and complete data from the middle 5 days were collected. EHR data included two parts. First, routine examinations to collect fundamental biochemical indicators such as HbA1c, albumin, blood pressure readings, fasting plasma glucose (FPG), and so on. Second, questionnaire surveys collected including data such as duration, age, sex, family medical history, acute complication history, and hypertension history (Table 1). Invalid data and equipment outliers were excluded by experts. Cases with incomplete clinical features were also removed to minimize bias due to missing data and to ensure reliable model training.44,45 Prior to model development, the dataset was cleaned to handle missing or inconsistent values and preprocessed to normalize features where appropriate. Finally, the DR diagnosis was determined from fundus images by two experts, collected at the end during the CGM wearing period. Because the DR was a chronic complication, the labels could be reasonably be regarded as representative of the patient's disease state throughout the entire CGM monitoring period.
A total of 623 patients were initially screened, of whom 64 were excluded due to missing key clinical features, leaving 559 patients in the final analysis. A brief descriptive check showed that the included and excluded patients had similar demographic and clinical profiles, indicating that the complete-case approach is unlikely to have introduced major selection bias. Among the 559 patients, 157 were diagnosed with DR and 402 patients were non-DR. Basic information of the patients is shown in Table 2. We used five-fold cross-validation (four folds for training and the last one-fold for testing in each fold), ensuring that no patient contributed data to more than one-fold for avoiding leakage. All EHR features were normalization prior to processing. Normalization parameters were strictly estimated based on the training dataset within each fold, subsequently applied to the corresponding validation and test sets to prevent any training-test information leakage.
Basic features of the samples included in the study.

DR: diabetic retinopathy; BMI: body mass index; SBP: systolic blood pressure; DBP: diastolic blood pressure; CHD: coronary heart disease.
Non-normally distributed characteristics are presented as median [interquartile range], categorical features are presented by ratio. p Values are from Mann Whitney-U test for continuous features and from chi-square test for categorical features.
Metrics and implementation details
Evaluation metrics
In traditional binary classification, metrics such as PREcision (PRE), ACCuracy (ACC), RECall (REC), SPEcificity (SPE), and negative precision value (NPV) are typically used to assess network performance.46,47 However, these metrics may not be as accurate when the dataset is imbalanced. To address this, the Matthews correlation coefficient (MCC), F1-score, and G-mean
48
are also used to evaluate network performance under conditions where the numbers of patients with DR and without DR patients differed. All metrics were computed using a fixed probability threshold of 0.5:


Experimental setup
Multiple benchmark tests were conducted. The training and test sets were based on five-fold cross-validation; we took an individual patient as a unit to ensure there are no overlapping data among five-folds.
Two aspects were emphasized in the experiments:
Learning ability with multiheterogeneous source data. Validity of dual-attention mechanism strategies.
First, we evaluated the performance of these networks with single-source data as inputs and identified the best subnetworks that formed the most effective coupling network. Then an experiment was conducted to assess the performance of coupling networks with different subnetwork. Based on the results, a progressive ablation study was carried out to verify the subsection of the proposed model. Finally, the results are quantitatively presented in detail.
Implementation details
To generate the proposed method, certain deep architectures were used. In the CGM subencoder, the LSTM block contained 100 memory cells. Then CNN layers with a kernel size of 3 and a filter size of 64 were followed. The dense layers in this part consisted of 100 and 16 units. The number of latent features was set to 16, with justification provided in the subsequent discussion. In the EHR subencoder, the filter size was set to 128 with a kernel size of 8 followed by a dense layer with 16 units. The hyperparameters in the training process were tuned via a grid search within a nested cross-validation loop. We selected the best mean F1 score of inner-validation performance. All the hyperparameters and search space are provided in Supplemental Table S1. The network was optimized using AdamW (initial learning rate = 1 × 10⁻³; weight decay = 1 × 10⁻⁴) with a batch size of 32. The learning rate was halved adaptively if no improvement was observed after 10 epochs. Dropout (0.2) was applied after the hierarchical attention block to reduce co-adaptation. Early stopping was employed on the internal validation subset in the nested cross-validation with a patience of 30 steps. During backpropagation, gradient clipping was used to prevent gradient explosions. The model was implemented in Keras using Python 3. The key hyperparameters for each baseline model were tuned via a grid search (Supplemental Table S2). All deep learning models were trained using the Adam optimizer with a batch size of 32 and an initial learning rate of 1 × 10⁻³.
Hyperparameters of DHAN setting
As we examined the intricacies of the CGM and EHR subencoder networks, it became evident that different latent feature sizes yielded varying performance outcomes in subsequent diagnostic tasks. The dimensionality of the latent features was a critical factor in effectively characterizing the original data. To mitigate potential bias arising from disparities in source feature dimensions, we required uniform compression dimensions across both data sources. To illustrate the role of feature compression, we tested dimensions of 18, 16, 12, 8, 6, and 4. The experimental findings from the nested cross-validation loop are presented in Figure 4 and Table 3.

The radar chart of the different latent numbers for two sources..
Performance evaluation.

PRE: precision; ACC: accuracy; REC: recall; SPE: specificity; NPV: negative precision value; MCC: Matthews correlation coefficient. Bold values indicate the best performance among the compared methods.
Performance was maximized when features were compressed to 16 dimensions. This outcome may be attributed to the presence of noise and redundant information in the higher-dimensional CGM sensor data, as well as covariance in the EHR measurements. When the number of dimensions was further reduced, performance declined, probably because of information loss caused by excessive compression. Consequently, the 16-dimensional features showed higher information density, which translated into superior diagnostic performance. Interestingly, specificity was the highest when features were compressed to four dimensions, possibly because lower dimensionality shifted the information distribution toward a larger number of samples. However, considering all metrics—especially MCC, F1-score, and G-mean—the model achieved values of 0.72, 0.80, and 0.89, respectively, with a latent feature size of 16. Therefore, we selected 16 dimensions for both data sources in subsequent experiments.
Single-source data performance evaluation
As depicted in Figure 5, box plots were employed to visually represent the metrics derived from single-source CGM sensor data and EHR measurements. We selected CNN, 49 LSTM, 50 gated recurrent unit, multilayer perceptron (MLP) , 51 and transformer 52 as baseline models for comparison with our proposed CNN + LSTM coupled CGM feature extraction encoder. Among the compared networks, CNN + LSTM demonstrated the highest overall performance on CGM data. Across multiple replicated experiments, it consistently outperformed the other models in all aspects except for SPE and PRE. This indicates that the model yielded fewer false negatives and misdiagnoses. Its performance in terms of SPE and NPV was also commendable. Furthermore, it achieved the highest MCC (0.25), F1-score (0.63), and G-mean (0.75). Although LSTM exhibited greater SPE than CNN + LSTM, it slightly lagged in other key metrics. Notably, the MLP model, while outperforming in SPE, showed lower REC and F1-score owing to its limited ability to capture CGM properties, resulting in the prediction of all samples as negative. In addition, CNN + LSTM exhibited a smaller interquartile range (IQR) and shorter whiskers than the other classifiers, suggesting a stronger central tendency, lower dispersion, and enhanced robustness. These findings confirmed that the CGM coding layer integrated into CNN and LSTM was more effective at harnessing the unique characteristics of CGM glucose time-series data compared with alternative networks. Therefore, CNN + LSTM emerged as the most suitable choice for CGM time-series feature extraction.

Box plots of single-source network comparisons. Boxes plot of (a) PRE, (b) ACC, (c) SPE, (d) REC, (e) NPV, (f) MCC, (G) F1-score, and (H) G-mean. PRE: precision; ACC: accuracy; SPE: specificity; REC: recall; NPV: negative precision value; MCC: Matthews correlation coefficient.
In contrast to the considerably scaled CGM sensors of 288 × 5, the EHR measurement data presented a distinct classification challenge with only 20 features (categorical and continuous), indicating a typical low-dimensional problem. Consequently, we compared logistic regression (LOG), 53 random forest (RF), 54 support vector machine (SVM) 55 AdaBoost, 56 transformer, 57 and CNN classifiers, which were commonly adopted in such scenarios. All methods used the 20 features listed in Table 1. In terms of EHR data, CNN and AdaBoost achieved strong classification capabilities, especially in key indicators such as PRE, ACC, MCC, and F1-score. SVM, LOG, and RF formed a second tier with similar performance. CNN achieved the highest medians and smaller dispersions across ACC, PRE, REC, MCC, F1, and G-mean. While both CNN and AdaBoost achieved high SPE and NPV, CNN attained a higher REC (0.65) than AdaBoost (0.54). Compared with CNN, AdaBoost was more sensitive to label noise and class imbalance. The traditional LOG and SVM models performed moderately across most indicators, with SVM showing particularly poor performance in REC and F1-score, likely because of its insensitivity to high-dimensional sparse features.
Overall, the stability of the models on EHR data was slightly better, but CGM data also demonstrated strong diagnostic potential when combined with deep learning structures, particularly CNN + LSTM. These findings suggested that both data sources have important application value in DR diagnosis. For CGM sensors, CNN + LSTM was the most appropriate choice for feature extraction, while CNN was the most reasonable choice for EHR data. The CGM and EHR subencoder frameworks are shown in Figure 6.

The framework of (a) CGM subencoders and (b) EHR subencoders. CGM: continuous glucose monitoring; EHR: electronic health record.
Multifusion strategies performance experiments
In the previous subsection, CNN + LSTM and CNN were selected as candidates for subnetworks to learn latent features from CGM and EHR data, respectively. To benchmark against naïve fusion strategies, we included early fusion (data fusion without preprocessing), 58 middle fusion (feature concatenation + MLP), 59 and late fusion (independent streams with averaged logits). 60 In the early fusion model, raw CGM sequences were concatenated with one-hot encoded EHR variables, and dense networks were trained with identical tuning budgets. In the middle fusion model, feature-level concatenation was performed by fusing the outputs of the subencoders, followed by training a dense network without attention. In the late fusion model, calibrated unimodal models were trained independently, and their probabilities were combined by averaging.
Figure 7 compares the four-fusion strategies in terms of receiver operating characteristic value (ROC) and precision-recall curve (PR). In the ROC plot (Figure 7(a)), DHAN outperformed all baselines in terms of true positive rate and false positive rate, indicating stronger discrimination. Specifically, DHAN achieved an AUC of 0.87, higher than middle fusion, which ranked second. In the PR plot (Figure 7(b)), DHAN achieved the highest average precision (AP = 0.861), which was 20% higher than that of late fusion (AP = 0.721). Overall, DHAN maintained a higher precision and greater AUC across the entire recall range, demonstrating superior PR trade-offs and clinical utility under imbalanced conditions. This reflects the dynamic calibration capability of inner-source and inter-source hierarchical attention, which mitigates interference from irrelevant features. Interestingly, middle fusion achieved a relatively high ROC by enabling cross-modal interaction at the feature level, thereby improving discrimination. In contrast, late fusion combined decisions more conservatively through weighted averaging, reducing false positives and yielding a higher AP.

The performance of different fusion strategy: (A) ROC curve and (B) precision-recall curve. ROC: receiver operating characteristic.
Ablation study
In this study, we conducted an ablation analysis to evaluate the effectiveness of hierarchical attention. Two distinct attention blocks were progressively integrated into the network architecture to compare their impacts and validate their efficacy. Box plots illustrating the various metrics are provided in Figure 8(a) to (h) for comprehensive visualization and analysis. The modules were defined as follows: (a) C-L-NoAt (red): baseline model with two-channel feature extraction, without embedding or attention mechanisms; (b) C-L-eb-NoAt (blue): baseline model with entity embedding added; (c) C-L-eb-InAt (orange): entity embedding plus inner-source attention; and (d) C-L-en-HAt (green): full hierarchical attention mechanism with both inner-source and inter-source attention.

The box plot of attention ablation test: (a) PRE, (b) ACC, (c) SPE, (d) REC, (e) NPV, (f) MCC, (G) F1-score, and (H) G-mean. PRE: precision; ACC: accuracy; SPE: specificity; REC: recall; NPV: negative precision value; MCC: Matthews correlation coefficient.
Entity embedding: Among the metrics illustrated in Figure 8(a) to (h), a clear observation emerged: the CNN + LSTM network, enriched with entity embedding, demonstrated superior performance compared with the standard coupling network lacking this mechanism. This discrepancy was evident in both the IQR and mean values (the IQR was represented by the gray line in the center of each plot). The blue module consistently exhibited higher values than the red baseline. Of particular note in Figure 8, the median values of the entity-embedding network outperformed the third-quartile values of the no-attention network across metrics such as MCC, F1-score, and G-mean. These findings indicated that the entity-embedding mechanism effectively fuses heterogeneous EHR data, encompassing both discrete and continuous variables.
Inner-source attention: The performance of the multisource network was partially enhanced by incorporating inner-source attention. As shown in Figure 8, the network equipped with inner-source attention achieved higher median values than the unattended network across most metrics. For example, median ACC improved by 1%, and mean REC increased by nearly 6%. For metrics such as MCC, F1-score, and G-mean, the IQR of the network with inner-source attention was narrower than that of the model without attention, suggesting a more concentrated distribution of cross-validation results. This reduction in variability indicated that inner-source attention stabilizes the cross-validation outcomes, yielding more consistent and reliable performance. However, improvements remained limited: SPE decreased while REC increased. This finding highlighted the necessity of hierarchical attention strategies.
Hierarchical source attention: The integration of inner-source and inter-source attention established a hierarchical attention configuration, which played a pivotal role in significantly enhancing the overall performance of our methodology. Across all eight key metrics in Figure 8, the proposed network with hierarchical attention consistently outperformed its counterparts—whether lacking attention mechanism or employing only inner-source attention. This superiority was evident not only in terms of the mean and median values but also in the overall coherence of result distributions. Compared with alternative approaches, our hierarchical attention strategy demonstrated heightened efficacy across multiple metrics, including accuracy, precision, and specificity. Specifically, MCC after the fusion of hierarchical attention mechanisms was nearly doubled compared with C-L-NoAt, while F1-score and G-mean were also substantially improved. These results demonstrated that the hierarchical attention effectively mine inner-source key features and inter-source complementary features in multisource data, thereby enhancing feature extraction and attention capabilities, and ultimately improving model performance.
The attention weights were used to construct heatmaps for the models. 39 This was helpful for highlighting the individual characteristics that had the most influence on DR diagnosis. For clarity of representation, 20 samples were randomly selected and their heatmaps were plotted using inner-source and inter-source attention mechanism within our model. Figure 9(a) to (d) shows the heatmaps of the hierarchical attention outputs. Figure 10(a) to (d) presents the heatmaps of top three latent features with clinical indicators.

Attention weights for hierarchical attention. Each row along the y-axis is a patient. (a) Attention weights for output of the CGM inner-source attention. (b) Attention weights for output of the EHR inner-source attention. (c) Attention weights for output of the CGM inter-source attention. (d) Attention weights for output of the EHR inter-source attention. The darker the color, the greater the weight. CGM: continuous glucose monitoring; EHR: electronic health record.

Heatmaps between top three latent features with clinical indices. (a) Heatmap for CGM inner-source attention. (b) Heatmap for EHR inner-source attention. (c) Heatmap for CGM inter-source attention. (d) Heatmap for EHR inter-source attention. The darker the color, the greater the weight. CGM: continuous glucose monitoring; EHR: electronic health record.
Figure 9(a) displays the heatmap of attention weights for the CGM source after inner-source attention. The attention was concentrated on features 2, 3, and 4 in the random samples. The CGM feature extraction model successfully identified key features, whereas the attention mechanism enhanced the model's ability to prioritize clinically important variables. To further explain these latent features, we quantified the CGM source data through some clinical indicators such as time in range (TIR), standard deviation of blood glucose (SDBG), mean blood glucose (MBG), mean amplitude of glycemic excursions (MAGE), mean of daily differences (MODD), high blood glucose index (HBGI), and coefficient of variation (CV). For EHR data, the features listed in Table 1 were used. Correlations between latent features and clinical indicators are shown in Figure 10(a). Features 2 and 3 exhibited strong correlations with SDBG and CV, implying that blood glucose variability influences the development of ocular complications and was amplified by inner-source attention. Feature 3 was also associated with MODD and MAGE, suggesting that daily fluctuations in glucose levels should be considered alongside DR risk. Feature 4 correlated strongly with MBG, TIR, and HBGI, indicating that hyperglycemia contributes to the progression of complications.
Figure 9(b) shows the heatmap of attention weights for the EHR source after inter-source attention. Similar to CGM, the mechanism concentrated on specific features, notably feature 6, had the highest attention weight. This highlights the role of attention in feature fusion. In Figure 10(b), feature 6 was associated with HbA1c, glycated albumin (GA), and FPG in relation to DR. Feature 9 focused on age and duration of diabetes, while feature 14 correlated with most EHR indicators but was particularly linked to body mass index, suggesting that body weight should be considered in DR evaluation.
Figure 9(c) illustrates inter-source attention distributions between CGM and EHR sources, visualized as heatmaps, where rows represented patients and columns corresponded to feature indices. Unlike inner-source attention, the CGM heatmap revealed a distinct pattern, with features 3, 6, and 13 most prominently highlighted. This demonstrated that inter-source attention complemented inner-source attention. As shown in Figure 10(c), feature 3 correlated strongly with HbA1c, GA, and FPG, while feature 13 was highly associated with family history and coronary heart disease, in addition to age and duration. These findings suggested that these indicators influence blood glucose levels, thereby affecting DR.
Figure 9(d) shows the EHR heatmap under inter-source attention. While reinforcing most variables, it additionally highlighted features 1, 5, and 15, reflecting attention to structured medical data. These differences from inner-source attention demonstrated how hierarchical attention fuses multisource data, prioritizing complementary features across sources. Such hierarchical integration enhanced the model's ability to mine features from diverse data types. As depicted in Figure 10(d), features 1, 5, and 15 exhibited strong correlations with CGM metrics, suggesting that glucose fluctuations may trigger inflammatory responses, which in turn influence clinical indicators and contribute to the development of DR.
Model performance evaluation
In this section, we presented the experimental results through quantitative analysis. As displayed in Table 4, four distinct sets of assessments were conducted. The first and second groups involved the use of single data source (CGM and EHR, respectively), the third group employed a multifusion strategy, and the fourth group involves multisource heterogeneous data fusion. Comparisons between individual data sources have already been discussed. Here, our primary focus was on contrasting the performance results obtained from CGM and EHR datasets. Remarkably, the EHR model consistently outperformed the CGM model. For instance, when examining the MCC performance metric, the CNN model applied to EHR data surpassed the CNN + LSTM network based on CGM data by nearly 0.2 points. Similarly, the G-mean metric improved by 0.02. This substantial difference underscored the distinctive and potentially more discriminative features presented in the EHR datasets.
Performance evaluation.

PRE: precision; ACC: accuracy; REC: recall; NPV: negative precision value; SPE: specificity; MCC: Matthews correlation coefficient; MLP: multilayer perceptron; LSTM: long short-term memory; CNN: convolutional neural network; GRU: gated recurrent unit; CGM: continuous glucose monitoring; LOG: logistic regression; SVM: support vector machine; RF: random forest; EHR: electronic health record.
Bold values indicate the best performance among the compared methods.
In the subsequent analysis, we compared our multisource fusion network. Notably, the C-L-NoAt model demonstrated performance equivalent to that achieved using single-source EHR features. These observations suggested that simply concatenating multisource features yields no improvement over single-source models. The results demonstrated that effective fusion strategies were essential when working with heterogeneous data. Our initial attempt at multisource fusion did not achieve optimal evaluation scores because the network lacked an attention mechanism. Without attention, the fusion stage combined features indiscriminately, introducing bias. The turning point came with the introduction of inner-attention, which raised the F1-score from 0.52 to 0.80 and improved performance across all other metrics. One highlight was a G-mean of 0.89, far higher than that of the comparison models. SPE showed an interesting pattern. DHAN did not yield the highest specificity. High SPE values in simpler models were often the result of overfitting to imbalanced data, where most samples were predicted as negative, inflating specificity without adding real diagnostic value. By contrast, the DHAN model behaved differently: its slightly lower specificity reflected its ability to learn from multisource features and to distinguish majority from minority classes. In brief, the DHAN model utilized better the discriminative features. It detected DR patients more accurately and minimizes the bias.
Discussion
This study proposed a novel paradigm for multisource heterogeneous biomedical data fusion, achieving improved accuracy in DR diagnosis (F1-score: 0.80; G-mean: 0.89) compared with single-source screening using CGM sensor time-series data or structured EHR measurements. These findings highlight the critical role of heterogeneous data fusion in capturing the multifactorial nature of DR and address a key limitation of previous studies that relied solely on CGM or structured clinical data. To the best of our knowledge, this study represents the attempt to integrate multisource heterogeneous data from CGM and EHR for remote, intelligent DR diagnosis, thereby avoiding the drawbacks associated with frequent follow-up fundus examinations.
The superior performance of biomedical data fusion likely stems from the complementary role of CGM and EHR in reflecting distinct aspects of metabolic dysregulation. First, we designed a novel method to process CGM sensor data and EHR measurements. A CNN + LSTM coupled subencoder was developed to capture the temporal and dynamic characteristics of CGM time-series data, effectively mining hidden features. Blood glucose characteristics captured by CGM have been shown to be independent risk factors for DR progression. At the same time, the embedding design in the EHR subencoder effectively fused heterogeneous feature types, including both discrete and continuous variables. Second, the hierarchical attention mechanism enabled deeper exploration of important features within each source while simultaneously modeling correlations between sources. This fusion of inner-source and inter-source features enhanced DR diagnosis. Moreover, CGM-derived time-series features and EHR-based comorbidities jointly contributed to diagnostic accuracy, supporting the hypothesis that acute and chronic metabolic insults synergistically exacerbate retinal damage.
In addition to discrimination, we examined the reliability of probabilistic outputs using calibration curves. Following standard practice for probability calibration with cross-validation, we computed a single global calibration curve by concatenating out-of-fold predicted probabilities obtained via five-fold cross-validation.61,62 The calibration curve of DHAN (Figure 11) was closely aligned with the 45° reference line, indicating that the predicted probabilities were generally consistent with the empirical outcome frequencies. Mild deviations occurred primarily in the higher-probability region, where the model tended to slightly underestimate the true risk. The 95% bootstrap confidence band substantially overlapped with the diagonal, suggesting that the observed deviations fell within statistical uncertainty given the sample size. These findings demonstrated that DHAN provides not only accurate classification but also well-calibrated probability estimates. Such calibrated outputs were indispensable for downstream risk stratification and clinical decision support in DR management. We further evaluated the DHAN model at a clinically relevant high-sensitivity operating point. At an operating point corresponding to a recall of approximately 0.95, the DHAN model demonstrated a balanced performance. Specifically, this threshold yielded performance metrics as given in Supplemental Table S2. Notably, the MCC was 0.680, indicating that the model maintained a well-balanced classification capability even under a high-sensitivity setting.

The calibration curve of DHAN with 95% bootstrap CI. DHAN: deep hierarchical attention network.
Although there are still gaps between DHAN and Deep-DR's AI model, 63 which is the gold standard based on fundus images. The proposed DHAN model holds significant potential for clinical translation. By enabling noninvasive DR screening through routine CGM and EHR data, DHAN could reduce reliance on specialized ophthalmologic equipment, particularly in underserved regions. In different application scenarios, DHAN can combine the patient's weekly CGM sensor data with the quarterly EHR measurement data from the most recent examination to provide a weekly risk assessment of the patient. The risk assessment results could be used for the initial screening of T2D, which can greatly conserve medical resources in underdeveloped areas. Moreover, the model can be expanded to incorporate additional data sources, allowing adaptation to diverse remote diagnosis and treatment scenarios. Future work should focus on integrating this model into telemedicine platforms for DR risk stratification. Furthermore, the hierarchical attention mechanism may be adaptable to other multifactorial diseases (e.g., diabetic nephropathy), warranting cross-disciplinary validation.
Several limitations should be noted. The strict requirement for complete CGM and EHR data led to the exclusion of some patients, and the retrospective single-center design resulted in a relatively homogeneous cohort. These factors may introduce selection bias and limit the generalizability of the findings. Although such controlled cohorts are appropriate for proof-of-concept evaluation, future work should include multicenter and prospective validation to strengthen external applicability. In addition, although DHAN demonstrates robust performance, its computational complexity may hinder deployment in resource-constrained or embedded settings. Future studies should explore lightweight variants of the architecture suitable for edge-device deployment to assess their applicability across diverse clinical scenarios.
Conclusion
This study proposes a multisource fusion architecture for DR diagnosis that effectively combines CGM measurements with structured clinical EHR variables using deep learning subencoders and hierarchical attention mechanisms. The framework integrates heterogeneous data using source-specific subnetworks and hierarchical attention, thereby enhancing the diagnostic capability of the model in DR. The proposed framework achieved significantly better results than single-source models across multiple clinical metrics, including F1-score and G-mean. It also outperformed other fusion strategies in terms of ROC–AUC and AP. Moreover, attention visualizations and feature mapping established links between latent features and CGM/EHR indicators, improving model transparency and explainability. The research design was retrospective and single-center, which may introduce bias and limit generalizability due to sample size and case composition. Future work will validate the model using multicenter prospective data to assess transferability across institutions and fairness across subgroups. Furthermore, we plan to evaluate the model in real-world telemedicine settings to strengthen its clinical utility.
Supplemental Material
sj-docx-1-dhj-10.1177_20552076251408517 - Supplemental material for DHAN: A deep hierarchical attention network for multisource biomedical data fusion in precision diabetic retinopathy diagnosis
Supplemental material, sj-docx-1-dhj-10.1177_20552076251408517 for DHAN: A deep hierarchical attention network for multisource biomedical data fusion in precision diabetic retinopathy diagnosis by Rui Tao, Hongru Li, Jingyi Lu, Yaxin Wang, Jian Zhou and Xia Yu in DIGITAL HEALTH
Footnotes
Acknowledgments
We would like to thank all the clinicians, nurses, and technicians at the Shanghai Clinical Center for Diabetes for dedicating their time and expertise to the completion of this study. We are also grateful to the editors and anonymous reviewers for their constructive comments and suggestions, which substantially improved the quality of this work.
Ethical considerations
This study was conducted in line with the principles of the Declaration of Helsinki. Approval was granted by the Research Ethics Committee of the Shanghai Jiao Tong University School of Medicine Affiliated Sixth People's Hospital (Approval date: 2017-04-27, Approval number: 2017-047).
Author contributions
Rui Tao: conceptualization, methodology, software, validation, and writing—original draft. Hongru Li: supervision, funding acquisition, and writing—review and editing. Jingyi Lu: data curation, investigation, and writing—review and editing. Yaxin Wang: data curation and investigation. Jian Zhou: resources, data curation, investigation, funding acquisition, and writing—review and editing. Xia Yu: resources, conceptualization, supervision, and writing—review and editing.
Consent to participate
Informed consent was obtained from individual participants included in the study.
Funding
The authors disclosed receipt of the following financial support for the research, authorship, and/or publication of this article: This work was supported by the Noncommunicable Chronic Diseases-National Science and Technology Major Project (2024ZD0532000; 2024ZD0532003), National Natural Science Foundation of China (Grant 62573095 and 62573093).
Declaration of conflicting interests
The authors declared no potential conflicts of interest with respect to the research, authorship, and/or publication of this article.
Data availability
The datasets generated and analyzed during the current study are not publicly available due to the sensitivity of human data, but are available from the corresponding author upon reasonable request.
Supplemental material
Supplemental material for this article is available online.
References
Supplementary Material
Please find the following supplemental material available below.
For Open Access articles published under a Creative Commons License, all supplemental material carries the same license as the article it is associated with.
For non-Open Access articles published, all supplemental material carries a non-exclusive license, and permission requests for re-use of supplemental material or any part of supplemental material shall be sent directly to the copyright owner as specified in the copyright notice associated with the article.