
Abstract
Objective
To determine whether the lactate dehydrogenase-to-albumin ratio (LDAR) predicts 28-day mortality in critically ill patients with gastrointestinal (GI) malignancies and to quantify its incremental value in machine learning (ML) models.
Methods
We conducted a retrospective cohort study in Medical Information Mart For Intensive Care IV (2008–2019). Adults with GI malignancies who met Sepsis-3 within 24 h of their first intensive care unit (ICU) admission were included. LDAR was computed from laboratory results obtained within 24 h. The primary outcome was 28-day all-cause mortality. Associations were estimated with multivariable logistic regression; nonlinearity was evaluated using restricted cubic splines. Multiple ML classifiers (AdaBoost, XGBoost, random forest) were trained with a 7:3 split and 5-fold cross-validation. Discrimination (area under the curve—AUC), clinical utility (decision-curve analysis), and interpretability (Shapley additive explanation—SHAP) were assessed. Prespecified subgroup analyses stratified by metastatic status and infection site were performed. Covariates included age, sex, weight, vital signs, Sequential Organ Failure Assessment, and metastatic status. Missingness was handled with multiple imputation by chained equations.
Results
Among 1177 patients, 28-day mortality was 48.4%. Higher LDAR was independently associated with death; the adjusted odds ratio for Q4 vs Q1 was 5.15 (95% CI 3.52–7.61; P < 0.001). Spline analyses showed a steep risk rise above log2(LDAR) = 5.314 (≈40). Effects were directionally consistent across subgroups with no significant LDAR × metastatic interaction (P = 0.084) and borderline heterogeneity by infection site (P = 0.051). The best ML model, AdaBoost, achieved an AUC of 0.835 and yielded the largest net clinical benefit across clinically relevant thresholds. SHAP ranked LDAR among the most influential predictors. Sensitivity analyses using alternative exposure codings produced concordant estimates. Model calibration was acceptable.
Conclusion
LDAR is a simple, interpretable, and independently prognostic biomarker for 28-day mortality in ICU patients with GI malignancies. Incorporating LDAR into ML models improved discrimination and decision benefit over conventional severity scores, supporting LDAR-based early risk stratification. External multicenter validation and evaluation of dynamic LDAR trajectories are warranted, and transparent analytic reporting.
Keywords
Introduction
Gastrointestinal (GI) malignancies represent a major global health burden, contributing significantly to cancer-related mortality. According to GLOBOCAN 2022, an estimated 20 million new cancer cases and 9.7 million cancer deaths occurred worldwide in 2022. 1 Colorectal, liver, and stomach cancers ranked among the five leading causes of cancer mortality globally, after lung cancer. 1 Despite advances in diagnosis and therapy, patients with advanced GI cancers frequently require intensive care unit (ICU) care for tumor- or treatment-related complications. 2 Projections further indicate that annual new cancer cases may approach 35 million by 2050, underscoring the sustained global burden relevant to GI malignancies. 1 It has been reported that approximately 5% of patients with solid tumors experience life-threatening events necessitating ICU admission within two years of diagnosis. 3 Currently, patients with malignancies account for an estimated 15%–20% of all ICU admissions.2,4 Among them, individuals with GI cancers are particularly susceptible to critical illness due to tumor-related complications, including massive bleeding, perforation, bowel obstruction, and therapy-related toxicity.2,4 However, their prognosis remains poor. Earlier studies have reported in-ICU mortality rates as high as 40%–50%. 5 Although short-term survival has improved over the past decade—with 28-day mortality falling from >30% to ∼20%–25%6,7—mortality among ICU patients with cancer remains higher than in non-cancer ICU populations. The 1-year survival rate continues to be less than 30%.7,8 Many patients, even after surviving the ICU stay, die shortly after discharge due to cancer progression or persistent multi-organ dysfunction.7,8 These observations underscore the need for early, objective prognostic assessment to guide ICU admission criteria, treatment intensity, and timely integration of palliative approaches. 9
Conventional severity scoring systems in the ICU, such as the Acute Physiology and Chronic Health Evaluation II (APACHE II), Simplified Acute Physiology Score II (SAPS II), and Sequential Organ Failure Assessment (SOFA), have been widely applied to predict outcomes in cancer patients. However, these tools were originally developed for general ICU populations and were not optimized for the unique pathophysiological characteristics of malignancy, limiting their predictive performance in this subgroup.2,10 A prospective study evaluating four widely used scoring systems—APACHE IV, SAPS III, Mortality Probability Model II at admission (MPM0 II), and the Intensive Care Mortality Model (ICMM)—in critically ill oncology patients reported only moderate discrimination (area under the curve—AUC 0.67–0.73). None of the models accurately differentiated survivors from non-survivors. 11 Prior studies indicate that relying solely on general severity scores yields suboptimal prediction in patients with cancer, underscoring the need for tumor-specific variables to improve risk calibration. A multicenter study by Soares et al. 12 demonstrated that incorporating cancer-related factors such as tumor stage and performance status significantly improved mortality risk prediction. Subsequent research confirmed that integrating variables reflecting tumor burden, disease activity, and host condition enhanced model discrimination and clinical applicability. 2 Several malignancy-specific factors—such as metastatic disease, poor functional status at ICU admission, and multi-organ failure—have been associated with markedly higher mortality, yet were not captured in conventional scoring systems, potentially leading to risk underestimation. 3 In addition, there has been no universally accepted standard for ICU admission criteria or timing in cancer patients. Historically, some institutions adopted restrictive ICU policies for those with advanced malignancies due to their poor prognosis. However, recent studies and consensus guidelines have highlighted the importance of individualized assessment. A substantial proportion of critically ill cancer patients may survive ICU admission and resume anticancer therapy.4,13 One prospective multicenter study reported that approximately 80% of hematologic malignancy patients who survived ICU were able to resume cancer-directed treatment and achieve sustained remission, suggesting that favorable long-term outcomes are possible following intensive care. 14 Overall, prognostic evaluation in critically ill cancer patients remains largely dependent on general severity scores and clinical judgment, both of which carry inherent subjectivity and limitations. Therefore, objective, accurate prognostic biomarkers and tailored predictive models are critically needed for this population.
Lactate dehydrogenase (LDH) and albumin (Alb) have drawn considerable attention as biomarkers in both critical care and oncology settings. LDH, a terminal enzyme of glycolysis, is widely distributed in human tissues and is released in large quantities during tumor cell proliferation, tissue hypoxia, and necrosis. Elevated serum LDH serves as a marker of tumor burden or tissue injury and is associated with adverse clinical outcomes. 15 In a prospective cohort of 7895 patients with cancer, prediagnostic LDH elevation independently predicted higher all-cause and cancer-specific mortality, particularly in colorectal, gastroesophageal, and other GI cancers. 16 Subsequent studies further confirmed independent associations between elevated LDH and reduced survival across advanced solid tumors (breast, prostate, colorectal, esophageal, pancreatic). 16 A recent systematic review reported that LDH correlates strongly with systemic inflammation (neutrophil-to-lymphocyte ratio and C-reactive protein (CRP)) and shows prognostic performance comparable to—and in some analyses exceeding—traditional cachexia-related indicators (body-weight loss, low body mass index (BMI), reduced muscle mass), supporting a role for LDH in GLIM-defined cancer cachexia. 17 In gastric cancer, a meta-analysis (n = 5328) found elevated LDH associated with ∼1.5-fold higher overall mortality. 18 In critically ill patients with infection, LDH has also served as a marker of disease severity, with initial elevation often reflecting multiorgan injury and increased mortality in sepsis.5,19 Conversely, Alb is a multifunctional plasma protein synthesized by the liver and is widely regarded as a surrogate for nutritional and inflammatory status. Hypoalbuminemia is common in critically ill patients and has been linked to systemic inflammatory response and poor outcomes. 20 In ICU populations, low serum Alb at admission has been shown to be an independent predictor of both 28-day and in-hospital mortality, even after adjustment for confounders. 19 In oncology settings, hypoalbuminemia is frequently indicative of malnutrition and cancer-associated wasting and similarly correlates with poor prognosis. Given that LDH and Alb respectively reflect the severity of cellular injury and host nutritional-inflammatory status, their ratio—LDH/Alb, commonly referred to as lactate dehydrogenase-to-albumin ratio (LDAR) or LAR—has been proposed as a composite biomarker for risk stratification in critical illness. 21 This concept has been preliminarily validated across various populations. In a retrospective study of 5784 patients with sepsis, LDAR was identified as an independent predictor of 28-day mortality. Compared with patients in the lowest tertile, those in the middle and highest tertiles had significantly higher mortality risks (hazard ratios (HRs) ≈1.46 and 2.14, respectively), and each log-unit increase in LDAR corresponded to a 36% increase in mortality. 22 LDAR outperformed LDH or Alb alone (c-index 0.69 for short-term mortality) in multivariable analyses. 22 Consistent results were observed in malignancy-associated sepsis: In Medical Information Mart for Intensive Care IV (MIMIC-IV) (n = 1635), elevated LDAR independently associated with 28-day ICU mortality, with the highest quartile showing ∼3.4-fold higher risk vs. the lowest after adjustment. 23 That study also used Boruta feature selection to identify LDAR as the top-ranking predictive variable and subsequently developed a 20-variable random forest model that achieved an AUC of 0.75 in the validation set. 23 Beyond sepsis, LDAR has also demonstrated prognostic value in other critical conditions. In patients with acute respiratory distress syndrome (ARDS), higher LDAR levels were associated with significantly increased 30-day and 90-day mortality, and LDAR achieved a higher AUC (≈0.694) for 30-day mortality than the SAPS II score. 24 In critically ill patients with acute kidney injury (AKI), elevated LDAR was independently associated with in-hospital mortality across all AKI stages. 25 In patients with cirrhosis and sepsis, LDAR also showed comparable predictive performance to MELD and clearly outperformed serum lactate and Alb alone. 26 Collectively, these findings suggest that LDAR captures integrated pathophysiological signals reflecting both tissue damage and host nutritional-inflammatory reserve. Compared to individual biomarkers, LDAR may offer stronger and more consistent prognostic utility. Among patients with GI malignancies—who often experience substantial tumor necrosis and cachexia—LDAR may serve as a simple yet informative marker for clinical risk stratification. GI tumors demonstrate hypoxia-driven glycolysis with frequent LDH-5 up-regulation—particularly in colorectal and gastric cancers—which aligns with HIF-1α signaling, angiogenesis, and worse survival.27–29 In parallel, the high prevalence of hepatic involvement and cachexia in GI malignancies tends to elevate LDH while depressing hepatic Alb synthesis, making the ratio particularly informative.17,20,30 One study in colorectal cancer validated LDAR as an independent prognostic factor, and the LDAR-based prediction model demonstrated superior accuracy compared to the traditional TNM staging system. 31 However, the prognostic value and threshold of LDAR in critically ill patients with GI cancers remain to be further elucidated.
Machine learning (ML) techniques have offered new opportunities for prognostic modeling in critically ill cancer patients, whose conditions are often highly complex and influenced by a wide range of heterogeneous variables. ML algorithms are capable of automatically capturing nonlinear relationships from large-scale clinical datasets and integrating diverse predictors to improve model accuracy and generalizability. In recent years, various ML approaches, including random forests, gradient boosting machines, and deep neural networks, have demonstrated superior performance over traditional logistic regression models in predicting ICU mortality across different populations.32,33 In patients with cancer, ML-based models have shown particular promise by incorporating oncology-specific and critical care parameters to enhance individualized risk assessment. For example, Ko et al. 34 developed an ML-based tool, CanICU, to predict 28-day mortality in critically ill oncology patients using a random forest algorithm that integrated nine clinical and laboratory variables. The model achieved an AUC of 0.94 internally and 0.75–0.78 in external multicenter cohorts (United States and South Korea), with sensitivity 79%–96%. Notably, key predictors included organ dysfunction scores and use of mechanical ventilation, aligning with clinical expectations. Another study in ICU patients with lung cancer reported that an ML ensemble (random forest, LightGBM, and XGBoost) achieved an AUC of 0.92, significantly outperforming conventional logistic regression (AUC ≈ 0.78). 35 Moreover, real-time deep-learning systems for short-term mortality risk in ICU patients have achieved AUCs approaching 0.90 in multicenter validations. 36 Beyond predictive accuracy, ML models also offer interpretability through feature importance ranking and Shapley additive explanation (SHAP) analyses. Prior investigations have identified variables such as LDH and Alb as among the most influential predictors in ML frameworks. 37 Therefore, applying ML techniques to prognosticate outcomes in ICU patients with GI malignancies may enable integration of both clinical variables and laboratory biomarkers—such as the LDAR—to construct more refined and clinically applicable risk models.
The present study aimed to investigate the prognostic value of the LDAR in predicting 28-day mortality among critically ill patients with GI malignancies admitted to the ICU. The study first evaluated the associations between LDH, Alb, and LDAR levels and patient outcomes. Based on these parameters, ML models incorporating disease characteristics, organ dysfunction indicators, and LDAR were constructed and validated. Model performance was then compared with conventional severity scores. The objective was to develop a practical and objective risk stratification tool tailored to this high-risk patient population. Such a model may contribute to improving prognostic accuracy, facilitating individualized clinical decision-making, and supporting communication with families in the management of GI cancer patients in the ICU.
Materials and methods
Data source and ethics
Study design and reporting: This retrospective cohort was conducted and reported in accordance with the STROBE and TRIPOD guidelines for observational studies and prediction-model development/validation.38,39 The study was based on data extracted from the MIMIC-IV database, jointly developed by the Massachusetts Institute of Technology and the Beth Israel Deaconess Medical Center. The database contains de-identified clinical data from patients admitted to the ICU of a single center between 2008 and 2019, including demographic information, vital signs, laboratory results, diagnostic codes, therapeutic interventions, and discharge outcomes. The construction and use of MIMIC-IV were approved by the Institutional Review Boards of the Massachusetts Institute of Technology and Beth Israel Deaconess Medical Center (protocol number 2001P001699), with all data fully de-identified in accordance with the Declaration of Helsinki and the U.S. Health Insurance Portability and Accountability Act (HIPAA). The database is publicly accessible for research purposes upon completion of the requisite training course via the PhysioNet platform and agreement to the data use policy. All analyses in the present study were conducted in compliance with MIMIC-IV data use regulations. MIMIC-IV is distributed on PhysioNet under a Credentialed Health Data Use Agreement that specifies the ethical code and access requirements; the dataset descriptor and ethical framework are publicly available.40–42 The dataset contained no personal identifiers, and no additional data collection or patient interventions were performed. Under this approval, the requirement for informed consent was formally waived; because only de-identified, publicly available data were analyzed, no further institutional IRB review was required.
Study population and selection criteria
This retrospective cohort study used the publicly available MIMIC-IV database (the Massachusetts Institute of Technology and Beth Israel Deaconess Medical Center). Adult patients with GI malignancies admitted for a first ICU stay (2008–2019) who met Sepsis-3 sepsis within 24 h of ICU admission were considered eligible.
Inclusion criteria were as follows: (1) Confirmed GI cancer (ICD-9-CM 150–159; ICD-10 C15–C26), including esophageal, gastric, small-intestinal, colorectal, hepatic, and pancreatic malignancies; (2) Sepsis-3 within 24 h of ICU admission (suspected infection plus an acute SOFA increase ≥2); (3) age ≥18 years; and (4) only the first ICU stay for patients with multiple ICU admissions. Septic shock was defined per Sepsis-3/SSC as sepsis requiring vasopressors plus lactate >2 mmol/L or evidence of organ dysfunction.
Exclusion criteria were as follows: (1) ICU stay <24 h; (2) pregnancy or lactation; (3) end-stage heart failure, end-stage renal disease, or other terminal conditions with limited life expectancy; (4) sepsis onset >24 h post-ICU admission; (5) missing 28-day mortality or other key endpoints; and (6) inability to compute LDAR due to missing LDH or Alb, or >30% missingness in any core variable. Because LDAR cannot be computed without LDH and Alb, these records were excluded a priori; to limit selection bias, we adjusted models for acute severity and care intensity (SOFA, SAPS II, vasopressors, mechanical ventilation, continuous renal replacement therapy (CRRT)).
To ensure data integrity, we additionally excluded records with negative ICU/hospital length of stay (n = 6), body weight <30 kg (n = 1), or missing LDH (n = 571) (required to compute LDAR). Variables with >30% missingness (e.g., lactate, PaO₂/FiO₂, alveolar–arterial oxygen gradient) were excluded. Non-informative identifiers (subject_id, hadm_id, stay_id) were omitted. For missing infection site (n = 179), the source was abstracted from documentation; uncategorizable cases were labeled “Other.”
Overall, 16,469 patients with GI malignancies were initially screened; after sequential exclusions—no ICU admission (n = 13,057), ICU stay <24 h (n = 51), non-malignant diagnoses (n = 1616), and data abnormalities or missing LDH/Alb (n = 568)—1177 adults with GI malignancies and Sepsis-3 sepsis formed the final cohort. The selection flowchart is shown in Figure 1.

Flowchart of patient selection from the MIMIC-IV database (2008–2019). This flow diagram illustrates the sequential inclusion and exclusion of adult ICU patients with GI malignancies from the MIMIC-IV database. A total of 16,469 patients with a diagnostic code for GI cancer (ICD-9-CM: 150–159 or ICD-10: C15–C26) were initially identified. Of these, 13,057 were excluded due to the absence of ICU admission records. Among the remaining 3412 patients, 51 were excluded for an ICU length of stay <6 h. An additional 1616 were removed due to diagnoses not confirmed as GI malignant tumors (e.g., benign conditions or misclassification). The final 1745 patients with confirmed GI malignancies were assessed for data completeness. A total of 568 patients were excluded due to data quality issues, including negative ICU or hospital length of stay, body weight <30 kg, or missing critical laboratory values (LDH or albumin), which were required to compute the LDAR. The resulting final analytic cohort comprised 1177 adult ICU patients with confirmed GI malignancies who met Sepsis-3 criteria for sepsis and complete laboratory data. MIMIC: Medical Information Mart for Intensive Care IV; GI: gastrointestinal; ICU: intensive care unit; LDH: lactate dehydrogenase; LDAR: lactate dehydrogenase-to-albumin ratio.
Variable extraction and definitions
Clinical data were extracted from the MIMIC-IV database for adults with GI malignancies admitted for a first ICU stay (2008–2019), using structured query language (SQL) in a PostgreSQL environment. Extracted variables included demographics (age, sex); illness-severity scores (SOFA, APACHE II, SAPS II); primary ICU admission diagnosis; septic shock; metastatic solid tumors or hematologic malignancies; and Charlson Comorbidity Index–defined comorbidities (hypertension, diabetes, coronary artery disease, chronic pulmonary disease, liver disease, kidney disease, heart failure).
Vital signs included heart rate, respiratory rate, mean arterial pressure (MAP), body temperature, and peripheral oxygen saturation (SpO₂). When multiple measurements were available within 24 h of ICU admission, the mean was used for vital signs, and the most extreme value (maximum or minimum, as appropriate) was used for laboratory results. Laboratory data included LDH, Alb, lactate, CRP, blood urea nitrogen (BUN), creatinine, hemoglobin, white blood cell count and subtypes (neutrophils, lymphocytes, monocytes), platelet count, liver function parameters (AST, ALT, ALP, total bilirubin), coagulation indices (INR, PT, activated partial thromboplastin time (APTT)), and selected electrolytes (e.g., potassium, calcium). For each parameter, the most extreme value within the first 24 h of ICU admission was used (e.g., maximum LDH, minimum Alb).
The LDAR was calculated by dividing LDH (U/L) by Alb (g/dL), yielding a unitless continuous variable. Based on the distribution of LDAR in the study cohort, patients were stratified into quartiles (Q1–Q4), with Q1 representing the lowest quartile and Q4 the highest. To further assess inflammation and nutritional status, three composite indices were computed: The prognostic nutritional index (PNI) = 10 × Alb (g/dL) + 0.005 × lymphocyte count (/mm³); the systemic inflammation response index (SIRI) = neutrophil count × monocyte count ÷ lymphocyte count; and the systemic immune-inflammation index (SII) = platelet count × neutrophil count ÷ lymphocyte count. All blood cell counts were expressed in units of 10⁹/L.
The primary outcome was 28-day mortality, defined as all-cause death occurring within 28 days of the initial ICU admission. Deaths during ICU stay or after discharge but within 28 days were recorded as events. Patients who survived beyond 28 days or were lost to follow-up were considered survivors. Mortality status was determined using the death and dod fields in MIMIC-IV and was cross-validated against discharge times to ensure consistency.
Secondary outcomes included ICU mortality and in-hospital mortality, both recorded as binary variables (0 = survival, 1 = death). To maximize cohort retention and reduce potential bias, multiple imputation by chained equations (MICEs) was applied under the missing at random (MAR) assumption for variables with partial missingness, including Alb, leukocyte differentials, and body weight. All covariates and outcomes were included in the imputation model. Five complete datasets were generated, and final estimates were pooled using Rubin's rules for downstream regression analyses. All variables used in ML models—including demographic, physiologic, laboratory, and intervention-related variables—were retained unless exhibiting >30% missingness.
Missing data handling
To assess data completeness and retain the maximum number of eligible cases, a comprehensive examination of variable integrity was conducted. For variables with low proportions of missingness, we applied MICEs under an MAR assumption to reduce potential bias and improve estimation efficiency.
The imputation model included all mortality-associated covariates (sex, age, SOFA, BUN, WBC count, MAP, heart rate), as well as the outcome variables. Key variables, including Alb, leukocyte subtypes, and body weight, were imputed using predictive mean matching (seed = 123, 20 iterations) to generate five completed datasets.
Final estimates from multivariable regression analyses were combined using Rubin's rules to reflect imputation-related uncertainty. Given that LDH and Alb were essential for LDAR calculation, patients missing either variable were excluded from the analysis without imputation. Imputation was restricted to other clinical variables with partial missingness (e.g., body weight, leukocyte differentials).
To evaluate the robustness of the imputation strategy, a complete-case analysis was conducted in parallel. Consistency in both direction and magnitude of the associations supported the validity of the imputation approach. All imputation procedures were performed using the “mice” package in R (version 4.x), and the process was fully reproducible via documented code. The full imputation script has been documented and is available upon reasonable request.
Statistical analysis
All statistical analyses were conducted using R software (version 4.x; R Foundation for Statistical Computing, Vienna, Austria) and Python (version 3.x). Unless otherwise specified, all tests were two-sided, and a p-value < 0.05 was considered statistically significant.
Descriptive statistics: The Shapiro–Wilk test was used to assess the normality of continuous variables. Normally distributed variables were summarized as mean ± SD and compared using independent-samples t-tests. Non-normally distributed variables were presented as medians with interquartile ranges (IQRs) and compared using the Mann–Whitney U test. Categorical variables were expressed as counts and percentages and compared using the chi-square (χ²) test or Fisher's exact test, as appropriate. Patients were stratified into quartiles based on LDAR levels (Q1–Q4), and differences in baseline characteristics, clinical parameters, and outcomes were compared across quartiles. Multiple comparisons in AUCs were evaluated using DeLong's test. No formal correction for multiple testing was applied due to the pre-specified analytic objectives, though all reported p-values were <0.01, suggesting robustness of the findings.
Logistic regression: Binary logistic regression was used to evaluate the association between LDAR and 28-day mortality (primary outcome). LDAR was modeled both as a continuous and a categorical variable (quartiles, with Q1 as the reference group). Candidate covariates were selected based on a combination of univariate screening (p < 0.10), clinical plausibility, and literature support. Multivariable models were finalized using stepwise selection. The final adjusted model included age, sex, weight, heart rate, MAP, respiratory rate, SpO₂, body temperature, SOFA score, and presence of metastatic solid tumors. Adjusted ORs and 95% CIs were calculated. Model calibration was assessed using the Hosmer–Lemeshow test. Multicollinearity was evaluated via the variance inflation factor (VIF), and variables with VIF > 5 were excluded. As LDH and Alb are direct components of LDAR, they were not included separately in the final model to avoid collinearity.
Restricted cubic spline (RCS) analysis: To evaluate potential nonlinear associations between LDAR and 28-day mortality, RCS modeling was performed within the multivariable logistic regression framework. LDAR was log₂-transformed to reduce skewness. Based on Harrell's recommendations, four knots were placed at the 10th, 35th, 65th, and 90th percentiles of log₂(LDAR). A likelihood ratio test was used to compare the spline model with a linear model to determine the presence of significant nonlinearity. The dose–response relationship between log₂(LDAR) and mortality risk was visualized with predicted probabilities and 95% CIs.
Survival analysis: Kaplan–Meier curves were constructed to estimate 28-day survival across LDAR quartiles, and differences were assessed using the log-rank test. When a significant survival difference was observed, a Cox proportional hazards model was constructed to calculate HRs and 95% CIs, adjusting for relevant covariates, to evaluate the independent prognostic value of LDAR.
ML models: To further assess the prognostic value of LDAR, multiple supervised ML algorithms were developed, including logistic regression, extreme gradient boosting (XGBoost), random forest, LightGBM, AdaBoost, support vector machine (SVM), k-nearest neighbors (KNN), Gaussian naïve Bayes, and multilayer perceptron (MLP). The dataset was randomly split into training and validation sets in a 7:3 ratio. Five-fold cross-validation was applied in the training set to optimize hyperparameters using GridSearchCV (scikit-learn 1.2.2) or BayesSearchCV (scikit-optimize 0.9.0). Regularization (L2 penalty) and early stopping were applied to prevent overfitting, with early stopping triggered if the validation AUC failed to improve after five consecutive iterations. Model performance was evaluated in the validation set based on AUC, accuracy, recall, specificity, and F1-score. Confusion matrices and classification reports were used to support interpretation.
Feature selection and interpretability: To enhance model parsimony and interpretability, the Boruta algorithm was applied for variable selection. Only features with significant importance in predicting 28-day mortality were retained. The input features included all demographic, physiologic, and laboratory variables, as well as therapeutic interventions within the first 24 h (e.g., vasopressor use, mechanical ventilation, CRRT), and severity scores (SOFA, SAPS II). The input features included all demographic, physiologic, and laboratory variables, as well as therapeutic interventions within the first 24 h (e.g., vasopressor use, mechanical ventilation, CRRT), and severity scores (SOFA, SAPS II). For the top-performing models (e.g., XGBoost and random forest), SHAP were used to interpret the contribution and directionality of LDAR and other key predictors, based on SHAP summary and dependence plots.
Decision curve analysis (DCA): DCA was performed on the validation set to assess the net clinical benefit of the models across a range of threshold probabilities (10%–60%). Net benefit curves for each model were compared against two default strategies—treat all and treat none—to evaluate clinical utility in decision-making. For transparency and reproducibility, we also prespecified three operating points for LDAR (≥Q2, ≥Q3, ≥Q4) and calculated confusion matrices and point estimates (sensitivity, specificity, predictive values, and likelihood ratios); the corresponding 2 × 2 tables are provided in Supplemental Table S1. We also performed prespecified subgroup analyses (metastatic vs. non-metastatic; infection site) using the main multivariable specification; results are reported in Supplemental Table S2.
Software and computational environment
All data preprocessing and statistical analyses were conducted in R (version 4.x; R Foundation for Statistical Computing) and Python (version 3.x). Data extraction used PostgreSQL, consistent with the official MIMIC-IV schema. R packages included tableone (baseline summaries), mice (multiple imputation), rms (multivariable logistic regression/RCS), survival/survminer (Kaplan–Meier), and rmda (decision-curve analysis).
ML models were developed in Python. The scikit-learn library was used for traditional classifiers such as random forest, logistic regression, and SVMs; xgboost, LightGBM, and AdaBoost were applied for gradient boosting models. Feature selection was implemented via the BorutaPy package, and model interpretability was assessed using SHAP with the shap library.
Visualization was carried out using matplotlib and seaborn in Python, and ggplot2 in R. All statistical tests were two-sided, with a significance threshold set at P < 0.05. All packages used were the latest stable versions at the time of analysis, ensuring computational reproducibility and methodological reliability. All custom analysis scripts and modeling code are available from the corresponding author upon request or will be deposited in a public GitHub repository following publication.
Results
Baseline characteristics
A total of 1177 adult ICU patients with GI malignancies were included in the analysis. Patients were stratified into quartiles based on LDAR levels upon ICU admission, each comprising approximately equal patient numbers (Q1: 295, Q2–Q4: 294 each). Baseline demographics, vital signs, laboratory values, and therapeutic interventions stratified by LDAR quartiles are presented in Table 1. Overall, patients in the highest LDAR quartile (Q4) exhibited greater illness severity. Patients in Q4 were slightly younger on average compared to those in Q1 (mean age 66.96 vs. 69.66 years; P = 0.004), while sex distribution did not differ significantly across LDAR quartiles (male proportion approximately 60%, P = 0.122). Disease severity increased consistently with higher LDAR, as evidenced by significantly elevated mean SAPS II scores (Q1: 40.35 ± 13.21 vs. Q4: 54.57 ± 16.49) and SOFA scores (Q1: 1.82 ± 2.33 vs. Q4: 3.21 ± 2.90; both P < 0.001). Regarding LDAR components, serum LDH levels were markedly elevated in Q4 (mean 1958.6 U/L) compared to Q1 (175.3 U/L), while Alb levels decreased correspondingly (Q4: 2.62 g/dL vs. Q1: 3.21 g/dL; both P < 0.001). Markers indicative of inflammation and impaired organ function were significantly elevated in the high LDAR group, including BUN (Q4: 40.0 vs. Q1: 26.7 mg/dL) and creatinine (Q4: 1.73 vs. Q1: 1.22 mg/dL), alongside increased white blood cell counts (Q4: 17.3 vs. Q1: 11.6 × 10⁹/L; all P < 0.001). Conversely, patients in Q4 exhibited lower mean body temperature (36.58 °C vs. 36.79°C; P = 0.018) and peripheral oxygen saturation (SpO₂: 96.2% vs. 97.1%; P < 0.001), suggesting potential tissue hypoperfusion and impaired oxygenation. Furthermore, the demand for organ support was significantly higher among patients in Q4: vasopressor use was more frequent (42.9% vs. 25.1% in Q1; P < 0.001), and CRRT was utilized at higher rates (11.2% vs. 1.4% in Q1; P < 0.001). Mechanical ventilation was also numerically more common in Q4 (82.0% vs. 73.6% in Q1), though this difference did not reach statistical significance (P = 0.065). Additionally, the prevalence of metastatic solid tumors was substantially higher in the Q4 group (73.1% vs. 50.5% in Q1; P < 0.001). In summary, higher LDAR values at ICU admission were consistently associated with increased disease severity, marked nutritional impairment, pronounced organ dysfunction, and a significantly higher prevalence of metastatic disease.
Baseline characteristics of the study population stratified by LDAR quartiles (Q1–Q4).

Baseline characteristics of patients stratified by quartiles of LDAR, based on data from the MIMIC-IV database. Data are presented as mean (SD) for continuous variables or as number (percentage [%]) for categorical variables. Comparisons across LDAR quartiles (Q1–Q4) were assessed using one-way ANOVA for normally distributed continuous variables, and the Chi-square test for categorical variables. LDAR: lactate dehydrogenase-to-albumin ratio; SD: standard deviation; ICU: intensive care unit; SOFA: Sequential Organ Failure Assessment; SAPS II: Simplified Acute Physiology Score II; SpO2: peripheral oxygen saturation; PaO2: partial pressure of arterial oxygen; MIMIC: Medical Information Mart for Intensive Care IV; ANOVA: analysis of variance.
Statistical significance was set at P < 0.05 (two-sided).
Multivariable logistic regression analysis
Multivariable logistic regression was conducted to assess the independent association between LDAR at ICU admission and short-term outcomes. As summarized in Table 2 and illustrated in Figure 2, increasing LDAR quartiles were significantly associated with stepwise elevations in the odds of 28-day, ICU, and in-hospital mortality. LDAR was categorized into quartiles, with Q1 (the lowest quartile) serving as the reference group. A clear dose–response relationship was observed, wherein higher LDAR quartiles corresponded to progressively increased mortality risk. In unadjusted models, patients in the highest LDAR quartile (Q4) exhibited over six-fold increased odds of mortality compared to those in Q1 across all outcomes (e.g., unadjusted OR for ICU mortality in Q4 = 8.62; 95% CI: 5.33–14.59; P < 0.001). The multivariable model was adjusted for age, sex, weight, heart rate, MAP, respiratory rate, SpO₂, body temperature, SOFA score, and the presence of metastatic solid tumors. After adjustment, the association between LDAR and mortality remained statistically significant. Compared with Q1, adjusted ORs for 28-day mortality were 1.90 (95% CI: 1.32–2.74) in Q2, 2.56 (95% CI: 1.78–3.69) in Q3, and 5.15 (95% CI: 3.52–7.61) in Q4 (all P < 0.001). For ICU mortality, the adjusted OR for Q4 was 6.54 (95% CI: 3.91–11.38), and for in-hospital mortality it was 5.99 (95% CI: 3.98–9.16), both with P < 0.001. A significant linear trend across LDAR quartiles was observed (P for trend < 0.001), further confirming LDAR as an independent predictor of both short-term and in-hospital mortality. In addition to LDAR, several other covariates demonstrated significant associations. Male sex was modestly associated with higher 28-day mortality (adjusted OR = 1.45; 95% CI: 1.11–1.91; P = 0.0077), although the clinical significance of this small magnitude increase may be limited. Higher heart rate (OR ≈ 1.01 per beat/min; P = 0.002) and lower MAP (OR ≈ 0.99/mmHg; P = 0.011) were also independently associated with mortality risk. Additional contributing variables included elevated respiratory rate (P = 0.006) and lower body temperature (P = 0.018). Each 1-point increase in SOFA score was associated with a 12% increase in the odds of 28-day mortality (OR = 1.113; 95% CI: 1.06–1.17; P < 0.001). The presence of metastatic solid tumors conferred a 2.51-fold increased risk (P < 0.001). Notably, age did not remain statistically significant in the adjusted model (P > 0.05), suggesting that LDAR may serve as a more sensitive indicator of early mortality risk than age in this population. Collectively, the findings underscore LDAR as a robust and independent prognostic factor, with predictive power beyond traditional severity scores and clinical covariates.

Forest plot of ORs for 28-day, ICU, and in-hospital mortality according to LDAR quartiles. This figure illustrates the association between LDAR quartiles and mortality outcomes (28-day mortality, ICU mortality, and in-hospital mortality), based on multivariable logistic regression. Patients were stratified into four LDAR quartile groups (Q1–Q4), with Q1 (lowest LDAR) as the reference. Squares represent the estimated ORs, and horizontal lines indicate 95% CIs, plotted on a logarithmic scale. All models were adjusted for age, sex, SOFA score, metastatic tumor status, and vital signs at ICU admission (heart rate, mean arterial pressure, temperature, respiratory rate), as well as laboratory markers such as BUN and WBC count. In all models, higher LDAR quartiles were independently associated with significantly increased mortality risk, demonstrating a strong dose–response relationship (P for trend < 0.001). For example, in 28-day mortality, the adjusted OR for Q4 vs. Q1 was approximately 5.15 (95% CI: 3.52–7.61). Similar associations were observed for ICU and in-hospital mortality. Other clinical covariates also showed significant associations and are displayed alongside LDAR for contextual comparison. These findings support LDAR as a robust and independent predictor of short-term mortality in critically ill patients with gastrointestinal malignancies. LDAR: lactate dehydrogenase-to-albumin ratio; OR: odds ratio; CI: confidence interval; ICU: intensive care unit; SOFA: Sequential Organ Failure Assessment; Q1/Q4: first/fourth quartile; BUN: blood urea nitrogen.
Association between LDAR quartiles and clinical outcomes (odds ratios from logistic regression models).

Data are presented as ORs with corresponding 95% CIs derived from logistic regression models. Model 1 represents crude (unadjusted) logistic regression analyses. Model 2 represents fully adjusted logistic regression analyses, controlling for the following covariates: age (per year increase), sex (male vs. female), weight (per kg increase), heart rate (beats/min), MAP (per mm Hg increase), respiratory rate (breaths/min), peripheral oxygen saturation (SpO2, per % increase), body temperature (per °C increase), SOFA score, and presence of metastatic solid tumor (yes vs. no). Statistical significance was set at P < 0.05 (two-sided). All analyses were based on data from the MIMIC-IV database. LDAR: lactate dehydrogenase-to-albumin ratio; ICU: intensive care unit; OR: odds ratio; CI: confidence interval; SOFA: Sequential Organ Failure Assessment; SpO2: peripheral oxygen saturation; MAP: mean arterial pressure; MIMIC: Medical Information Mart for Intensive Care IV.
Nonlinear association: Restricted cubic spline analysis
Given the right-skewed distribution of LDAR, a log₂ transformation was performed prior to model fitting. A RCS regression was subsequently applied to examine the potential nonlinear association between LDAR and 28-day mortality. As shown in Figure 3, the analysis identified a significant nonlinear positive relationship between log₂(LDAR) and the estimated probability of 28-day mortality (nonlinearity test, P < 0.01). The risk increased slowly at lower LDAR levels and rose steeply beyond a log₂(LDAR) value of approximately 5.314, suggesting a dose-dependent effect without a clear threshold for prognostic safety. Even small elevations in LDAR were associated with incremental risk, while higher values corresponded to a disproportionately sharp rise in mortality probability. The 95% confidence intervals widened toward both tails of the distribution, indicating increased uncertainty at extreme LDAR values. The superimposed histogram, plotted on the secondary Y-axis, depicts the frequency distribution of log₂ (LDAR) within the cohort, confirming sufficient sample representation across the exposure range. These findings support modeling LDAR as a continuous covariate while accommodating its nonlinear functional form in mortality risk prediction.

Nonlinear relationship between log2-transformed LDAR and 28-day mortality (RCS analysis). This figure illustrates the nonlinear dose–response association between the LDAR and 28-day mortality, modeled using a multivariable logistic regression framework with RCS functions. LDAR was log2-transformed to correct for right-skewed distribution. The solid red curve indicates the adjusted predicted probability of 28-day mortality as a function of log2(LDAR), and the shaded area represents the 95% CI. The model was adjusted for age, sex, BMI, heart rate, respiratory rate, MAP, temperature, SpO2, SOFA score, comorbidities, and infection site. A significant nonlinear relationship was observed (P for nonlinearity < 0.001). An inflection point was identified at log2(LDAR) = 5.314, corresponding to an LDAR of approximately 40. Beyond this threshold, the mortality probability increased steeply, indicating a dose-dependent effect without evidence of saturation. The histogram below the curve shows the distribution of log2(LDAR) in the study population, confirming adequate sample density in the high-risk range. The dashed horizontal line marks a 50% mortality probability. These findings suggest that LDAR is continuously associated with risk of death and that the risk escalates rapidly once LDAR exceeds ∼40, supporting its utility as a continuous prognostic biomarker. LDAR: lactate dehydrogenase-to-albumin ratio; CI: confidence interval; RCS: restricted cubic spline; SOFA: Sequential Organ Failure Assessment; SpO2: peripheral oxygen saturation; BMI: body mass index; MAP: mean arterial pressure.
Kaplan–Meier survival analysis
To further assess the stratified prognostic effect of LDAR, 28-day survival was analyzed across LDAR quartiles using the Kaplan–Meier method. As shown in Figure 4, survival curves were distinctly separated among the four groups (log-rank test, P < 0.0001). Patients in the lowest quartile (Q1) consistently exhibited the highest cumulative survival probability throughout the 28-day period, whereas those in the highest quartile (Q4) showed substantially lower survival. Differences in survival emerged early after ICU admission, with more rapid accumulation of death events in the Q4 group during the first week. By day 28, the survival probability in Q4 was markedly lower than that in Q1, and the median survival time was also significantly shorter in Q4 compared to lower LDAR quartiles. Overall, the Kaplan–Meier analysis provided visual and statistical evidence of a strong inverse association between LDAR and short-term survival, indicating that elevated LDAR at ICU admission was associated with substantially increased 28-day mortality risk.
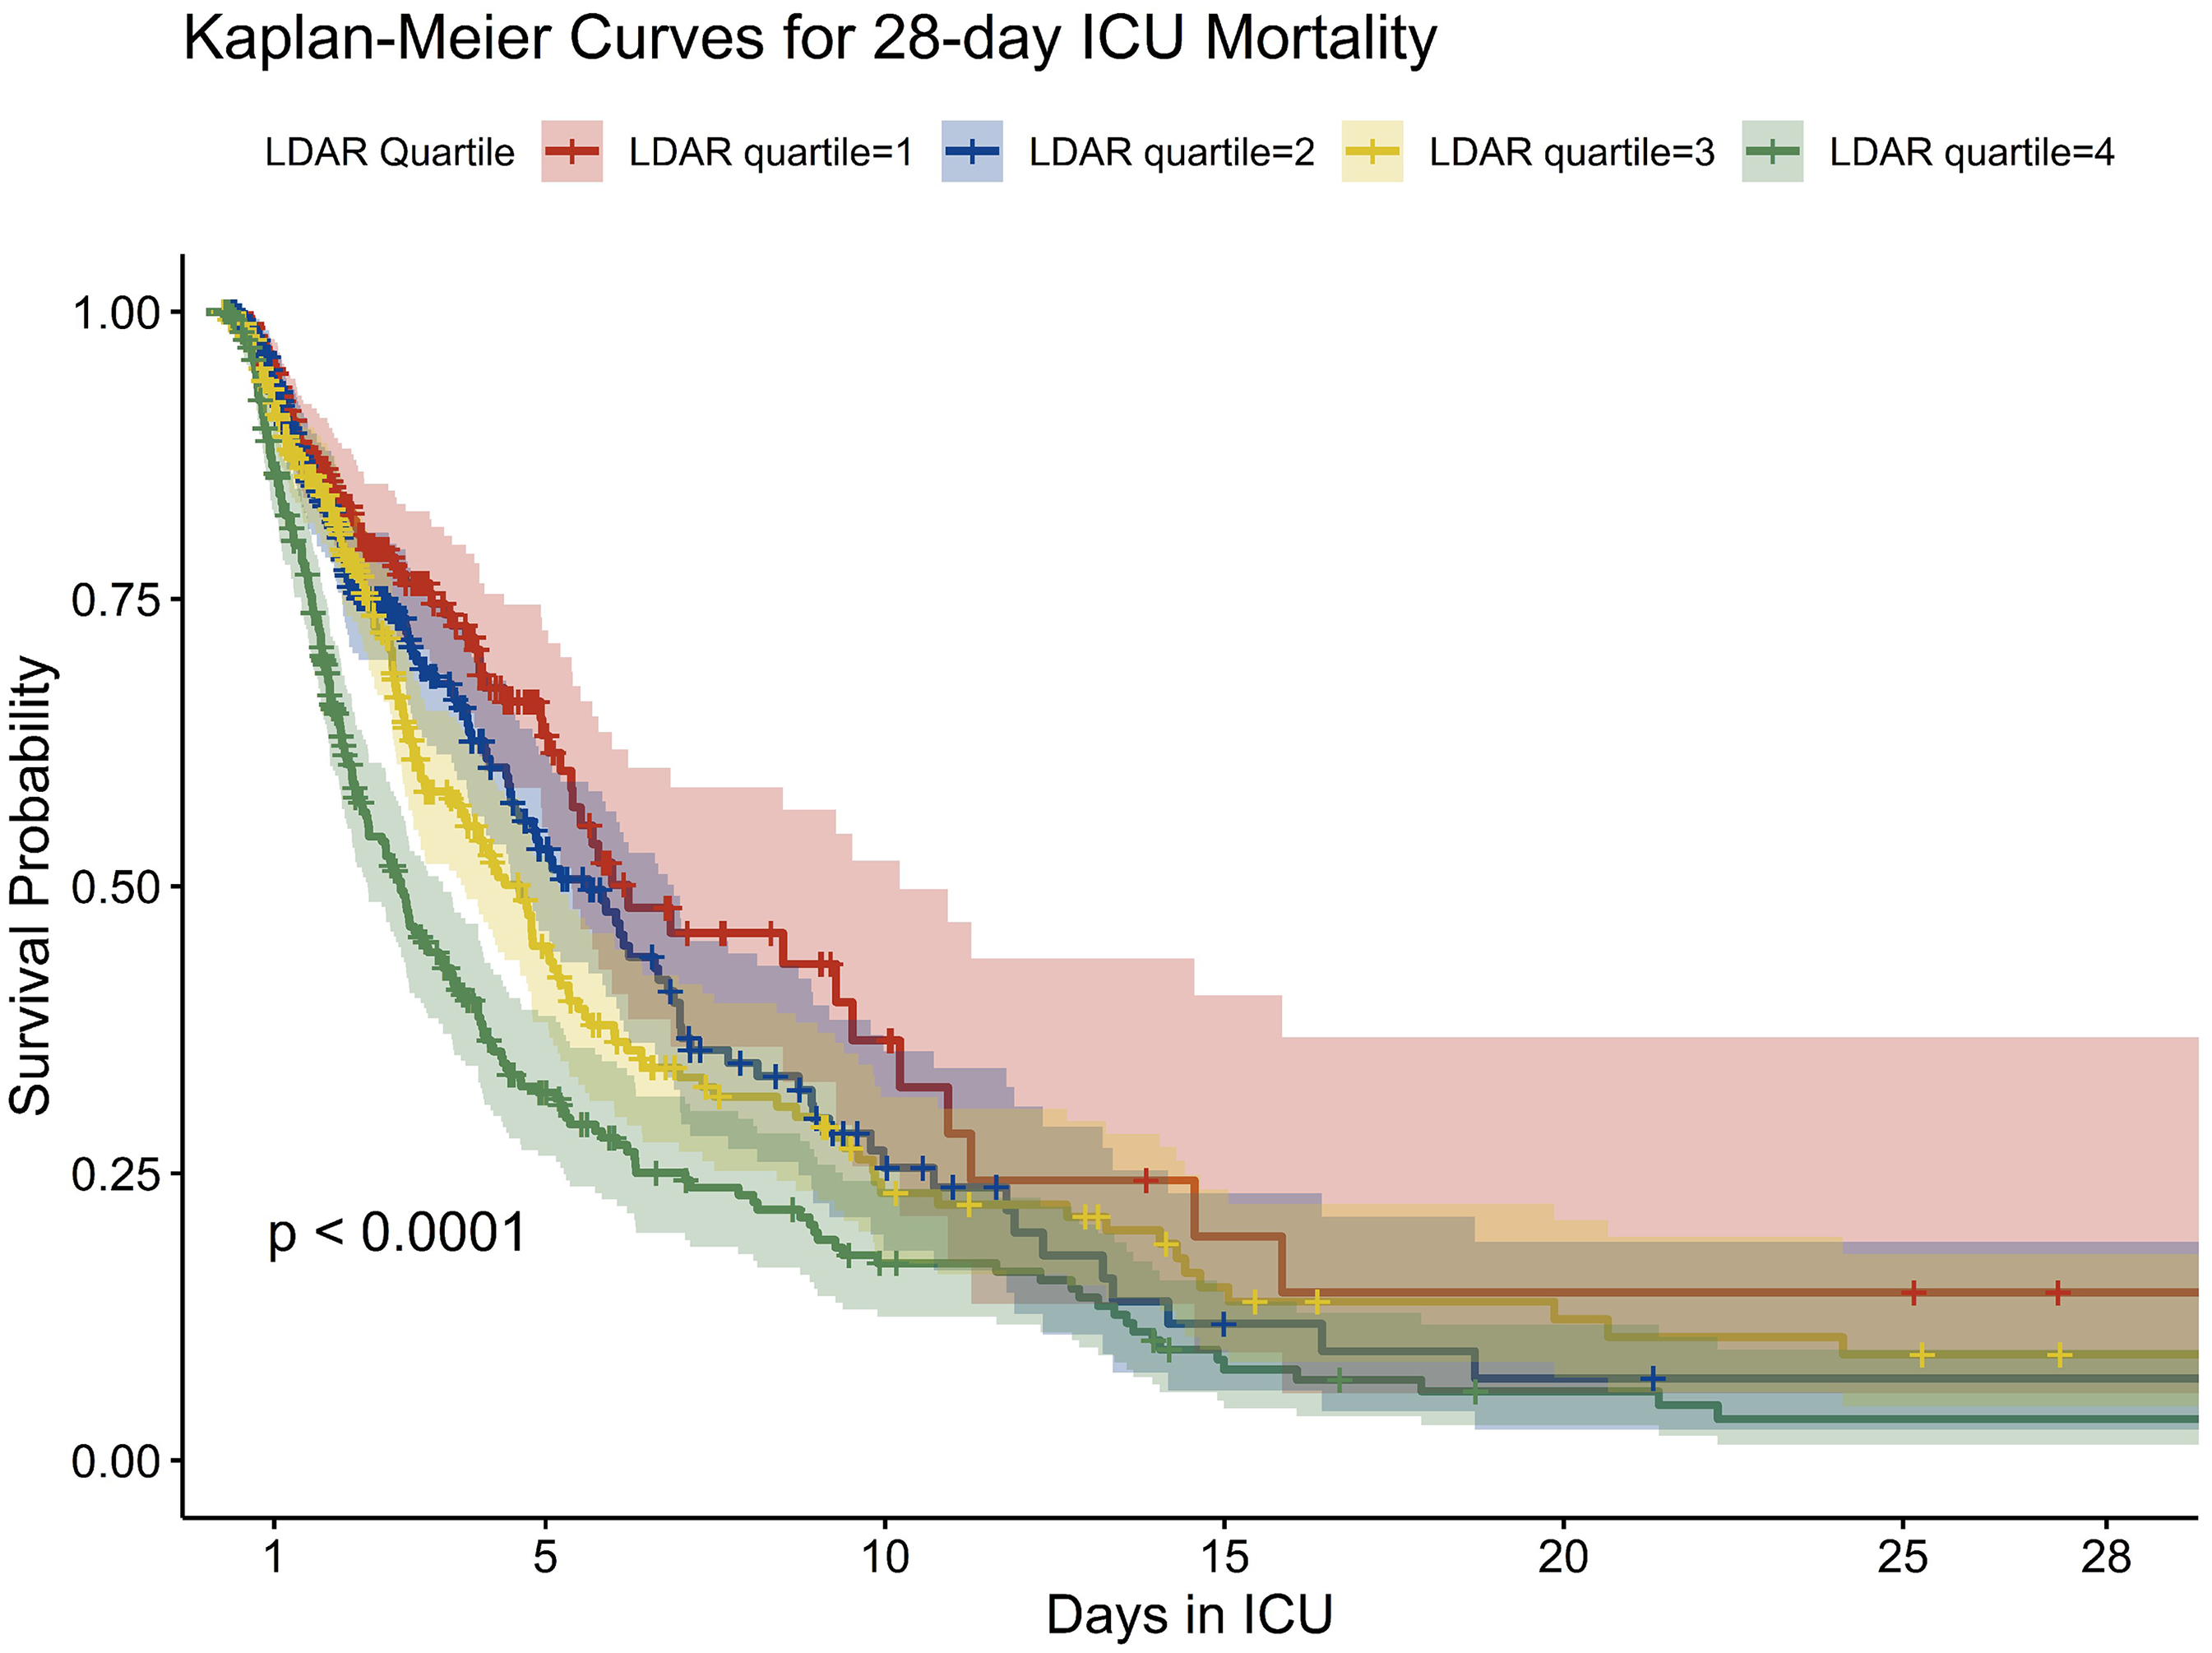
Kaplan–Meier survival curves stratified by LDAR quartiles. This figure illustrates 28-day survival probabilities across quartiles of the LDAR measured at ICU admission. Patients were grouped into quartiles (Q1–Q4), with Q1 indicating the lowest LDAR and Q4 the highest. The x-axis represents days since ICU admission (up to 28 days), and the y-axis indicates survival probability. Each colored curve represents a Kaplan–Meier estimate of survival for a respective LDAR quartile, with shaded areas denoting 95% confidence intervals. Censoring events are marked with vertical ticks. The survival curves diverged early, with Q4 patients exhibiting significantly lower survival throughout the observation period. By day 28, the survival probability in Q4 had declined to approximately 50%, compared to over 70% in Q1. The log-rank test indicated a statistically significant difference across quartiles (P < 0.0001), supporting LDAR as a stratified risk marker. These findings suggest that elevated LDAR is consistently associated with worse short-term survival in critically ill patients with gastrointestinal malignancies. LDAR: lactate dehydrogenase-to-albumin ratio; ICU: intensive care unit; Q1/Q4: first/fourth quartile.
To validate the robustness of LDAR as a prognostic biomarker across subgroups with differing disease burdens, patients were further stratified based on metastatic status. As shown in Table 3, individuals with metastatic solid tumors exhibited significantly higher LDAR values (median 12.33 [IQR 7.63–23.48] vs. 9.36 [6.76–14.80]; P < 0.001), lower Alb levels, and markedly elevated in-hospital and 28-day ICU mortality compared to patients without metastases (28-day ICU mortality: 56.9% vs. 35.6%; P < 0.001). These findings underscore the biological plausibility of LDAR as a composite marker reflecting tumor burden and systemic nutritional-inflammatory status. Importantly, the prognostic discriminative performance of LDAR remained consistent irrespective of metastatic status, further supporting its clinical utility as a stable, generalizable predictor of short-term mortality in critically ill patients with GI malignancies. This pattern is consistent with the propensity of GI cancers for hepatic involvement, which simultaneously elevates LDH and impairs Alb synthesis, thereby widening LDAR.20,30 Subgroup estimates were consistent with the primary analysis (Supplemental Table S2); no significant LDAR × metastatic interaction (P_interaction = 0.084) and borderline heterogeneity by infection site (P_interaction = 0.051).
Clinical characteristics and outcomes stratified by metastatic solid tumor status.

Data are presented as median (Q1, Q3) for continuous variables and number (%) for categorical variables. Comparisons between nonmetastatic and metastatic groups were performed using the Mann–Whitney U test for continuous variables (due to non-normal distribution) and the chi-square test for categorical variables. Statistical significance was defined as P < 0.05 (two-sided). Data were obtained from the MIMIC-IV database. LDAR: lactate dehydrogenase-to-albumin ratio; LDH: lactate dehydrogenase; ICU: intensive care unit; Q1: first quartile (25th percentile); Q3: third quartile (75th percentile); MIMIC: Medical Information Mart for Intensive Care IV.
Feature selection using the Boruta algorithm
To identify key predictors of 28-day mortality within a high-dimensional clinical feature space, the Boruta algorithm was applied for variable importance assessment (Figure 5). This method evaluated a wide range of candidate variables, including demographic characteristics, laboratory results, clinical interventions, and severity scores. Among all features, the SAPS II exhibited the highest predictive importance, confirming its role as a strong composite indicator of disease severity. The LDAR was ranked second in overall importance, immediately following SAPS II, and was recognized as a core predictor within the model. Although this ranking slightly differed from a previous study by Shen et al., in which LDAR was ranked first, both analyses consistently underscored its prognostic relevance in short-term mortality. Other variables identified as important predictors included LDH, BUN, total bilirubin, ALP, coagulation parameters (e.g., prothrombin time and APTT), as well as indicators of inflammation and physiological instability such as neutrophil count, heart rate, and respiratory rate. In contrast, several chronic comorbidities (e.g., diabetes, cerebrovascular disease, and chronic pulmonary disease) were not retained as relevant predictors by the Boruta algorithm. These results suggest that acute physiological derangements and laboratory abnormalities at ICU admission are more influential in determining short-term mortality than pre-existing chronic conditions. The strong and consistent importance of LDAR in this analysis supports its value as an integrated, readily available biomarker for early risk stratification in critically ill patients.
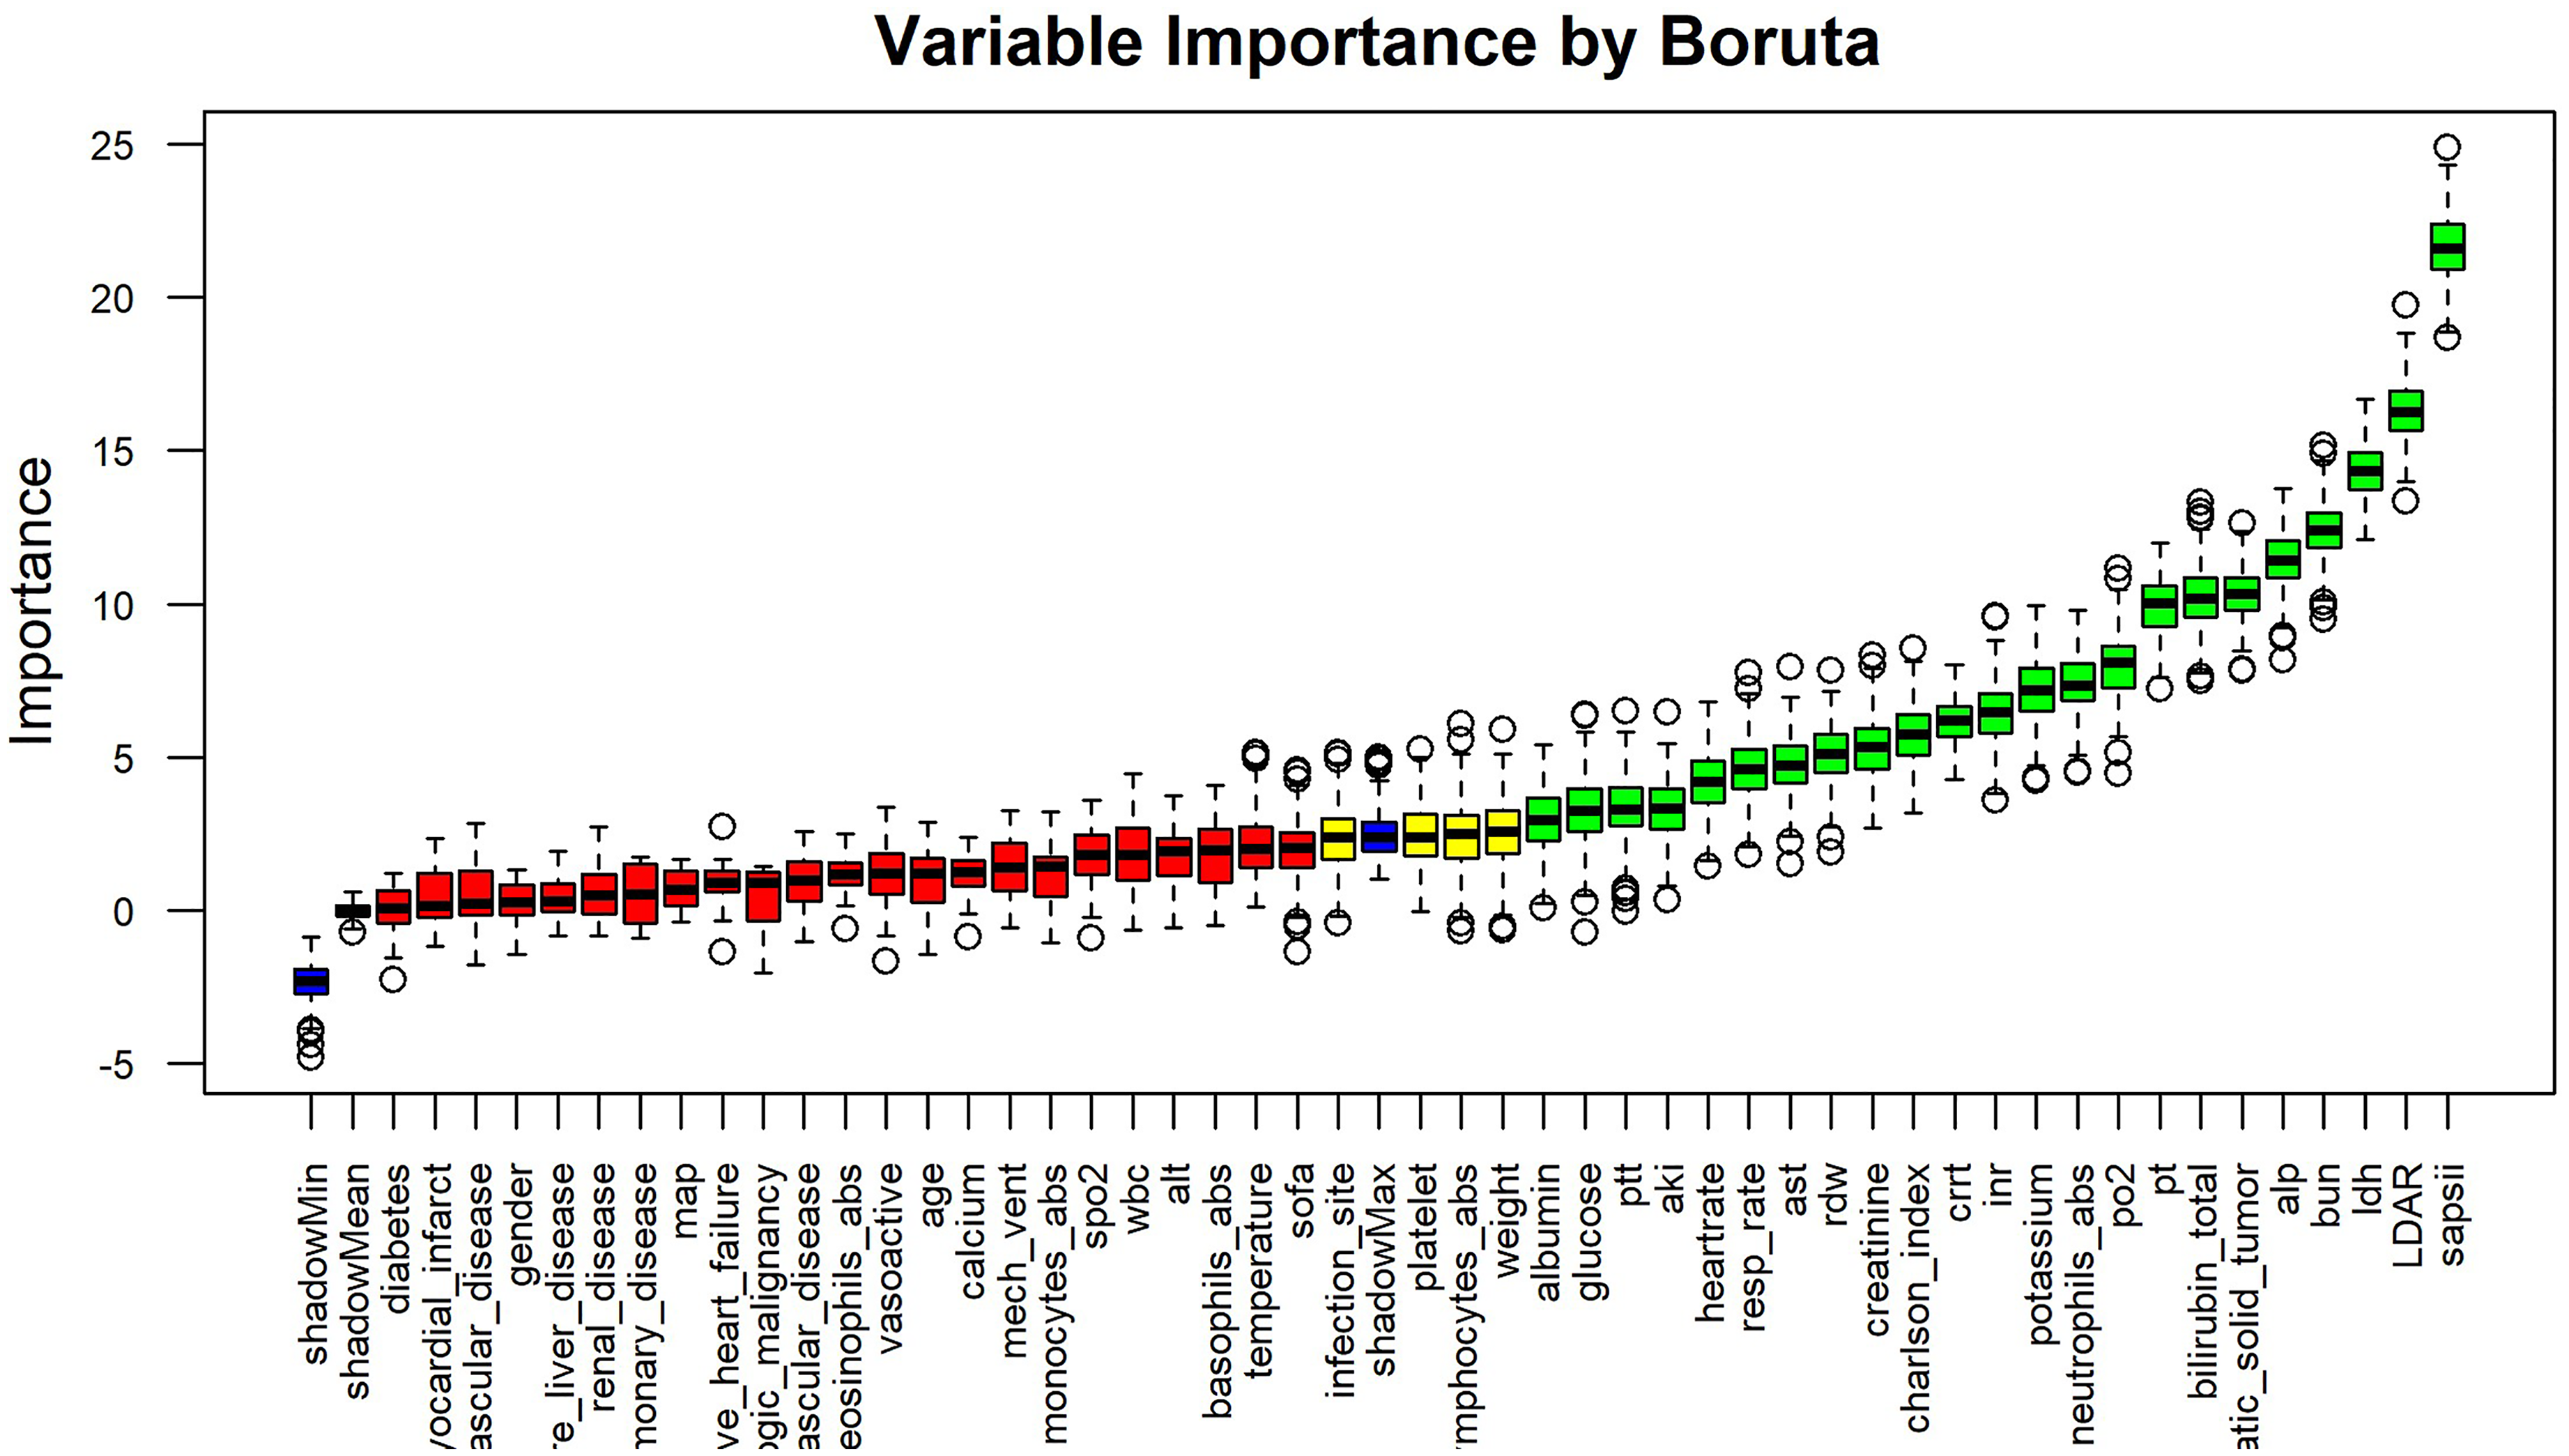
Variable importance ranking based on Boruta feature selection. This figure displays the results of the Boruta algorithm—a wrapper built around random forest—for identifying predictors of 28-day mortality in critically ill patients with gastrointestinal malignancies. Each boxplot represents the distribution of Z-scores (based on mean decrease in accuracy) for a candidate variable across multiple iterations. Features are ordered left to right by decreasing median importance. Boruta determines importance by comparing real features to randomly permuted “shadow” features. Color coding indicates selection status: green = important, yellow = tentative, red = unimportant, blue = shadow features. Among all variables, SAPS II had the highest importance, followed by LDAR, which ranked second overall—outperforming individual components LDH and albumin. Other top features (green) included BUN, LDH, total bilirubin, ALP, PT, APTT, neutrophil count, respiratory rate, and heart rate. Many chronic comorbidities (e.g., diabetes, cerebrovascular disease) were not retained (red), indicating limited short-term predictive value. Boruta: random forest–based feature selection algorithm; SAPS II: Simplified Acute Physiology Score II; LDAR: lactate dehydrogenase-to-albumin ratio; LDH: lactate dehydrogenase; BUN: blood urea nitrogen; ALP: alkaline phosphatase; PT: prothrombin time; APTT: activated partial thromboplastin time.
Model performance: ML comparison
To evaluate the prognostic utility of LDAR and related variables in predicting 28-day mortality, a series of ML models were constructed. As illustrated in Figure 6(a), most models demonstrated at least moderate discriminative ability across both ensemble algorithms and conventional classifiers. Among them, the AdaBoost ensemble yielded the highest predictive performance, with an AUC of 0.835 (95% CI: 0.784–0.886). The XGBoost model followed (AUC = 0.825), while both the LightGBM and ridge logistic regression models achieved AUCs of 0.824. These four models showed comparable discrimination (AUC ≈ 0.82–0.84), indicating excellent classification ability. The random forest model had a slightly lower AUC of 0.804 but still outperformed most traditional approaches. The SVM (RBF kernel) and KNNs both achieved AUCs around 0.79, indicating moderate performance. In contrast, the Gaussian naïve Bayes model yielded an AUC of 0.763. Notably, the simple MLP neural network failed to converge effectively during training and showed poor performance in the validation set (AUC ≈ 0.50), potentially due to limited sample size or suboptimal optimization. In addition, ridge logistic regression was included as a baseline comparator and demonstrated competitive performance (AUC = 0.824). Detailed parameter estimates for this model are provided in Table 2. Overall, models incorporating LDAR provided reasonably accurate predictions of 28-day mortality, with ensemble methods such as AdaBoost and XGBoost outperforming others. These findings suggest that incorporating LDAR into data-driven algorithms enhances short-term risk stratification compared with conventional scoring systems.
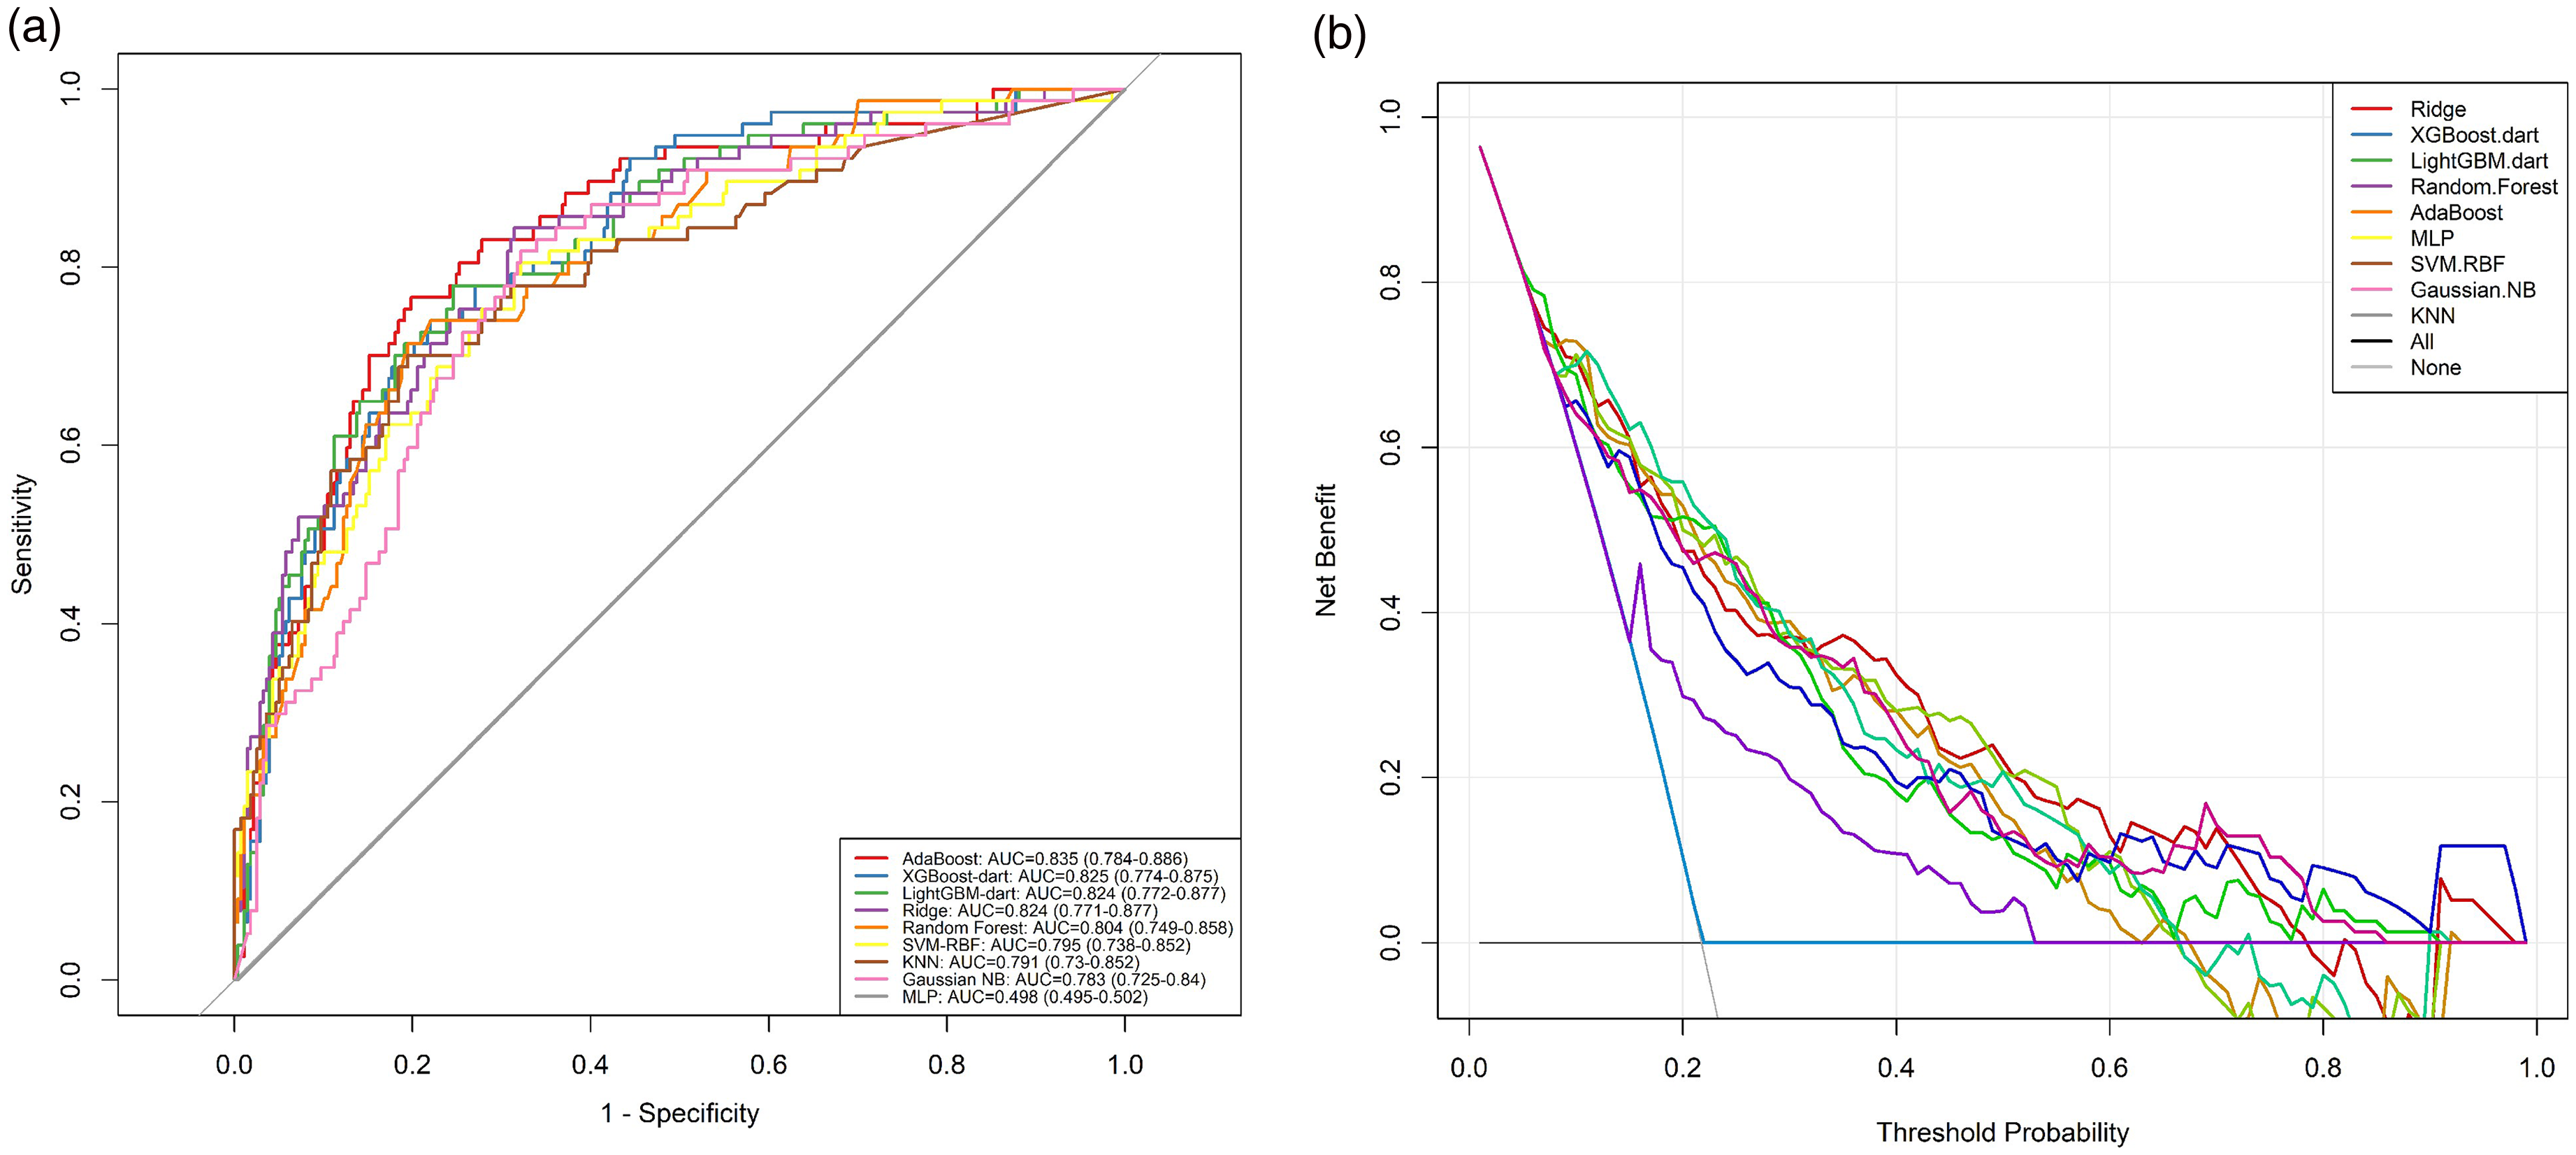
Discrimination and clinical utility of machine learning models for predicting 28-day mortality. (a) ROC curves for nine classification models trained to predict 28-day mortality in ICU patients with gastrointestinal malignancies. Models include AdaBoost, XGBoost-dart, LightGBM-dart, Random Forest, Ridge logistic regression, SVM-RBF, KNN, Gaussian naïve Bayes (Gaussian NB), and MLP. Curves plot sensitivity vs. 1—specificity. The diagonal line (gray) represents chance (AUC = 0.50). Most models achieved moderate-to-high discrimination (AUCs ≥ 0.75), with AdaBoost showing the best performance (AUC = 0.835; 95% CI: 0.784–0.886), followed closely by XGBoost (0.825), LightGBM (0.824), and Ridge logistic regression (0.824). The MLP model performed poorly (AUC ≈ 0.50), likely due to training limitations on this dataset. (b) DCA demonstrating the net clinical benefit of each model across a range of decision thresholds. Net benefit is plotted on the y-axis versus threshold probability on the x-axis. Dashed lines represent reference strategies: “Treat All” (magenta) and “Treat None” (black). The AdaBoost model exhibited the highest net benefit across a broad threshold range (10%–50%), suggesting superior clinical utility for identifying high-risk patients who may benefit from intervention. XGBoost and LightGBM also demonstrated strong performance, with net benefit curves closely paralleling that of AdaBoost. All machine learning models outperformed default strategies in the clinically relevant threshold range, except the underperforming MLP. These findings suggest that incorporating LDAR and related clinical features into ensemble machine learning frameworks—particularly AdaBoost—can meaningfully enhance both discrimination and decision-making in the ICU setting. AUC: area under the curve; ROC: receiver operating characteristic; DCA: decision curve analysis; LDAR: lactate dehydrogenase-to-albumin ratio; SVM-RBF: support vector machine with radial basis function kernel; KNN: k-nearest neighbors; NB: naïve Bayes; MLP: multilayer perceptron; ICU: intensive care unit.
Decision curve analysis
To evaluate the clinical utility of the prediction models, DCA was performed to assess the net benefit across a range of threshold probabilities (Figure 6(b)). The DCA curves indicated that, within a wide threshold interval (approximately 10%–50%), applying ML models—such as AdaBoost or XGBoost—yielded higher net benefit compared with the default strategies of treating all or treating none. Specifically, the AdaBoost model demonstrated the highest or near-highest net benefit across most thresholds, suggesting that clinical decisions informed by this model could reduce both overtreatment and undertreatment. In the low-risk range (thresholds between 10% and 30%), the net benefit of AdaBoost and XGBoost exceeded that of other models. At intermediate thresholds (30%–50%), the performance of the top models converged, with all clearly outperforming the default strategies. The decision curves for ridge logistic regression and random forest were slightly lower than those of AdaBoost but remained above the treat-all and treat-none lines, indicating meaningful benefit. Overall, the DCA supported the potential clinical value of LDAR-based ML models in guiding early intervention decisions. In critically ill patients with GI malignancies, model-informed risk prediction may facilitate more effective and individualized clinical management.
Model interpretation: SHAP analysis
To elucidate the decision process of the best-performing model (AdaBoost), SHAP were used to quantify the impact and direction of each variable on predicted 28-day mortality risk (Figure 7). The SHAP summary plot ranked features by their average absolute contribution to model output. Among all predictors, SAPS II showed the highest overall importance, with the widest SHAP value distribution, indicating its consistent influence across patients. LDH, the use of CRRT, and LDAR followed closely, reinforcing their substantial contributions to the model's mortality prediction. LDAR, as an input variable, exhibited a predominantly positive SHAP distribution, with higher values (depicted in red) associated with increased predicted mortality risk, while lower values (blue) were linked to reduced risk. This pattern was consistent with findings from logistic regression analysis. In addition to LDAR, other influential features included SAPS II, LDH, CRRT, and coagulation markers such as APTT, all associated with positive SHAP values. Variables such as heart rate, respiratory rate, BUN, serum potassium, and glucose also contributed meaningfully, particularly when abnormal. These features tended to produce positive SHAP values, suggesting that physiological derangements in these parameters were linked to higher mortality predictions. Conversely, chronic comorbidity indicators such as the Charlson Comorbidity Index and metastatic solid tumor status appeared near the bottom of the SHAP ranking, suggesting relatively minor influence on short-term risk prediction compared to acute physiological and biochemical variables. Overall, the SHAP analysis confirmed the clinical plausibility of the model's outputs. The model's reliance on LDAR and other established clinical indicators supported the interpretability and transparency of AdaBoost predictions, reinforcing its potential value in clinical decision-making rather than functioning as a “black box.”

SHAP summary plot showing feature contributions to 28-day mortality predictions in the AdaBoost model. This figure presents the SHAP summary plot for the AdaBoost model trained to predict 28-day mortality. Each row represents a model feature, ordered top-down by its overall importance (mean absolute SHAP value). Each point corresponds to an individual patient's SHAP value for that feature, indicating the direction and magnitude of its impact on the predicted log-odds of mortality. Color reflects the feature value: red indicates higher values, and blue lower values. Features with red points clustering on the right (positive SHAP) increase predicted mortality risk; those with blue points on the left suggest protective effects. Notably, SAPS II ranked highest, followed by LDH, CRRT, and LDAR. LDAR exhibited a strong right-skew pattern: higher values were associated with increased predicted risk, consistent with its biological role as a marker of tissue injury and malnutrition. Other key contributors included coagulation markers (e.g., PTT), vital signs (heart rate, respiratory rate), and metabolic variables (BUN, glucose, potassium). In contrast, chronic comorbidities such as metastatic tumor status and Charlson Index had lower importance. Overall, this plot supports the clinical interpretability of the model, demonstrating that LDAR is among the top predictors of short-term mortality and aligns with established pathophysiology. SHAP: Shapley additive explanations; LDAR: lactate dehydrogenase-to-albumin ratio; SAPS II: Simplified Acute Physiology Score II; LDH: lactate dehydrogenase; CRRT: continuous renal replacement therapy; PTT: partial thromboplastin time; BUN: blood urea nitrogen.
Comparison with other prognostic indicators
To further evaluate the predictive performance of LDAR, its discriminative ability was systematically compared with conventional ICU scoring systems and inflammation-nutrition-related indices (Figure 8). For 28-day ICU mortality (Figure 8(a)), LDAR yielded an area under the receiver operating characteristic curve (AUC) of 0.700, indicating good discrimination. Its performance surpassed that of several commonly used indicators, including the SOFA score (AUC = 0.636), PNI (AUC = 0.606), SIRI (AUC = 0.628), and SII (AUC = 0.574). In contrast, the SAPS II score achieved the highest AUC among all single measures (AUC = 0.718), but its advantage over LDAR was limited to approximately 1.8 percentage points. Notably, the predictive performance of LDAR approached that of SAPS II and was clearly superior to that of simplified or inflammation-based indices, suggesting its potential competitiveness in clinical application. Similar findings were observed for in-hospital mortality (Figure 8(b)), where LDAR achieved an AUC of 0.710, outperforming SOFA (0.657), PNI (0.585), SIRI (0.608), and SII (0.538), and closely approximating SAPS II (0.719). Overall, LDAR—calculated from routine laboratory parameters—demonstrated stable and favorable discriminative capacity for short-term mortality in critically ill cancer patients. Its performance exceeded that of traditional inflammation and nutrition scores and was comparable to that of comprehensive physiologic scoring systems such as SAPS II. Prespecified operating points for LDAR (≥Q2, ≥Q3, ≥Q4) with the corresponding 2 × 2 confusion matrices and diagnostic characteristics are reported in Supplementary Table S1. Given its ease of measurement, low cost, and clinical accessibility, LDAR may serve as a practical alternative or adjunct to conventional prognostic tools for early risk stratification in the ICU setting.

Comparison of LDAR with established prognostic indices for mortality prediction. This figure compares the predictive performance of the LDAR against conventional scoring systems and inflammation/nutrition-based indices in predicting (a) 28-day ICU mortality and (b) in-hospital mortality. ROC curves were constructed for each variable used as a single predictor in logistic regression. LDAR (blue) achieved an AUC of 0.700 for ICU mortality and 0.710 for in-hospital mortality, surpassing the Sequential Organ Failure Assessment (SOFA; AUCs 0.636 and 0.657), PNI (0.606 and 0.585), SIRI (0.628 and 0.608), and SII (0.574 and 0.538). The Simplified Acute Physiology Score II (SAPS II; green) had the highest AUC in both panels (0.718 and 0.719), but the margin over LDAR was minimal (∼0.01–0.02). These results highlight that LDAR—a simple, unitless ratio derived from two routinely measured parameters (LDH and albumin)—delivers prognostic discrimination comparable to a complex composite score, and consistently outperforms widely used inflammatory and nutritional indices. Its simplicity, cost-efficiency, and clinical relevance suggest that LDAR may serve as a practical early risk stratification tool in oncologic ICU populations. ROC: receiver operating characteristic; AUC: area under the curve; LDAR: lactate dehydrogenase-to-albumin ratio; SAPS II: Simplified Acute Physiology Score II; SOFA: Sequential Organ Failure Assessment; PNI: Prognostic Nutritional Index; SIRI: Systemic Inflammation Response Index; SII: Systemic Immune-Inflammation Index; ICU: intensive care unit.
Discussion
A large cohort of ICU patients with GI malignancies was constructed based on the MIMIC-IV database to evaluate the prognostic value of the LDAR for short-term mortality. The analysis demonstrated a significant association between elevated LDAR and increased 28-day mortality, suggesting a correlation with disease severity. After adjusting for age, sex, metastatic status, and SOFA score, LDAR remained an independent predictor of 28-day mortality (all adjusted ORs > 1, P < 0.001). RCS modeling identified a notable inflection point at log₂(LDAR) ≈ 5.314 (corresponding to LDAR ≈ 40), beyond which mortality risk increased sharply in a nonlinear manner (Figure 3), indicating a significant nonlinear dose-response relationship. Kaplan–Meier analysis showed that patients in the highest LDAR quartile had a 28-day survival rate of approximately 35%, markedly lower than the 73% observed in the lowest quartile, revealing a pronounced difference in survival probability across LDAR strata. Boruta feature selection ranked LDAR among the most important predictors, comparable to SAPS II and BUN, highlighting its unique and substantial contribution to outcome prediction. Nine ML models were developed, with random forest, AdaBoost, and XGBoost performing best, yielding AUCs between 0.80 and 0.84 for 28-day mortality. DCA further confirmed that including LDAR in the models resulted in a meaningful net clinical benefit across a wide range of threshold probabilities. SHAP analysis corroborated the strong contribution of LDAR within the model, demonstrating a consistent positive association with predicted mortality risk. In addition, LDAR was compared directly with conventional ICU severity scores. ROC analysis revealed that LDAR achieved AUCs of 0.700 and 0.710 for predicting 28-day ICU and in-hospital mortality, respectively—exceeding SOFA scores (0.636 and 0.657) and closely approaching SAPS II (0.718 and 0.719). These findings support the clinical utility of LDAR as a simple, laboratory-based index with prognostic power comparable to established complex scoring systems. Taken together, LDAR emerged as a robust, independent, and interpretable predictor of short-term mortality in critically ill patients with GI malignancies. It demonstrated a clear nonlinear threshold effect and significantly enhanced the accuracy and clinical utility of early risk stratification models in the ICU setting.
The prognostic relevance of the LDAR in ICU patients with GI malignancies is supported by the distinct biological functions of its two components—LDH and Alb—which respectively reflect tissue injury and nutritional-inflammatory status, and jointly capture the severity of systemic derangement. Three converging axes help explain the particularly strong LDAR–risk relationship in GI cancers: (i) A glycolytic/hypoxic program (LDH-5/HIF-1α) that increases LDH27–29,43; (ii) hepatic tumor burden and cholestasis that suppress Alb synthesis while raising LDH17,20,30; and (iii) malnutrition/inflammation and a high burden of sepsis around the gut that further lower Alb yet raise LDH.44–46 Prior cohorts in sepsis—including malignancy-associated sepsis—have shown that LDAR stratifies short-term mortality.22,23 LDH, a terminal enzyme in glycolysis, is markedly elevated under hypoxic conditions or during high tumor metabolic activity. The Warburg effect describes the preferential use of anaerobic glycolysis in tumor cells, even in the presence of oxygen, which leads to sustained lactate production and elevated LDH levels in malignancies.15,43 As such, LDH serves as a biochemical indicator of both cellular injury and tissue hypoxia. 22 In acute critical illness, including sepsis and shock, LDH levels rise significantly in response to widespread tissue damage. 22 In oncology, serum LDH reflects tumor burden and aggressiveness. Large-scale prospective studies have reported that elevated LDH is independently associated with increased all-cause and cancer-specific mortality in multiple solid tumors, including colorectal, gastroesophageal, pulmonary, and prostate cancers. 16 Among LDH isoforms, LDH5 is frequently overexpressed in aggressive tumors and is linked to enhanced glycolysis, invasiveness, and unfavorable prognosis. 28 In GI malignancies, elevated LDH—particularly LDH5—has been associated with larger tumor burden, hypoxic microenvironments, and angiogenic activation, all of which contribute to adverse outcomes. 27 For instance, in advanced gastric cancer, patients with hepatic or skeletal metastases had significantly higher serum LDH levels than those without distant spread, suggesting that LDH can serve as a proxy for metastatic tumor burden. 30 Recent evidence suggests that fascin-mediated cytoskeletal remodeling may promote LDH release in aggressive GI tumors, further supporting its role as a metabolic marker of tumor invasiveness. 47 In the present cohort of critically ill GI cancer patients, LDH elevation at ICU admission likely indicated both advanced tumor dissemination and acute physiological insult. In contrast, serum Alb, synthesized by the liver, is a recognized marker of nutritional and inflammatory status. During systemic inflammation, Alb synthesis is suppressed and vascular permeability increases, resulting in hypoalbuminemia—a hallmark of the negative acute-phase response. Alb reduction is common in critically ill patients and has been independently associated with heightened inflammatory activity and increased short-term mortality. 44 In the setting of severe infection, trauma, or cachexia, pro-inflammatory cytokines inhibit Alb production and promote catabolism, leading to profound serum Alb depletion. 22 Moreover, Alb levels are frequently reduced in patients with chronic wasting disorders such as cancer, particularly GI malignancies, due to malnutrition and impaired hepatic protein synthesis. Prior studies have shown that for every 10 g/L decrease in Alb, the risk of mortality in sepsis approximately doubles. 45 In terminal cancer patients, hypoalbuminemia is also a predictor of imminent death, often preceding survival of less than two months. 46 Beyond serving as a surrogate for nutritional status, hypoalbuminemia may directly contribute to poor outcomes by reducing oncotic pressure, exacerbating edema, and impairing immune and pharmacologic function. LDAR thus integrates two pathophysiological axes: LDH reflects tissue damage and metabolic stress, while Alb represents host nutritional and inflammatory reserve. High LDAR implies concurrent LDH elevation and Alb reduction, signaling a physiological state characterized by high injury burden and low compensatory capacity. Such a profile is commonly observed in patients with GI cancers complicated by tumor progression and systemic catabolism. Compared to LDH or Alb alone, LDAR may provide a more comprehensive reflection of disease severity. Several studies have noted that LDAR offers more stable and consistent prognostic performance than either component individually. 48 In summary, elevated LDAR may reflect the additive effects of extensive tumor burden (elevated LDH), systemic injury, malnutrition, and inflammation (reduced Alb), all of which converge to increase short-term mortality risk. As such, LDAR holds strong biological plausibility as a composite biomarker for outcome prediction in this patient population.
In recent years, increasing attention has been paid to biomarkers such as LDH and Alb for prognostic evaluation in critically ill patients. The findings of the present study are consistent with previous reports, while also offering notable innovations. Several studies have confirmed the prognostic value of LDAR in different ICU populations. For example, Xiao et al. 22 analyzed 5784 septic patients from the MIMIC database and reported a significant linear association between LDAR at ICU admission and both 28-day and 90-day mortality. Each doubling of LDAR (log₂ increment) was associated with an approximately 36% increase in 28-day mortality risk. In that study, patients in the highest LDAR tertile had more than double the mortality compared to those in the lowest tertile (HR = 2.14). Another large-scale investigation based on the MIMIC-IV database found that patients in the highest LDAR quartile had a 1.61-fold higher risk of 28-day mortality compared to the lowest quartile (95% CI: 1.41–1.84; P < 0.001), and also experienced significantly elevated 90-day mortality. Kaplan–Meier curves further confirmed that higher LDAR was associated with reduced survival probability. 49 These findings strongly support the relevance of LDAR in short-term prognostication among patients with infection. In critically ill patients with cancer, similar conclusions have been reported. Shen et al., 23 in a recent study published in BMC Cancer, examined patients with sepsis and various malignancies in the ICU. Their results demonstrated that elevated LDAR was an independent predictor of 28-day ICU mortality, with the highest quartile showing significantly greater mortality than the lowest (OR ≈ 3.44). RCS analysis also revealed a nonlinear association, with mortality risk rising sharply beyond a certain LDAR threshold. Notably, their subgroup analysis indicated that patients with distant metastasis had significantly higher median LDAR levels and worse prognosis compared to those without metastasis. This observation aligns with the current study's design, which specifically targeted GI cancer—a high-risk subgroup often characterized by metastatic burden and poor baseline status—where LDAR may more clearly reflect adverse outcomes. Furthermore, the prognostic role of LDAR has been confirmed in disease-specific critical care populations. Zhang et al. were the first to report that LDAR independently predicted 30-day, 90-day, and in-hospital mortality in patients with COVID-19–associated ARDS. Their analysis, based on a MIMIC-IV cohort of 358 patients with ARDS from various etiologies, showed that higher LDAR at ICU admission was associated with significantly increased short-term mortality. Stratification by tertiles revealed that patients in the highest LDAR group had more than twice the risk of 30-day mortality compared to the lowest group, and this association remained robust after adjustment for SAPS II. 24 Notably, the study compared the prognostic performance of LDAR and SAPS II in predicting ARDS-related mortality, revealing that LDAR alone yielded an AUC of 0.694, exceeding that of SAPS II (0.661). The authors suggested that SAPS II might include variables less relevant to ARDS prognosis, whereas LDAR could more directly reflect pulmonary parenchymal injury and overall systemic disturbance. The independent prognostic value of LDAR was also confirmed in the setting of AKI. In a retrospective study involving 1282 ICU patients with AKI, LDAR measured at ICU admission was significantly associated with in-hospital mortality across all AKI stages, with a consistent dose-response relationship (P for trend < 0.001). 25 RCS analysis revealed a nonlinear positive association between LDAR and mortality risk, and Kaplan–Meier survival analysis demonstrated significantly lower survival probabilities in patients with higher LDAR values (log-rank P < 0.001). Although the AUC of LDAR for ICU mortality prediction was moderate (0.653), its ease of acquisition and physiological relevance supported its clinical interpretability in this population. 25 In addition to critical illness, LDAR has been investigated in oncologic populations. In patients with advanced non-small cell lung cancer receiving immunochemotherapy, elevated pretreatment LDAR was significantly associated with shorter overall survival (HR = 2.22, P = 0.007), and this association remained consistent across subgroups. 50 Similarly, in hematologic malignancies such as diffuse large B-cell lymphoma, elevated LDAR at diagnosis was indicative of poor prognosis, outperforming LDH or Alb alone as a mortality predictor. 48 Efforts have also been made to integrate LDH or LDAR into composite prognostic scoring systems for cancer patients. For example, combining LDH with performance status improved survival prediction in patients with metastatic disease, 51 while the Laboratory Cachexia Score (LCAS)—which includes LDH, body weight loss, and other laboratory parameters—was reported to correlate with 1-year survival in patients with advanced malignancies. 52 These findings highlighted the growing recognition of LDH- and Alb-related indices in oncology risk stratification. Collectively, extensive literature has supported the prognostic utility of LDAR across multiple settings, including sepsis, 53 ARDS, 24 AKI, 54 and various cancer types.48,50 However, most prior studies have focused on general ICU populations or heterogeneous malignancy cohorts. The present study specifically addressed critically ill patients with GI malignancies and demonstrated that LDAR remained a robust prognostic factor even within this narrowly defined, pathophysiologically distinct subgroup. This finding addressed a gap in the literature and provided a foundation for future tumor-specific risk stratification models in the ICU setting.
The present study demonstrated significant clinical translational value by providing a practical and accessible tool for early risk stratification and therapeutic decision-making in critically ill oncology patients. As a ratio derived from routine laboratory parameters, the LDAR is easy to calculate and cost-effective. Both LDH and Alb levels can be obtained at ICU admission, enabling early computation of LDAR and timely identification of high-risk individuals. 55 Compared to traditional scoring systems such as SAPS II and SOFA, LDAR does not require extended observation and can facilitate rapid recognition of clinical deterioration and prompt initiation of supportive interventions. 22 The findings revealed that elevated LDAR was significantly associated with increased 28-day mortality. This suggests that clinicians should consider early escalation of organ support, close monitoring for complications, and involvement of multidisciplinary teams to optimize care. LDAR may also serve as a reference point in discussions regarding treatment intensity. An abnormally high LDAR on admission often implies critical illness, warranting timely communication with patients and families regarding prognosis and early coordination with palliative care services. In resource-limited settings, LDAR may inform allocation strategies by identifying patients most likely to benefit from intensive care. Furthermore, LDAR may be integrated into intelligent clinical warning systems that automatically trigger intervention recommendations once defined thresholds are exceeded, thereby enhancing decision-making efficiency. DCA demonstrated that ML models incorporating LDAR achieved superior net clinical benefit across a wide range of risk thresholds. 23 In the context of oncology-specific ICUs, LDAR is expected to become a routine bedside prognostic indicator. When LDAR is markedly elevated at ICU admission (≈ LDAR 40; log₂LDAR ≈ 5.314), clinicians should use it as a trigger to accelerate standard sepsis care—rapid senior review and intensified monitoring, broad-spectrum antimicrobials within 1 h with early de-escalation, expedited source control when indicated, hemodynamic optimization with early vasopressors and dynamic fluid assessment, and timely organ support and nutrition—framing LDAR as a catalyst rather than a therapeutic target.19,22,23,55 The study utilized the publicly available MIMIC-IV database, which comprises more than a decade of high-quality ICU data, thereby ensuring data completeness and enhancing the reliability of findings. 40 By restricting the study population to patients with GI GI malignancies, disease heterogeneity was minimized, and a significant gap in existing literature was addressed. In terms of modeling, several ML algorithms (random forest, AdaBoost, XGBoost) were employed and compared with conventional logistic regression. Boruta feature selection identified LDAR as a core predictor of 28-day mortality, second only to SAPS II. SHAP analysis further elucidated the direction and magnitude of LDAR's impact, confirming its strong association with short-term mortality. These analytical strategies improved not only predictive performance but also clinical interpretability, thereby avoiding the “black-box” limitations and meeting the transparency standards required for clinical application. Subgroup and sensitivity analyses confirmed the robustness of LDAR as a predictor. When compared directly with SAPS II and SOFA scores, LDAR demonstrated favorable stability and reliability in predicting both 28-day ICU and in-hospital mortality, with AUCs of 0.700 and 0.710, respectively—comparable to SAPS II and superior to other inflammation- or nutrition-related markers.
Despite the rigorous design, several limitations must be acknowledged. Excluding encounters with missing LDH/Alb —required for LDAR—may introduce selection bias if testing or illness severity differs; we mitigated this via extensive covariate adjustment, but residual selection cannot be ruled out.38,39 First, this was a single-center retrospective study, and the MIMIC-IV database lacks key clinical variables such as tumor staging, recent anti-cancer treatment details, and comorbidity severity, which may result in residual confounding and limit external generalizability. 56 Second, the study relied on a single LDAR measurement at ICU admission, without accounting for dynamic changes during hospitalization. Continuous monitoring of LDAR could provide a more accurate assessment of disease trajectory and treatment response, but dynamic analysis was not feasible in this dataset. Third, the absence of external validation remains a concern. Although internal cross-validation confirmed the model's stability, further confirmation using independent external cohorts is necessary to establish generalizability. Prospective multicenter studies should be conducted to assess the predictive validity of LDAR across diverse institutions and populations. Fourth, the accuracy of LDAR may be affected by laboratory methodological variability, hemolysis (which impacts LDH), or exogenous Alb supplementation. These factors were not fully explored and may have influenced consistency. Fifth, although LDAR was significantly associated with mortality, causal inference remains limited due to the retrospective study design. It remains uncertain whether lowering LDAR can directly improve clinical outcomes. Future research should address these limitations. Prospective multicenter studies are urgently needed to validate the general applicability and clinical utility of LDAR, particularly its dynamic evolution during ICU stay. LDAR should also be integrated with other biomarkers—such as CRP, carcinoembryonic antigen, and CA19-9—to construct more accurate multimodal predictive models. Additionally, randomized controlled trials should explore whether targeted interventions (e.g., nutritional optimization or tumor control strategies) can reduce LDAR and thereby improve outcomes. 19 Finally, future work should integrate LDAR with artificial intelligence–based radiomics and genomics to enable individualized, multi-modal risk assessment in critically ill oncology populations.
Conclusion
This study demonstrated that LDAR is a robust, independent, and interpretable biomarker for 28-day mortality in critically ill patients with GI malignancies. Elevated LDAR was strongly associated with increased short-term mortality, with a distinct nonlinear dose–response relationship above a threshold of approximately LDAR = 40 (log₂LDAR ≈ 5.314). Compared with traditional scoring systems such as SOFA and SAPS II, LDAR achieved comparable or superior prognostic accuracy while offering greater accessibility and lower cost. Integration of LDAR into ML algorithms, particularly AdaBoost and XGBoost, yielded excellent discriminative performance (AUC up to 0.835) and net clinical benefit, supported by SHAP and decision curve analyses; at the bedside, a markedly elevated LDAR can pragmatically trigger expedited sepsis bundles and source control. Reflecting both tumor burden and host physiological reserve, LDAR may serve as a practical tool for early risk stratification, clinical triage, and decision-making in oncologic ICUs. Prospective multicenter studies are warranted to confirm its generalizability and explore its dynamic utility throughout the ICU stay.
Supplemental Material
sj-docx-1-dhj-10.1177_20552076251395708 - Supplemental material for Lactate dehydrogenase-to-albumin ratio as a predictor of 28-day mortality in critically Ill patients with gastrointestinal cancers: Insights from machine learning and the Medical Information Mart for Intensive Care IV database
Supplemental material, sj-docx-1-dhj-10.1177_20552076251395708 for Lactate dehydrogenase-to-albumin ratio as a predictor of 28-day mortality in critically Ill patients with gastrointestinal cancers: Insights from machine learning and the Medical Information Mart for Intensive Care IV database by Xinyi Chen, Yuwen Cai and Xianglin Yuan in DIGITAL HEALTH
Supplemental Material
sj-docx-2-dhj-10.1177_20552076251395708 - Supplemental material for Lactate dehydrogenase-to-albumin ratio as a predictor of 28-day mortality in critically Ill patients with gastrointestinal cancers: Insights from machine learning and the Medical Information Mart for Intensive Care IV database
Supplemental material, sj-docx-2-dhj-10.1177_20552076251395708 for Lactate dehydrogenase-to-albumin ratio as a predictor of 28-day mortality in critically Ill patients with gastrointestinal cancers: Insights from machine learning and the Medical Information Mart for Intensive Care IV database by Xinyi Chen, Yuwen Cai and Xianglin Yuan in DIGITAL HEALTH
Footnotes
Acknowledgements
The authors thank the PhysioNet team for maintaining the MIMIC-IV database and the open-source software community whose tools supported this work.
Ethics approval
The creation and use of the MIMIC-IV database were approved by the Institutional Review Boards of the Massachusetts Institute of Technology and Beth Israel Deaconess Medical Center (IRB protocol 2001P001699). In accordance with this approval, the requirement for informed consent was waived. Because the present analysis used only publicly available de-identified data, no additional institutional IRB review was required. Dataset access was granted after completion of human-subjects training and acceptance of PhysioNet's Credentialed Health Data Use Agreement; the ethical code and access requirements are publicly documented.41,42
Contributorship
Xinyi Chen (ORCID: 0000-0002-0638-1380): Conceptualization, methodology, formal analysis, writing – original draft, visualization.
Yuwen Cai: Supervision, data interpretation, writing—review & editing, validation.
Xianglin Yuan (ORCID: 0000-0003-4653-5388): Conceptualization, project administration, writing—review and editing, funding acquisition.
Funding
The authors disclosed receipt of the following financial support for the research, authorship, and/or publication of this article: This work was supported by the China Postdoctoral Science Foundation, (grant number 2024M761057).
Declaration of conflicting interests
The authors declared no potential conflicts of interest with respect to the research, authorship, and/or publication of this article.
Availability of data and materials
Supplemental material
Supplemental material for this article is available online.
References
Supplementary Material
Please find the following supplemental material available below.
For Open Access articles published under a Creative Commons License, all supplemental material carries the same license as the article it is associated with.
For non-Open Access articles published, all supplemental material carries a non-exclusive license, and permission requests for re-use of supplemental material or any part of supplemental material shall be sent directly to the copyright owner as specified in the copyright notice associated with the article.