
Abstract
Background
Fetal arrhythmias frequently co-occur with congenital heart disease in fetuses. The peaks observed in M-mode fetal echocardiograms serve as pivotal diagnostic markers for fetal arrhythmias. However, speckles, artifacts, and noise pose notable challenges for accurate image analysis. While current deep learning networks mainly overlook cardiac cyclic information, this study concentrated on the integration of such features, leveraging contextual constraints derived from cardiac cyclical features to improve diagnostic accuracy.
Methods
This study proposed a novel deep learning architecture for diagnosing fetal arrhythmias. The architecture presented a loss function tailored to the cardiac cyclical information and formulated a diagnostic algorithm for classifying fetal arrhythmias. The training and validation processes utilized a dataset comprising 4440 patches gathered from 890 participants.
Results
Incorporating cyclic loss significantly enhanced the performance of deep learning networks in predicting peak points for diagnosing fetal arrhythmia, resulting in improvements ranging from 7.11% to 14.81% in F1-score across different network combinations. Particularly noteworthy was the 18.2% improvement in the F1-score for the low-quality group. Additionally, the precision of diagnosing fetal arrhythmia across four categories exhibited improvement, with an average improvement rate of 20.6%.
Conclusion
This study introduced a cyclic loss mechanism based on the cardiac cycle information. Comparative evaluations were conducted using baseline methods and state-of-the-art deep learning architectures with the fetal echocardiogram dataset. These evaluations demonstrated the proposed framework’s superior accuracy in diagnosing fetal arrhythmias. It is also crucial to note that further external testing is essential to assess the model’s generalizability and clinical value.
Introduction
Fetal arrhythmias are common abnormalities in fetuses diagnosed with congenital heart disease, with an incidence rate ranging from 1% to 3%. 1 Some fetal arrhythmias, such as supraventricular tachycardia (SVT) or sinus bradycardia (SB), may result in fetal death if not detected in time.2–4 Physicians typically employ M-mode (motion-mode) echocardiography to diagnose fetal arrhythmias in clinical practice. 5 Compared to fetal electrocardiogram (fECG) and fetal magnetocardiography, M-mode echocardiography provides the benefits of convenience, rapidity, and detailed structural information, rendering it well-suited for the examination of dynamic substructures like heart valves and cardiac walls.6–8
Typically, clinical physicians focus on the cardiac waveform, drawing conclusions based on changes in cardiac cycles and peak values. However, the structural details of the fetal echocardiogram are often significantly compromised by speckles, artifacts, and noise, reducing image quality. With these impacts, the diagnosis of fetal arrhythmia highly relies on expert experience. Moreover, with the similarities in the structures and features of fetal echocardiograms, continuous diagnosis of fetal arrhythmia can cause visual fatigue for clinical physicians, especially when diagnosed with low-quality fetal echocardiograms, which make the diagnosis of fetal arrhythmia more challenging. Atrial fibrillation is extremely rare in fetuses, as highlighted in the study by Tikanoja et al., 9 which reported a woman presented during two pregnancies (at 25- and 23-week’s gestation, respectively) because the fetuses had rapid, irregular tachycardia and hydrops. This supports our concentration on more common periodic arrhythmias, reinforcing the importance of accurately capturing cardiac cyclic features for effective diagnosis.
Deep learning (DL) networks have achieved remarkable success in computer vision, particularly in medical image analysis. 10 However, these networks may occasionally produce inaccurate results due to the similarity of ultrasound textures when extracting cyclic features from fetal echocardiograms. 7 Additionally, artifacts in fetal echocardiograms can significantly impact the network’s recognition performance. In clinical practice, the heart rate and the difference between atrial and ventricular beat cycles are commonly used to diagnose fetal arrhythmias. 8 Physicians can use the time interval between adjacent peaks at the end of ventricular systole and the end of atrial systole to estimate the cardiac cyclical information.11–13 Excess peaks or prolonged intervals typically indicate fetal arrhythmia. 14 The absence or displacement of a single point can significantly alter the cyclical information and impact the outcomes. While some DL networks overlook cardiac cyclic features, architectures, such as recurrent networks incorporate cyclic/temporal information. However, several current methodologies do not adequately leverage these features for fetal echocardiography, potentially limiting their effectiveness in diagnosing fetal arrhythmias. This gap in utilizing cyclic information can hinder the accuracy and reliability of these networks in clinical applications.
This study explores the analysis of cyclic features in fetal cardiac and introduces cyclic loss as a contextual constraint in DL networks to improve the diagnosis of fetal arrhythmia. The loss function incorporates cardiac cyclic features and atrioventricular wall displacement information, enabling networks to encode and utilize cardiac cyclical information effectively. This constraint is particularly crucial for accurately identifying peak points in fetal echocardiograms, especially when dealing with echocardiograms affected by artifacts or speckles. In essence, the cyclic loss function enhances the network’s ability to capture temporal patterns inherent in the cardiac cycle, thereby improving its performance in fetal arrhythmia diagnosis.
Figure 1 displays two main panels and critical structures in the M-mode fetal echocardiogram for diagnosing a fetal arrhythmia. The upper panel shows 2D ultrasound imaging, which records the specific position and direction indicated by the ultrasound beam (M-line). The lower panel exhibits the motion image, which records the structural changes of the fetal myocardial tissue along the M-line over a period. The x-axis represents time, and the y-axis represents depth within the body. The M-line passes through the left ventricular (LV) and right atrial (RA) regions, respectively, capturing ultrasound reflections from substructures of the fetal heart along the ultrasound propagation path. As the heart beats, these substructures undergo changes along the M-line, which are recorded in the motion image region. In the motion image, two cavities are observable, representing the left ventricular diameter (LVD) and the right atrial diameter (RAD). Both LVD and RAD continuously change with each heartbeat cycle, reaching their minimum values at the corresponding end-systole, referred to as left ventricular end-systole (LVS) and right atrial end-systole (RAS). Cardiac rhythm information can be derived by calculating the interval between occurrences of two LVS or RAS events. Physicians will analyze and determine whether abnormal rhythms are using this collected information.
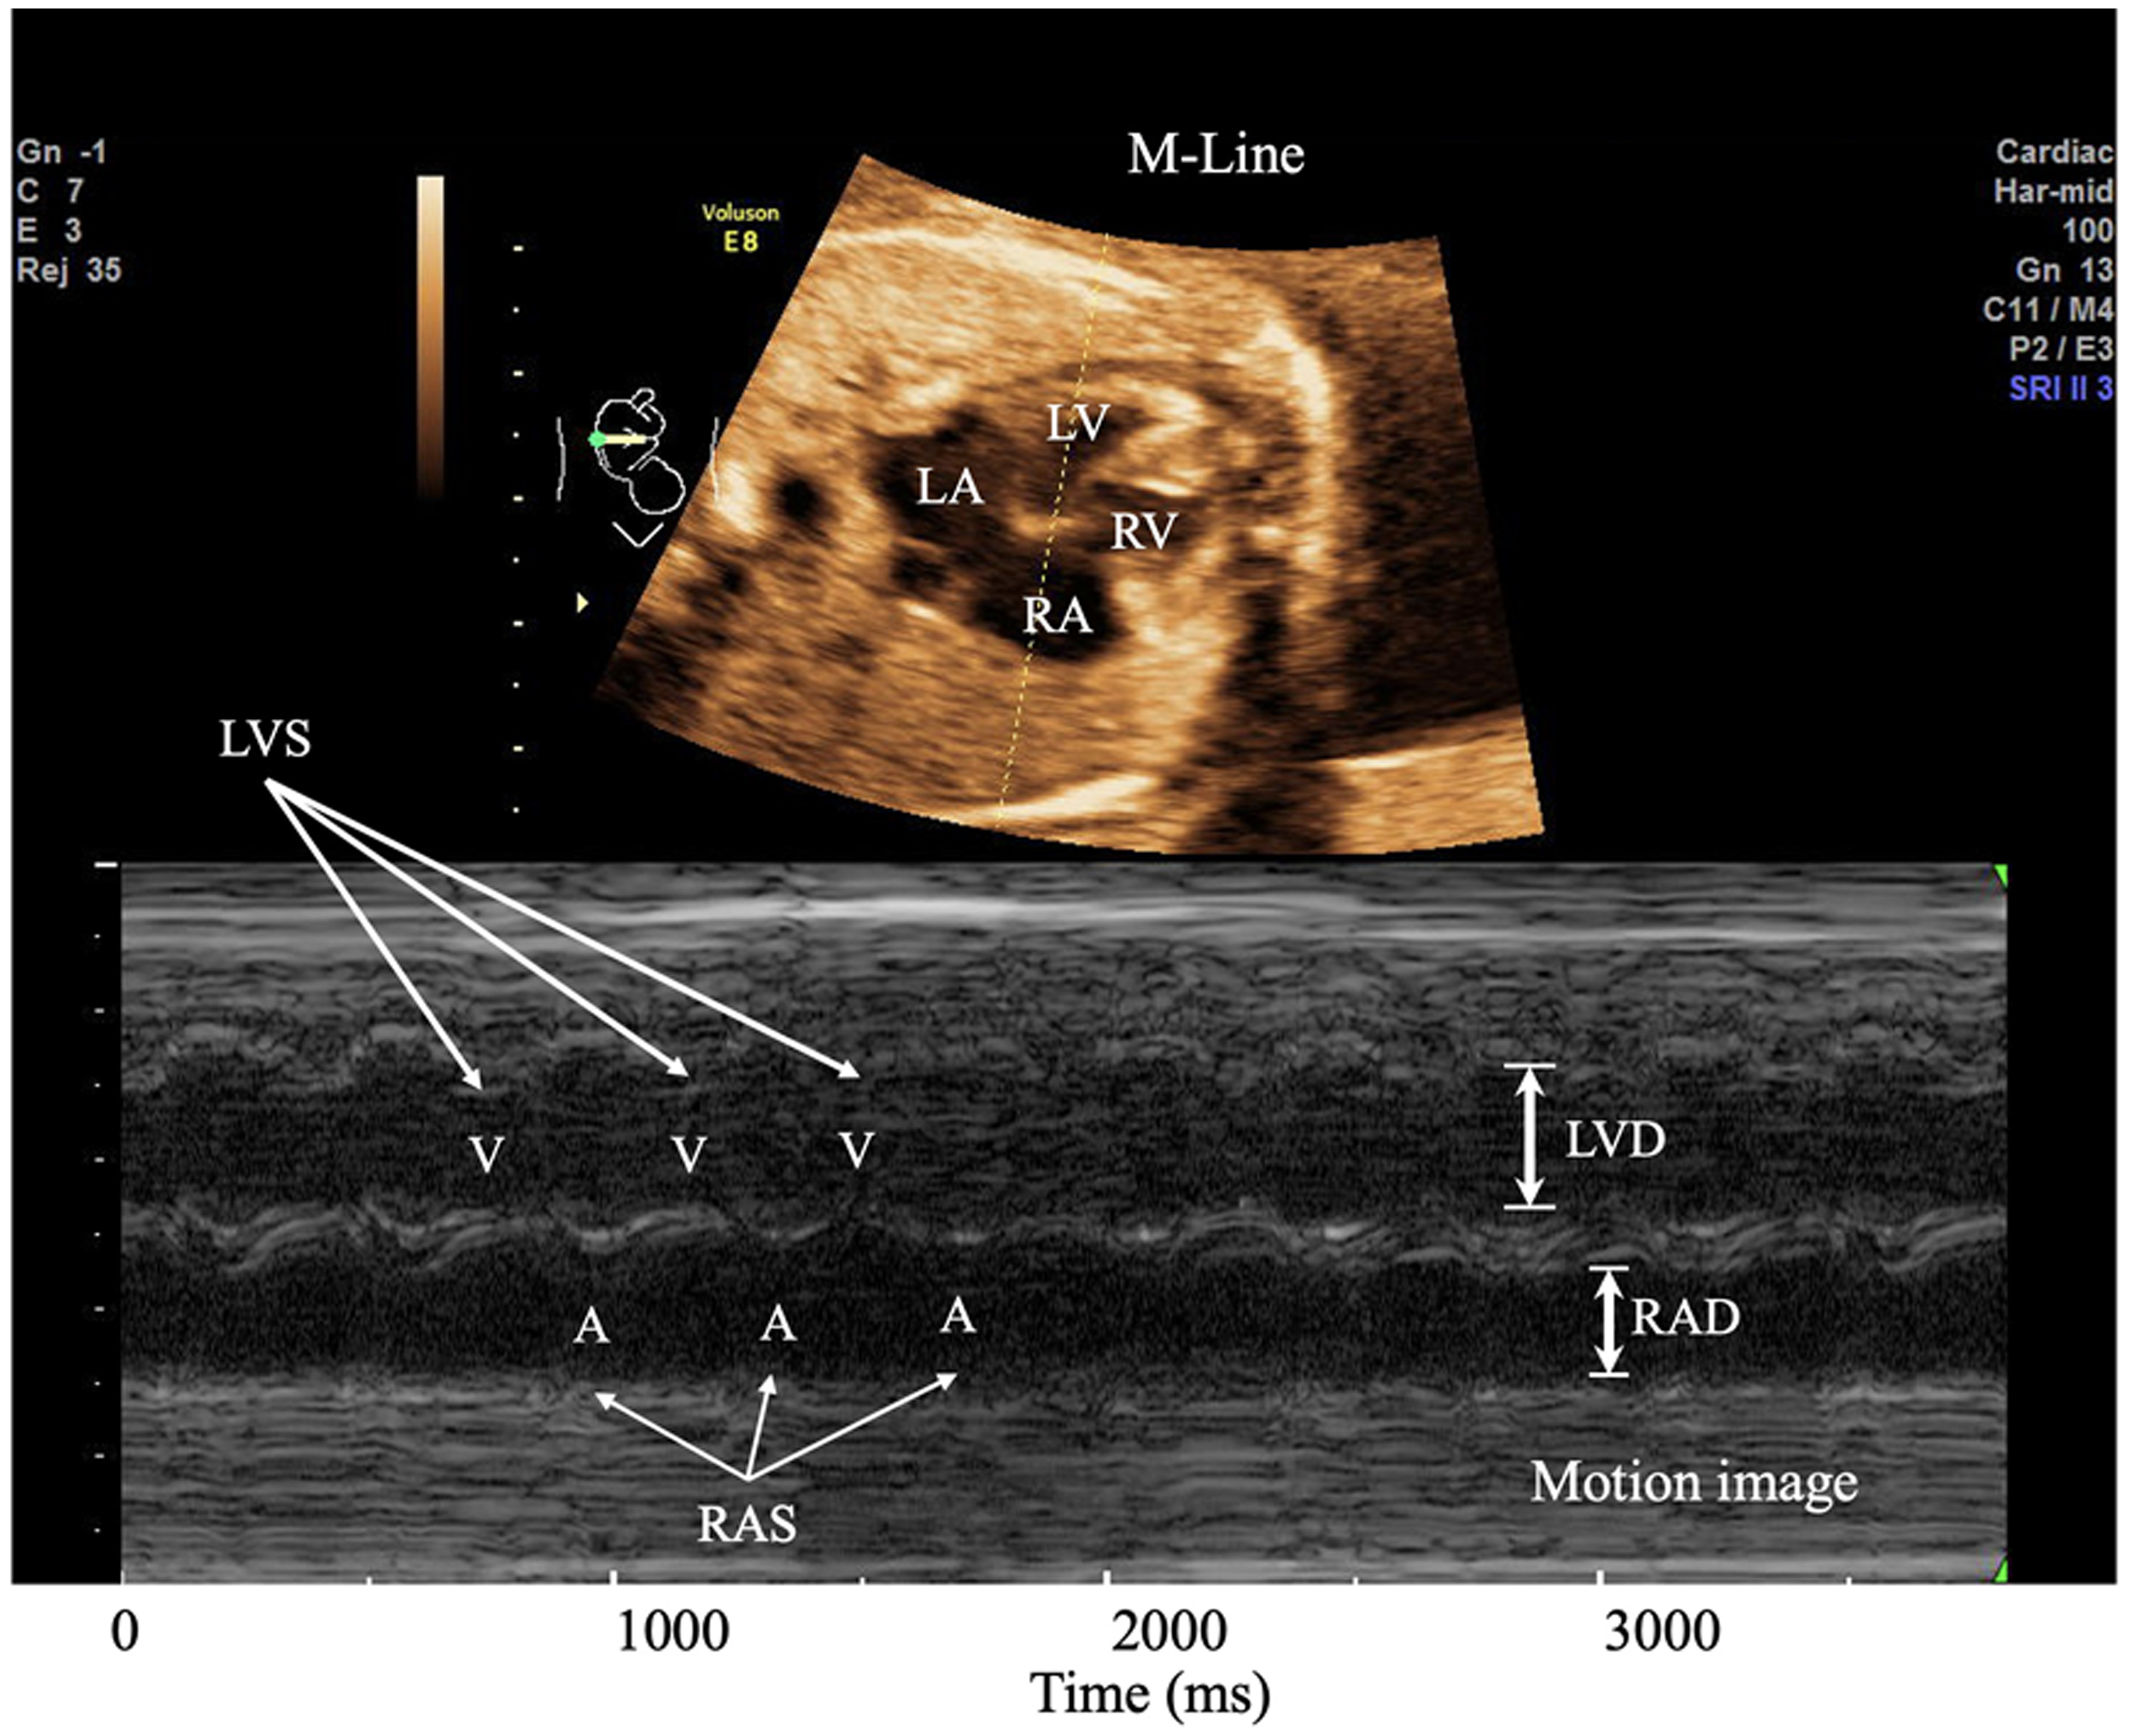
M-mode tracing to demonstrate ventricular (V) and atrial (A) wall motions. The M-Line is directed through the left ventricular (LV) and right atrial (RA).
The primary objective of this study was to propose a novel DL diagnostic framework for fetal arrhythmias based on contextual constraints derived from cardiac cyclical features. Fetal arrhythmias, characterized by irregular heart rhythms, posed significant challenges for accurate diagnosis and management, necessitating innovative diagnostic approaches. Leveraging advancements in DL, our study aimed to develop a robust and accurate diagnostic tool capable of detecting fetal arrhythmias with high precision and recall. By integrating contextual constraints derived from cardiac cyclical features, our proposed framework sought to enhance the accuracy and reliability of fetal arrhythmia diagnosis, ultimately aiming to improve patient outcomes in prenatal care.
Related works
Wave extraction for the motion trajectory of atrioventricular wall
M-mode echocardiography image provides abundant motion information about cardiac substructures. This study’s key aspect is identifying the motion trajectory of the atrioventricular walls. In Figure 2, the yellow waveform represents the motion of the internal wall of the LV, and its peak point is the minimum value of LVD, denoted as LVS. Similarly, for the lower RV motion area, the blue waveform represents the motion of the internal wall of the RV. Its peak point denoted RVS, represents the minimum value of RVD. 15

The motion image of the cardiac cycle and the motion of the internal wall of left ventricular (LV) and right atrial (RA).
The conventional method for wave extraction primarily revolves around edge detection techniques, including the utilization, such as the Canny edge detector, the Sobel operator, and the Scharr operator. For instance, Almeida et al. 16 proposed a wavelet-based approach for fetal QRS detection and heart rate estimation. Su and Wu 17 proposed a novel edge detection-based method to extract the fECG from a single-lead maternal abdominal ECG. However, the fundamental weaknesses of fetal echocardiography, including the presence of substantial noise and artifacts, make it difficult to obtain desirable outcomes using these methodologies.
Convolutional neural networks demonstrate excellent performance in image segmentation, leading researchers to utilize DL models for treating the extraction of cardiac pulsation as a segmentation task. For instance, Sultan et al. 18 introduced a technique for identifying the anterior mitral valve (MV) area in M-mode ultrasound and translating it to conventional B-mode ultrasound images. They employed a local active contour model to segment the anterior MV, achieving a Dice coefficient of 0.63. Additionally, Corinzia et al. 19 presented a novel automatic unsupervised segmentation approach for MV segmentation in the four-chamber section at the heart’s apex, obtaining a Dice coefficient of 0.495. Bertelli et al. 20 proposed a semi-automatic system for the segmentation of cardiac M-mode images. Rodriguez et al. 21 introduced a novel methodology to automatically segment all the walls present in M-mode echocardiography images to determine the ventricular chamber dimensions and wall thickness using amplitude–modulation frequency modulation demodulation techniques. Despite the advancements in DL applications for medical image analysis, there is limited research specifically focused on DL methods for diagnosing fetal arrhythmias. Some studies have explored the use of DL for related tasks, such as segmenting cardiac structures and detecting arrhythmias in adult patients, while direct applications to fetal echocardiography remain scarce. This study aimed to bridge this gap by proposing a novel framework that leverages cardiac cyclical features for improved diagnosis of fetal arrhythmias. Through improved understanding and delineation of the atrioventricular wall motion, the accuracy and efficacy of fetal arrhythmia diagnosis could be enhanced, ultimately contributing to better patient care and outcomes. Further research in this direction holds promise for advancing prenatal cardiac imaging and clinical practice.
Peak detection
To extract cyclical information from M-mode fetal echocardiography, identifying peak points in the motion trajectory of the atrioventricular wall is crucial. The distance between adjacent peak points along the x-axis provides insights into successive cardiac cycles. Oberweger et al. 22 proposed the DeepPose network for human pose estimation, transforming the estimation problem into a key point detection task using deep neural networks. Similarly, Zhang et al. 23 introduced multi-task cascaded convolutional neural network for facial key point recognition, employing a cascaded search and localization approach. Sun et al. 24 introduced HRNet, utilizing multi-resolution fusion for keypoint detection, enhancing feature extraction capabilities. However, these methods mainly involve extensive models. Guo et al. 25 addressed this with Practical Facial Landmark Detector (PFLD), employing MobileNet as the backbone network, prioritizing speed without compromising accuracy. In the present study, the number of peaks varied significantly with the fetal heart rate, ranging from 110 to 300 bpm. Accurately identifying these peaks within a period posed a significant challenge in this research.
Methods
Overview
This study proposed a three-stage framework based on the introduced cyclic loss, which included a segmentation stage, peak prediction stage, and fetal arrhythmia diagnosis stage. The segmentation network (SN) was utilized to predict the heartbeat region from fetal echocardiography, while the peak prediction network (PPN) was tasked with obtaining the peaks of the LVS and RAS. Contextual constraints were acquired as losses during the calculation of cyclical information related to the peak points. These losses were fed back to both the PPN and the SN. Diagnostic results could be obtained using the peak points predicted by employing a diagnosis algorithm. The architecture is illustrated in Figure 3.

The proposed architecture for diagnosing fetal arrhythmia. The proposed approach consists of a segmentation network (SN) and a peak predict network (PPN). SN is presented in (a), while PPN is presented in (b). The diagnosis stage is shown in (c).
There are several challenges in obtaining the peaks of LVS and RAS in M-mode fetal echocardiography:
Various types of fetal arrhythmias exhibit fetal heart rate ranges spanning from 110 to 300 bpm. The variability in the number of peaks yields diverse diagnostic outcomes, rendering the number of peaks inconsistent and unsolvable through template matching. The same image often encompasses two distinct regions: the LV and the RA. Despite both regions containing peak points, their significance differs. Traditional methods used to compute the distance between predicted and ground truth point sets need clarification regarding points in these two regions. There are different frame rates in M-mode fetal echocardiograms. The higher the frame rate, the shorter the time interval recorded by the echocardiogram, and the fewer the cardiac cycles contained. Conversely, the lower the frame rate, the denser the cardiac cycles recorded in the fetal echocardiography.
The study initially standardized the frame rate of the entire echocardiogram by referencing timestamp markers located at the bottom of the fetal echocardiograms. Subsequently, the normalized echocardiogram was divided into multiple patches, each encapsulating changes in cardiac structure over a 2-second interval. Given the variability in heart rates associated with fetal arrhythmias, such as atrial flutter (AF), SVT, SB, and fetal tachycardia, ranging from 110 to 300 bpm, a patch may encompass 2–10 cardiac cycles.26–29 In this study, 24 slots were allocated in each patch, involving 12 slots for the peak of the LVS and 12 slots for the peak of the RAS.
The segmentation stage delineated three classes: LV, RV, or background, categorizing all pixels in fetal echocardiograms. The CE (cross-entropy) loss gauged the dissimilarity between predictions and ground truth. However, for peak prediction networks, conventional mean square error loss solely accounts for spatial distance between points, overlooking cardiac cyclical information. Thus, this study introduced cyclic loss, leveraging contextual heartbeats to identify peak points associated with cardiac cycles in M-mode fetal echocardiograms. The fundamental concept is outlined as follows:
Cardiac cycles typically exhibit consistent periodicity, suggesting that the interval between successive cycles remains relatively stable. However, it is noteworthy that this observation may not hold in cases of atrial fibrillation. The intensity of the cardiac cycle remains consistent, resulting in the peaks of LVD or RAD forming a line that fluctuates within a narrow range and maintains relative stability.
Cyclic loss function
In the M-mode echocardiogram, the LV and RA regions represent two distinct structures. The peak points of LVS and RAS, denoted as


Fetal arrhythmia diagnosis
Fetal arrhythmia type can be diagnosed by assessing the coordinates and distances between the peaks of LVS and RAS. A classification algorithm was developed for this purpose. The dataset comprises negative and positive cases, encompassing AF, SVT, ST, and SB. Samples representing various cases are displayed in Figure 4.

Samples of different cases from a dataset of fetal arrhythmia: (a) representing a case with no fetal arrhythmia at frame rate #3, (b) depicting a case without fetal arrhythmia at frame rate #5, (c) showing a case of sinus bradycardia, (d) displaying a case of atrial flutter (AF), (e) illustrating a case of supraventricular tachycardia, and (f) depicting a case of sinus tachycardia.
Adhering to the diagnostic and clinical research guidelines for fetal arrhythmias, 30 a classification algorithm was developed in this study. The pseudocode is presented in Algorithm 1.
Return
Return
Return
Return
Return
Datasets
To assess the efficacy of the proposed approach, this study gathered 890 M-mode echocardiography images from Beijing Anzhen Hospital (Beijing, China). The dataset comprised both negative cases for fetal arrhythmia and positive cases, encompassing AF, SVT, ST, and SB. The study protocols and procedures adhered to the guidelines outlined in the Declaration of Helsinki and received approval from the Ethics Committee of Beijing Anzhen Hospital (Approval No. 2019030). Further details regarding the dataset are outlined in Table 1.
The statistics of collected data.

Following anonymization, all data underwent dual annotations by professional physicians. Five points were annotated for each ventricular beat and atrial beat in the cardiac cycle, with the third point designated as the peak point. To minimize errors arising from visual identification during manual annotations, the midpoint of the line connecting the two annotations was utilized as the ground truth. The labels were categorized into three groups: LV annotation points were classified as Class 1, RA annotation points as Class 2, and all other content was designated as background and labeled as Class 0.
According to the specifications of the ultrasound machine, there are three different frame rates: frame rate #3, frame rate #4, and frame rate #5, their relative relationships are displayed in Table 2. In this study, frame rate #4 was considered as the standard speed, and the other frame rates were scaled to the standard speed. The data were processed using a window width of 300 pixels (equivalent to 2 seconds) and a stride of 200 pixels, generating patches. To evaluate the performance of the method, the dataset was partitioned into training, validation, and test datasets, with proportions of 60%, 20%, and 20%, respectively.
Details of datasets.

Evaluation metrics
The model can be assessed by evaluating the accuracy of its prediction outcomes. The definition of prediction results is outlined as follows:
Recall Precision F1-score


Implementation
We implemented the proposed algorithm using Python 3.9 and PyTorch 1.12. The computing platform operated on Ubuntu 20.04 LTS (64-bit) with NVIDIA CUDA toolkit 11.7. The hardware setup consisted of four NVIDIA TESLA V100 32G computing accelerator cards and an Intel CPU from DELL C4140.
Results
Verification of cyclic loss
Peak detection went through two stages, which are segmentation and prediction. The study performed ablation experiments to evaluate the performance between different SNs, different prediction networks, and the effectiveness of the cyclic loss. For the SN, we employed UTNet 31 and nnUNet, 32 while for the prediction network, we utilized PFLD 25 and YOLOv8. The cyclic loss was verified on different network combinations; the experimental scores are presented in Table 3. The experiment utilized precision, recall, and F1-score as the primary evaluation metrics for comparing the results. Additionally, a Wilcoxon signed-rank test was conducted to assess the significance of differences between the predicted and actual coordinates, yielding a P-value. It can be observed that the scores show no significant changes with different SNs while employing different prediction networks resulted in the highest improvement of 5.37%. This is because the SN in the architecture serves as the backbone, and its accuracy has a relatively minor impact on the result. The PFLD, as a typical face recognition network, considers the intrinsic relationship between predicted points. Besides, the YOLO network treats each peak as an independent point. In comparing these networks without cyclic loss, the PFLD network improved by 1.3% compared to YOLO. In comparing the use of cyclic loss, the networks with cyclic loss achieved improvements ranging from 7.11% to 14.81%. That is because the cyclic loss encodes the cyclical information, with the consideration of the cardiac cycle, the predicted position for each peak point will use the information from related heartbeats.
The impact of different constraints on different deep learning (DL) models.

The bold values indicate the best performance within the group.
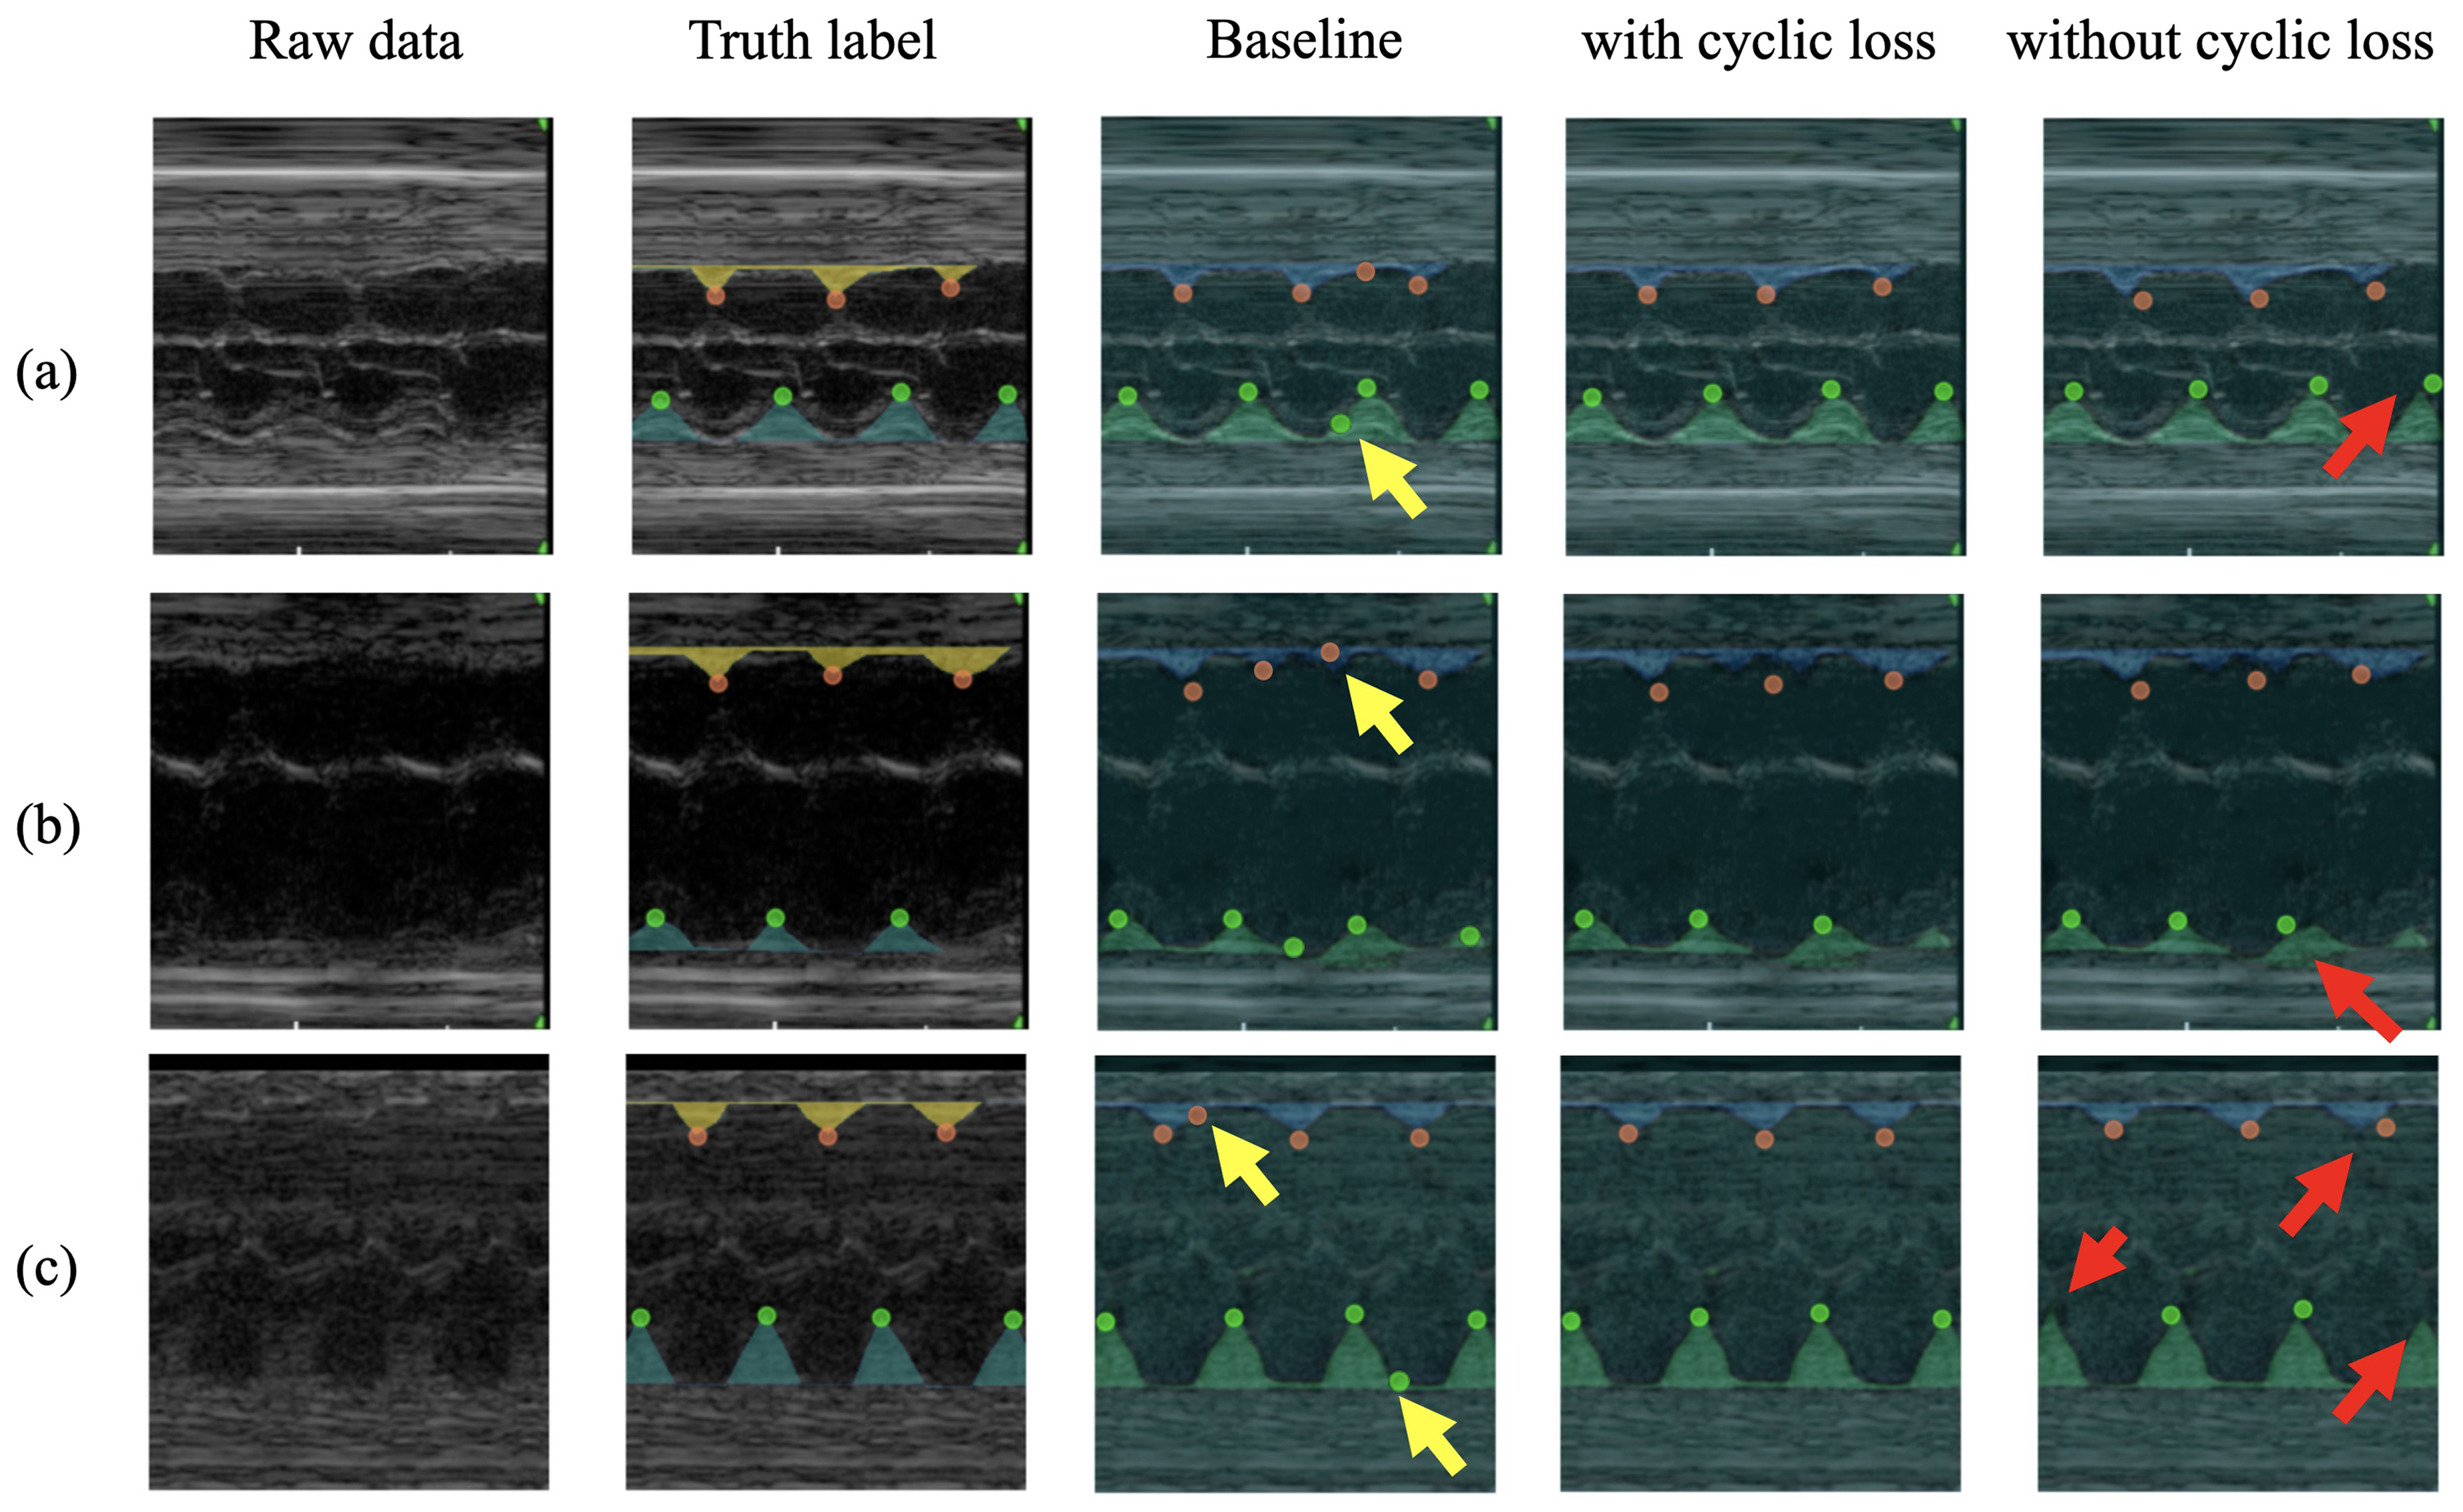
The comparison of predicted results from different networks is shown in Figure 5. The red arrow highlighted the peaks which are identified incorrectly. This is due to the complex texture of the fetal echocardiography image, making the SN unable to separate the heartbeat region from the background. With the impact of the SN, the following prediction network results in incorrect predictions. Using cyclic loss, the cardiac period constraints affect the process and fix the mismatch of the predicted points.

Predicted results with the use of cyclic loss in different networks: (a) showing four different networks for peak point prediction training without cyclic loss and (b) illustrating the predicted results of model training with cyclic loss.
Additionally, some points were mismatched with the truth label (highlighted with the yellow arrow). The reason is that the output from the SN between two classes, like the RA class and the background was similar, making the predicted network point the peak at the wrong place. With the constraints of displacement information, the output of the peak point network will use information from related points and make the result more accurate.
The impact of constraints on different image qualities
To evaluate the performance of cyclic loss in different qualities, the study split the testing dataset of fetal arrhythmia into three groups. The evaluation criteria are shown in Table 4.
Criteria for evaluating the quality of echocardiograms.
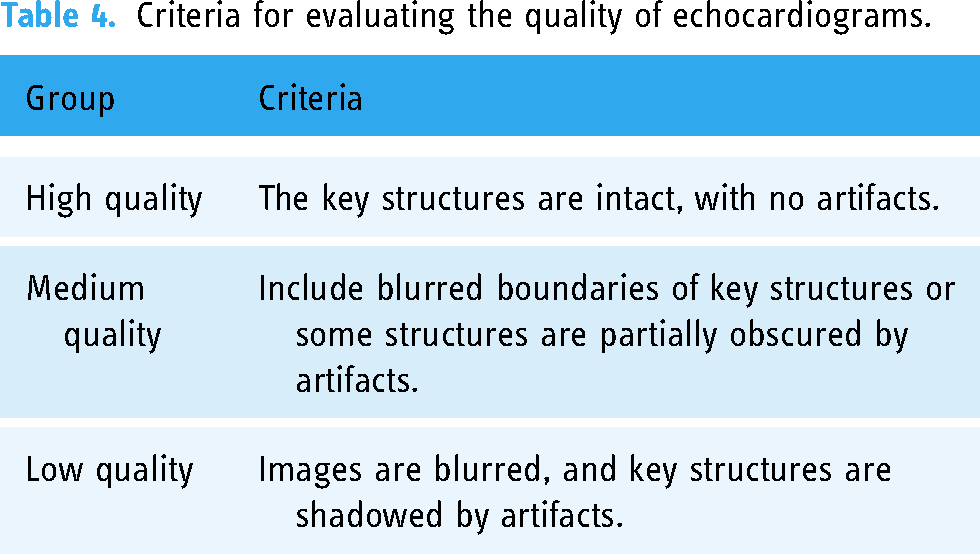
Table 5 presents the scores of three groups for cyclic loss. We introduced a baseline method that involves edge detection after the SN. By extracting the edges of LV and RA as two 1D arrays and using traditional peak detection to identify vertices. Subsequently, a low-pass filter was applied to the results to avoid misidentification caused by minor edge fluctuations. The results reveal that the performance of the baseline method is quite unstable, with the best performance observed in the high-quality group but poorer performance in the other two groups. This is because segmentation mistakes directly affect edge detection, and differences in image quality affect the stability of mask predictions output by the SN. The integration of cyclic loss leads to a notable enhancement, with an improvement of at least 0.065 in F1-score across all groups and a substantial increase of 0.133 observed in the low-quality group. This improvement is particularly noteworthy in the low-quality group, where images are primarily unstable and blurry. The effectiveness of this enhancement can be attributed to the periodic constraints introduced by contextual information, which leverage the relationships between adjacent points to enhance point accuracy.
The impact of constraint on different qualities.

The bold values indicate the best performance within the group.
Figure 6 compares the predictive results using cyclic loss across three different qualities. It can be observed that the baseline method detects according to the edges of the mask, which can relatively accurately capture the peak points but is also easily affected by the fluctuations of the edges or minor errors in segmentation, resulting in a large number of error points, some of which are marked with yellow arrows. Besides, the cyclic loss makes the network focus on cyclical information. Mismatched peaks are highlighted with red arrows. Particularly in group (c), with the weak signal in low-quality fetal echocardiography image, two peaks are absent in the network output without cyclic loss. The cyclic loss recovers the missing peaks, demonstrating the ability to capture cyclical features from echocardiography images. The experiments in groups (a) and (b) show that the highlighted peaks are mismatched from the ground truth. The cyclic loss, which focuses on the cyclical information between related peaks, makes the prediction point more accurate.
Comparison of the predicted results for the use of contextual constraints in different qualities. Red and yellow arrows are pointing at missing points or wrong positions. (a) The visual comparison of predicted results for the use of cyclic loss in the high-quality group, (b) the medium-quality group, and (c) the low-quality group.
Optimal weights of cyclic loss
Different weights for different losses can also specifically impact the results. For this purpose, we defined hyperparameters to investigate the influence of varying constraint weights on the results. We trained the model using the final loss
The impact of different constraint weights on model performance.

The bold values indicate the best performance within the group.
Validation of diagnostic results
To assess the impact of different stages on diagnostic results. Three networks were deployed, including prediction network only, segmentation and prediction network, SN, and predict network with cyclic loss, which this study proposed. The diagnostic results were shown in three confusion matrixes in Figure 7. It shows that the proposed network achieves the best performance in all architectures. Figure 7(a) shows that the point-to-point PFLD network neglects the cyclical information associated with a heartbeat. The predicted results are concentrated in the label of AF, which may be why the weak signal of LVD makes the peak point hard to recognize from the raw image. With the enhancement from the SN, which can be observed from Figure 7(b), the accuracy of the diagnostic results has been significantly improved. Nevertheless, the network must improve in distinguishing AF and ST cases. For ST cases, each patch would have 5–7 cardiac cycles (160–200 bpm, 5–7 peaks of RAS and LVS). As for AF cases, there would be 4–5 peaks of RAS and 6–8 peaks of LVS. Errors in predicting the peak points of RAS in ST cases will lead to misdiagnosis of fetal arrhythmia. Also, some mistakes were found in distinguishing SVT from SB cases. That is because the fast heart rhythms reduce the cycle interval, which makes it difficult for the model to identify. Furthermore, the missing points significantly increase the distance between peaks and result in the wrong diagnostic result. With the cyclic loss in Figure 7(c), the contextual information of related heartbeats will help constrain the predicted points, reducing the misprediction of peaks.

Confusion matrix in different architectures for diagnosing fetal arrhythmia: (a) the classification results using PFLD only, (b) the classification results using UTNet + PFLD without cyclic loss, and (c) the classification results using the proposed approach with cyclic loss.
Discussion
This study aimed to improve the accuracy of fetal arrhythmia diagnosis using DL techniques. The results demonstrate that incorporating cyclic loss during model training significantly enhances the model performance. While the proposed DL diagnostic framework showed promising results, several limitations merit discussion. First, the utilization of a dataset from a single source might introduce bias and limit the generalizability of the findings. External validation on an independent dataset was not conducted, hindering the assessment of the model’s performance in real-world clinical settings and its generalizability. Additionally, the lack of interpretability of DL models poses challenges in understanding the underlying decision-making process. Furthermore, the clinical translation of the proposed framework might face hurdles related to regulatory approval, integration into existing clinical workflows, and acceptance by healthcare providers. Addressing these limitations in future research can enhance the applicability and reliability of the proposed approach in clinical practice. Given the rarity of atrial fibrillation in fetuses, as noted in the literature, 9 the present study primarily addressed more prevalent fetal arrhythmias that exhibit regular periodicity. This further validated the necessity of our proposed cyclic loss mechanism to enhance diagnostic accuracy for these conditions.
Conclusion
This study introduces a DL diagnostic framework for fetal arrhythmias based on contextual constraints derived from cardiac cyclical features. Its effectiveness was validated through comparisons with state-of-the-art DL networks on a dataset of fetal arrhythmia. To our knowledge, this is the first DL model that applies cyclical information for diagnosing fetal arrhythmias. The cyclic loss proposed in this study addresses the challenges of peak identification in fetal echocardiography images, primarily exhibiting improved performance on low-quality images. The cyclic loss reconstructs connections using the context of related heartbeats, enhancing the network’s ability to extract features from partially compromised cyclical information. The cyclic loss avoids the misprediction of points in the weak signal region of M-mode echocardiography images, which has significant implications for clinical application. The experiments demonstrated that the DL architecture significantly improved results. Comparative evaluations against baseline methods and other DL architectures showed that the minimum improvement rate of the F1-score across different networks is 6.63%. In particular, there was a significant 18.2% improvement in the F1-score in the low-quality group. In diagnosing four types of fetal arrhythmias, the model yielded an average improvement of 20.6%. However, it is crucial to note that the comparisons of the model’s performance are based on the M-mode fetal echocardiogram dataset. External testing is essential to evaluate the generalizability and clinical relevance of the model. Our future work will focus on validating the effectiveness of the cyclic loss using external datasets to ensure broader applicability, such as the key points recognition for intraoperative electrocardiographic monitoring.
Footnotes
Acknowledgements
Financial support from National Key R&D Program of China under Grant 2021ZD0140407, National Natural Science Foundation of China under Grant U21A20523 are gratefully acknowledged.
Contributorship
Xiangyu Liu: conceptualization, methodology, software, validation, formal analysis, and writing–original draft. Yingying Zhang: data curation, writing–original draft, methodology, and formal analysis. Haogang Zhu: conceptualization, supervision, writing–review and editing, investigation, formal analysis, and resource. Xu Yang: data curation, conceptualization, and methodology. Jian Cheng: supervision, writing–review and editing, and methodology. Jishuo Jin: data curation and software. Bosen Jia: writing–original draft. Yihua He: supervision, methodology, writing–review and editing. Hongjia Zhang: supervision and writing–review and editing.
Declaration of conflicting interests
The authors declared no potential conflicts of interest with respect to the research, authorship, and/or publication of this article.
Ethical approval
The authors declare that no animal or human experiments were conducted. The study protocols and procedures followed the protocols of the Declaration of Helsinki and were approved by the ethics committee of Beijing Anzhen Hospital (Approval No. 2019030).
Funding
The authors disclosed receipt of the following financial support for the research, authorship, and/or publication of this article: This work was supported in part by the National Key R&D Program of China under Grant 2021ZD0140407, in part by the National Natural Science Foundation of China under Grant U21A20523.
Guarantor
Haogang Zhu and Yihua He.
Patient consent statement
The authors confirm that patient consent is not applicable to this article. This is a retrospective case report using de-identified data, therefore, the IRB did not require consent from the patient.