
Abstract
Objective
Sepsis remains a leading cause of mortality in healthcare, requiring rapid detection and intervention. This paper presents a scalable, serverless machine learning (ML) operations architecture for near real-time sepsis risk-stratification in Emergency Department (ED) waiting rooms, where pathology data is often unavailable and recognising sepsis presents the biggest opportunity for timely treatment.
Methods
The system integrates HL7 message processing through MuleSoft in a secure Amazon Web Services (AWS) cloud environment, leveraging AWS services such as Lambda for real-time data processing and SageMaker for ML model deployment. To optimise the model's performance, the receiver operating characteristic (ROC) curve was used to evaluate different cutoff thresholds of probability across different age groups (16–35, 35–65, and 65–115), aiming for >80% sensitivity and minimise false negatives. Processed data is stored in Aurora PostgreSQL Relational Database Service and visualised in an on-premises proprietary dashboard for clinical decision support.
Results
Despite high reliability, with 99.7% of HL7 messages successfully processed, limitations include occasional failures due to downtime and code set mismatches, as well as peak execution times of 10.5 s under heavy loads, highlighting areas for optimisation. Model development of eligible ED encounters (n = 484,617) using XG Boost was integrated as a real-time endpoint in SageMaker. The Extreme Gradient Boosting model achieved the highest overall accuracy (0.84) and F1-score (0.80), with balanced sensitivity and specificity for our specified limited features within an ED. ROC for age groups (16–35, 36–65, 66–115), showed strong performance in all cohorts (AUCs: 0.864, 0.867, 0.806).
Conclusion
This paper outlines the system's design, implementation, and potential for enhancing early sepsis risk-stratification through near real-time monitoring in the ED waiting room.
Keywords
Introduction
Sepsis is a life-threatening condition that occurs when the body has an extreme response to infection.1,2 It is a time-critical medical emergency that can lead to organ failure and possible death. One in five patients with sepsis deteriorates within 72 h after admission.2,3 Sepsis is one of the most frequent and costly adverse health events during healthcare delivery, estimated to make up 2.65% of a national healthcare budget and approximately 0.33% of gross national product. 4 The emergency department (ED) is usually the first place of medical assistance for septic patients. Thus, emergency clinicians play a crucial role in the early diagnosis and treatment.
Sepsis remains difficult to diagnose as it can cause organ dysfunction that is life-threatening without overt signs of underlying infection.1,5 Several healthcare organisations have developed and implemented quality and safety programs to improve the detection and management of sepsis. In New South Wales, Australia, the Clinical Excellence Commission's SEPSIS-KILLS program, 6 a paper-based clinical pathway, is the standard practice, which assists clinicians in recognising and responding to patients at risk of developing sepsis. Clinicians who recognise patients with sepsis can manually turn on the Sepsis Alert (a Systemic Inflammatory Response Syndrome (SIRS)-based program), the existing tool in the electronic medical record (eMR), to indicate the initiation of sepsis pathway. Patients presenting to EDs can sometimes have long waiting times before treatment can be commenced. During this period, the limited information collected about patients during the clinical triage process can lead to patients with sepsis or at high risk of developing sepsis being missed, particularly in busy overcrowded EDs. Therefore, due to the busy nature of EDs, the risk of sepsis may still be missed in the waiting room.
The Sepsis-3 definition 1 recognises that scoring with limited available information such as quick Sequential Organ Failure Assessment (qSOFA) could be trailed in ED settings instead of relying on SIRS-based algorithms 1 and pathology results e.g. lactate. 7 But past evaluations of the qSOFA screening algorithm have highlighted the poor performance of the simplistic algorithm. 8
Most machine learning (ML)-based sepsis detection algorithms have been developed on Intensive Care Unit (ICU) datasets, inpatients versus the ED.5,9–12 Our sepsis algorithm is referred to as the
Method
The system architecture (Figure 1) was designed for near real-time ingestion of Health Level Seven (HL7) messages, processing and visualisation of patient data for sepsis risk scoring in the ED waiting room. It leveraged an event-driven and serverless design combining both cloud components and on-premises infrastructure.

System architecture, in a secure Virtual Private Cloud (VPC) environment for near real-time sepsis detection, data storage, processing and retrieval via AWS Cloud, with the user interface in SAFE-WAIT tool. AWS: Amazon Web Services; SAFE-WAIT:
Data ingestion and flow
We defined an event as the creation or edit of a patient's record via the eMR (Figure 1). Thereafter, the data flow from the eMR HL7 messages were intercepted via MuleSoft. We used a HL7 connector that was suited to HL7 protocols. MuleSoft allowed for enhanced security and was scalable if HL7 traffic increased. The HL7 information was stored as a text file in a Simple Storage Service (S3) bucket. Amazon Web Services (AWS) Lambda was a serverless, event-driven service that allowed for code to be run. GitHub was used to upload a Lambda function created in Python, to respond to the specific event of the HL7 messages being loaded on the S3 bucket. Inside the Lambda function, a custom-made HL7 parser decoded the messages and extracted the relevant features and information. Therefore, the Lambda function was triggered by the event of receiving the HL7 message. If there was an event where the messages were stopped or contain errors, the Lambda functions would send notifications through the eHealth Simple Mail Transfer Protocol Server. This ensured data quality and error checking was provisioned by several Lambda functions.
S epsis risk A I algorithm F or E mergency department WAIT ing room model development
Data source and collection
The study was conducted using a large dataset of ED patients (N = 556,652) drawn from four hospitals within the Western Sydney Local Health District (WSLHD), which serves a multicultural population of over one million residents. Each unique presentation to the ED during the study period (January 2017 to December 2019) was treated as a separate encounter. From the initial cohort, those under the age of 16 (N = 72,035) were excluded (Figure 2). Triage category 1 patients were excluded under the assumption that they were already receiving critical care. Where available, historical medical and medication records were also included to enrich the clinical context.

The flowchart illustrates the stepwise inclusion and exclusion criteria applied to emergency department encounters to formalise the dataset.
Among the eligible ED encounters, 104,935 were identified as having a suspected infection, defined by either a culture order within 24 h (N = 99,422) or a rapid viral test order within 24 h (N = 15,584). A subset of 22,628 encounters met criteria for suspected sepsis, based on classification into the Adult Sepsis Pathway Red Zone (N = 6660) or Yellow Zone (N = 20,360). Of these, 28,320 encounters had a SOFA score ≥2, and 1575 were diagnosed with sepsis based on either an explicit diagnosis (N = 1300) or infection plus ICU admission or death within 24 h (N = 302). The final number of confirmed sepsis cases used for model development was 29,895, representing a prevalence of 6.17% in the dataset of ED encounters.
Data labelling
We calculated new fields to allow for labelling of the data based on the Sepsis-3 definition selected by our subject matter experts. The following criteria were utilised for data labelling, and we defined the following fields:
Adverse Outcome
Time to death less than or equal to 24 h, OR Time to ICU admission less than or equal to 24 h. Sepsis in Discharge Note
Identified by the presence of the following pattern in the discharge diagnosis: ‘sepsis’ or ‘septic’. Viral Infection in Discharge Note
Detected by the presence of the following patterns in the discharge diagnosis: ‘infect’, ‘abscess’, ‘pneumonia’, ‘viral’, or ‘virus’. SOFA Total (Sequential Organ Failure Assessment)
Calculated as the sum of individual organ scores including respiratory, platelet, liver, cardiac, brain, and kidney. Suspected Infection
Positive culture result within 24 h, OR Rapid tests indicating infections (A, B, or RSV) within 24 h. Diagnosed Sepsis
If Suspected Infection is not true, or if Suspected Infection is true and SOFA Total is less than 2, and Sepsis is noted in the discharge summary, OR If Suspected Infection is not true, or if Suspected Infection is true and SOFA Total is less than 2, and Adverse Outcome is true, and Viral Infection is noted in the discharge summary. Confirmed Sepsis
Suspected Infection is true, and SOFA Total is greater than or equal to 2; OR Diagnosed Sepsis is true.
The definition of Suspected Infection, Diagnosed Infection and Confirmed Sepsis provided a criterion for what was defined as a ground truth sepsis case for a given patient in the ED.
Data preprocessing
A comprehensive cleaning and transformation pipeline was implemented to prepare the raw data for modelling. Initially, rows with entirely missing values were excluded. For each patient encounter, vital signs (e.g. Glasgow Coma Scale (GCS), RR, systolic blood pressure (SBP), diastolic blood pressure (DBP), mean arterial pressure (MAP), tympanic temperature (TEMP), oxygen saturation (O2SATS), heart rate (PULSE), see Table 1) were often recorded multiple times. Each vital sign was recorded up to three times representing different time points. If the primary value (e.g. GCS_1) was missing, we checked if GCS_2 or GCS_3 was available and used one of those instead.
Model features.
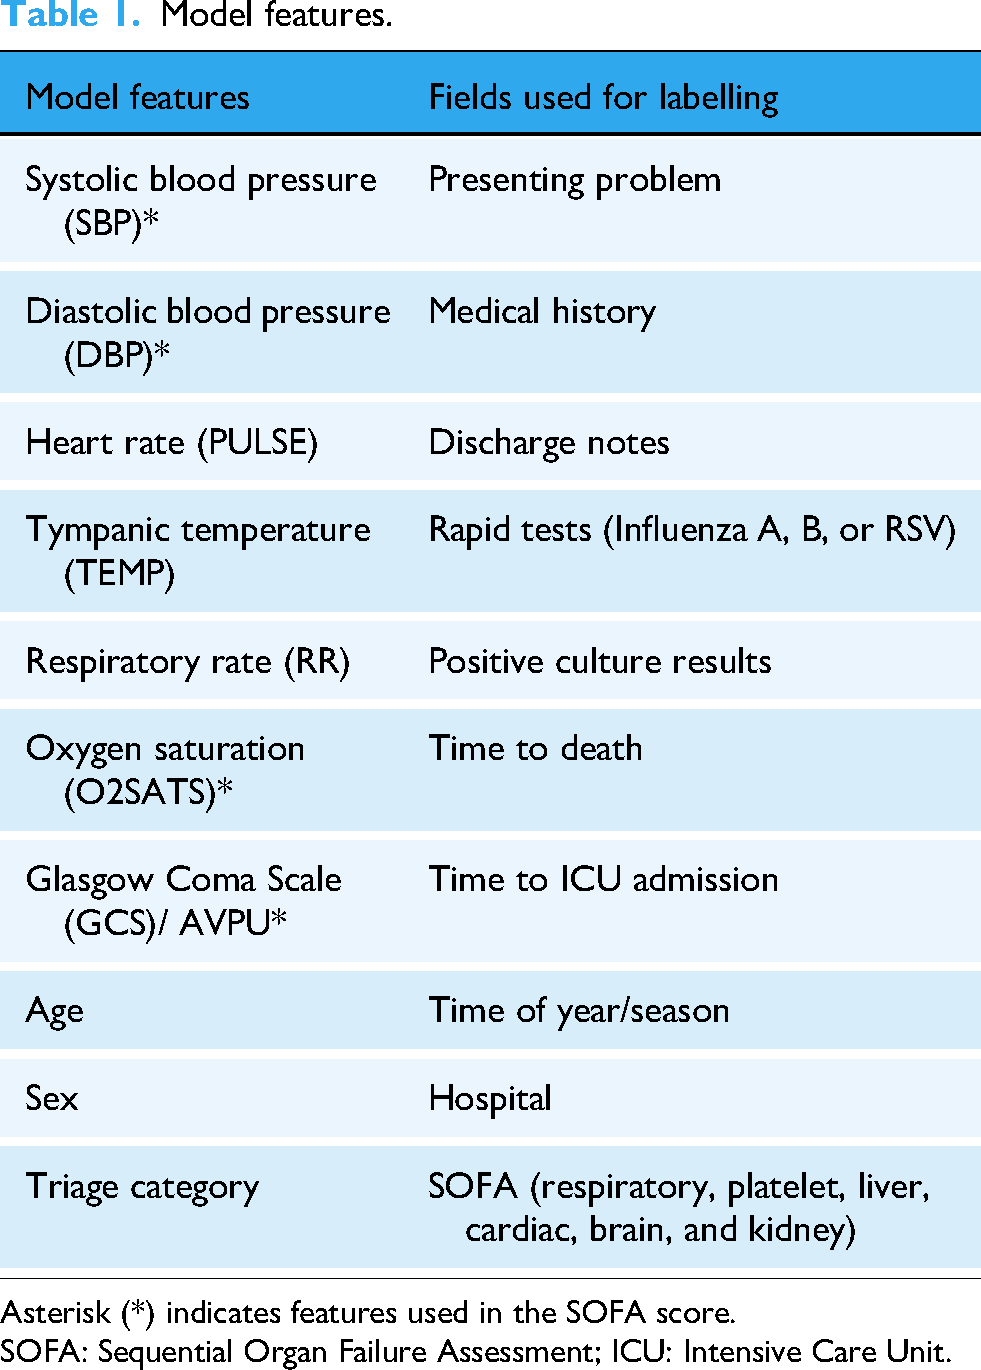
Asterisk (*) indicates features used in the SOFA score.
SOFA: Sequential Organ Failure Assessment; ICU: Intensive Care Unit.
When primary measurements remained unavailable, clinically informed substitutions were applied, for example, MAP was calculated from SBP and DBP, and tympanic temperature was estimated from oral readings.
Text-based discharge diagnoses were parsed using regular expressions to identify mentions of sepsis or infection for sepsis case labelling purposes.
Although no outlier detection methods were applied, thresholds were applied to clinical features to mitigate the influence of extreme and impossible values e.g. age < 150.
Model training
To evaluate model performance, the dataset was randomly partitioned into training, validation, and test sets. A reproducible shuffle was applied using a fixed random seed, after which 70% of the data was allocated for training. The remaining 30% was evenly divided, with 15% used for validation and 15% for testing. Patient-level separation was applied, to assign all encounters from each patient to the corresponding split.
Features and model selection
Within a clinical AI model definition, we used domain knowledge to select limited features only available at initial triage, as detailed in Table 1. The chosen data-driven features were informed by the contextual implementation within the ED waiting room where features such as invasive blood tests were not readily available post patient triage.[Supplementary Material – Human factors study]. Therefore, in near real-time detection, we relied on our model to learn from the pattern using SOFA scores and only input vital signs in Table 1 as a new observation.
To interpret feature importance, SHapley Additive exPlanations (SHAP) values 16 were computed, revealing the relative contribution of each feature to the model's predictions. The most influential features included O2SATS and age, both with SHAP values of 0.046, followed closely by TEMP (0.042), GCS (0.031), and SBP (0.029). Other contributing features were PULSE DBP, RR, and categorical variables such as gender and triage category.
In our study and given the nature of the problem, we selected Extreme Gradient Boosting (XGBoost). A comparison of its performance against baseline models can be found in the results section.
Each selected model underwent an exhaustive search over a predefined parameter space to identify the optimal configuration. Techniques such as grid search were employed to efficiently explore the hyper-parameter space and identify combinations that yield the best performance metrics on validation data.
Machine learning integration
The XGBoost 17 model artefact was deployed as a real-time endpoint in AWS SageMaker. This endpoint was invoked by a Lambda function, which extracted features from HL7 messages stored in an S3 bucket and created a payload for each observation. The new observations consisting of the triage assessment, vital signs, age, and sex served as inputs into the deployed XGBoost ML model to output a sepsis risk score.
This score represented a predicted probability of sepsis occurring for a given patient based on the features at the time of triage. To optimise the model's performance, the receiver operating characteristic (ROC) curve was used to evaluate different cutoff thresholds of probability across different age groups (16–35, 35–65, and 65–115), aiming to maximise sensitivity and minimise false negatives. The threshold was selected based on a trade-off with specificity, with the goal of achieving 80% sensitivity. The score and features were returned to a Lambda function and stored in an Amazon Relational Database Service (RDS) instance.
An interactive user interface was created for the SAFE-WAIT tool, which visualised the risk of sepsis within a dashboard format with interactive functions such tool tips, scrolling, zooming and pop-out boxes. This dashboard enabled clinicians in the ED waiting room to monitor near real-time sepsis risk scores. The risk levels were presented as a percentage and visually flagged as green, yellow, or red, based on age-specific sensitivity thresholds. The dashboard read the data directly from the RDS instance. Additional tables and views were created for reporting and monitoring the performance of the model.
Security and compliance
We use NSW Health's self-managed AWS cloud infrastructure which adhered to strict data privacy and security practices aligned with industry standards. Data exchange was encrypted using AWS Key Management Service and protected with secure authentication protocols. Compliance with Privacy, Security, and Access Framework (PSAF) and Health Insurance Portability and Accountability Act standards was maintained. 18 Data processing occurred within NSW Health's PSAF-approved managed VPC. Access control is strictly enforced via AWS Identity and Access Management.
Evaluation framework and silent trial
The evaluation of the performance of the near real-time sepsis ED detection system involved multiple sources, including receiving monthly eMR records and clinical data from the hospital site. A data pipeline cleaned and prepared the data, enabling assessment of the system's accuracy in detecting sepsis, using both true positives and missed cases. The evaluation of model performance result is shown in the supplementary material, while the clinical evaluation allowed measures of broader healthcare outcomes, such as reductions in ICU re-admissions and sepsis-related deaths highlighting the system's impact on patient outcomes.13,14 The system's architecture allowed for a silent trial, where the model can be evaluated with prospective real-time patients in minimal risk environments.13,19 After the silent trial, evaluation should be progressively tested in a pilot implementation of the SAFE-WAIT tool within existing workflows to optimise behavioural insights for adoption.
Result
Model development – baseline comparison
To justify the adoption of XGBoost over simpler methods, we compared its performance with two alternative models: SageMaker Linear Learner and a baseline Logistic Regression model with age group thresholds (Tables 2 and 3).
Performance comparison of three machine learning models for sepsis prediction.

XGBoost: Extreme Gradient Boosting.
Performance of three machine learning models for sepsis prediction across different age groups.

XGBoost: Extreme Gradient Boosting.
While the logistic model achieved reasonable sensitivity (0.80) across all patients, its specificity (0.61) and precision (0.61) were notably lower than those of XGBoost (specificity 0.84, precision 0.84). Linear Learner performed comparably to XGBoost in some global metrics. The XGBoost model achieved the highest overall accuracy (0.84) and F1-score (0.80), with balanced sensitivity and specificity. Logistic regression, while achieving high sensitivity (0.80), showed lower specificity and precision, indicating more false positives. All models were evaluated at their respective probability thresholds. These results suggest that XGBoost not only matches but exceeds the performance of traditional models, justifying its use for this task.
Model development – age group model performance
Subgroup analysis using age-specific probability thresholds revealed that XGBoost maintained a favourable balance between sensitivity and specificity across all age groups, achieving the highest accuracy and F1-score in younger populations. Linear Learner exhibited a marked drop in specificity for younger patients, falling to 0.42 despite achieving a high sensitivity of 0.88, and showed lower overall accuracy in the 16–35 age group. Logistic Regression demonstrated relatively consistent sensitivity across groups but persistently low specificity, particularly in the oldest cohort, and reduced precision, indicating a higher rate of false positives. Collectively, these results indicate that XGBoost offers the most favourable trade-off between sensitivity and specificity, delivers high precision, and maintains consistent performance across subgroups, outperforming simpler baseline models in both aggregate and stratified analyses.
ROC analysis (Figure 3) was performed across three age groups to evaluate the discriminative performance of the XGBoost binary classifier. For the 16–35 age group, the model achieved an AUC of 0.864 with an optimal threshold of 0.0224, indicating great sensitivity at low probability cutoffs. In the 36–65 cohort, the model performed similarly well with an AUC of 0.867 and an optimal threshold of 0.0556. For the 66–115 age group, the model maintained strong performance with an AUC of 0.806 and an optimal threshold of 0.1902. These results demonstrate the model's robustness and generalizability across diverse age groups.

Receiver operating characteristic (ROC) analysis curves for XGBoost classifiers across age groups (16–35, 36–65, 66–115), showing strong performance in all cohorts (AUCs: 0.864, 0.867, 0.806). XGBoost: Extreme Gradient Boosting.
Architecture tests
As the sepsis detection algorithm went live in the ED, a total of (N = 1,802,370) HL7 messages were processed between August 2021 and June 2024, with 99.7% successfully processed and 0.3% failing (Table 1). Success rates were consistently high across years. The largest volume of messages occurred in 2023, with (N = 724,884) processed, of which (N = 5685) failed (99.2% success rate). The failures here are due to downtime and code set mismatches from updates or missing data in the HL7 messages.
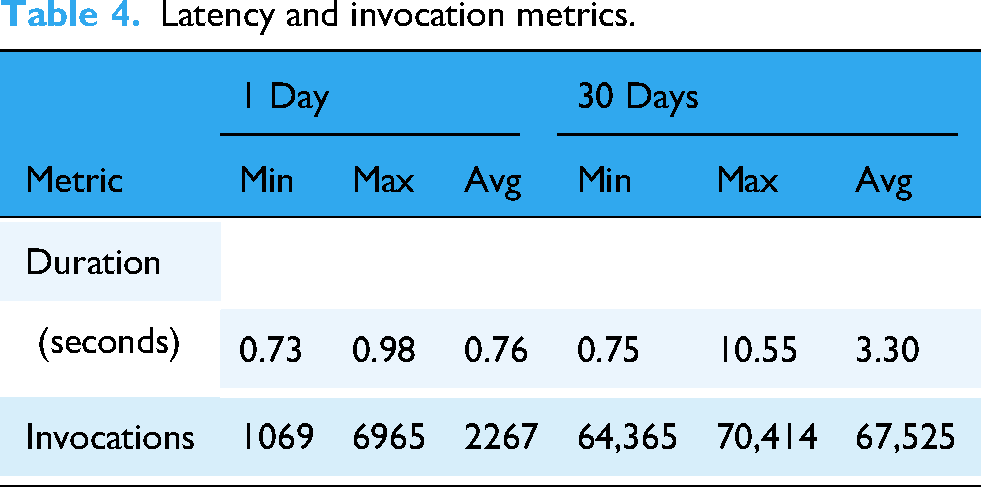
A summary of key metrics of latency and invocation is provided in Table 4, where the sepsis-data-transformation function processes incoming HL7 messages for scoring. It performed an average execution time of 3.3 s over a 30-day period. While the minimum duration was 0.75 s, peak execution times reached 10.5 s. This variability is likely due to factors such as fluctuating payload sizes, network latencies, and the time required for data retrieval from S3 before transformation processes.
Latency and invocation metrics.
Discussion
The system architecture demonstrates robust performance for near real-time sepsis detection with key benefits. Fault tolerance and high availability are ensured through multi-AZ RDS deployments, enabling disaster recovery and regular backups with options for cross-region replication. The serverless design ensures seamless scalability, enabling the system to process large volumes of HL7 messages without performance degradation. Lambda and S3 dynamically handle fluctuating demands, offering both efficiency and cost savings. The event-driven design ensures compute resources are used only when triggered, eliminating costs associated with idle infrastructure. However, cost analysis reveals opportunities to explore alternatives for data storage such as on-premises databases or DynamoDB.
The architecture is well suited to be implemented for additional facilities in the future by leveraging serverless components, with minimal re-configuration of processing and scoring of HL7 messages. System design embeds modularity and flexibility at its core, allowing the migration of its ‘brain’ – the cloud infrastructure and core components e.g. XGBoost model to accommodate institutional needs. This means that the architecture can transition between different cloud providers or hybrid setups based on cost, compliance, or operational requirements. This enables integration of additional features or hospital systems without requiring significant changes to the existing infrastructure.
Cost analysis shows that for the current workflow, RDS accounts for 73% of total system expenses, highlighting a key opportunity for total cost of ownership reduction. 20 To address this, the system could explore hybrid infrastructure alternatives such as Amazon Aurora Serverless or self-managed PostgreSQL database servers as it can save costs when DB is idle and automatically scale to demand. Additional savings can be achieved by using RDS Reserved Instances.
The average message processing latency was 3.3 s, with a maximum of 10.5 s over a 30-day period. This level of latency did not impact immediate clinical flow. However, the more significant limitation was the small proportion of failed messages. In 2023, the system processed a large volume of messages (N = 724,884), with a 99.22% success rate prior to 2024 with its’ 99.99% success rate (see Table 5). The (N = 5685) failed messages were primarily due to downtime or/and code set mismatches from updates or missing data in the HL7 messages. Assuming each failed message corresponds to a unique patient encounter, and given a sepsis detection rate of 6.17%, approximately 351 potential sepsis cases may have been missed due to these failures in 2023. It is important to note that not every HL7 message corresponds to a unique patient; a single patient encounter may generate multiple HL7 messages. Therefore, the number of failed messages represents an upper bound, and the actual number of patients potentially affected is likely much lower.
Processed HL7 messages: Success vs failure.

This further emphasises that architectural systems need to be robust in detecting downtime or unprocessed messages that failed to go through. Following the improvements in 2024, the message success rate increased to 99.99%, substantially reducing the potential risk of missed detections (N = 12,<1patient) and further supporting reliable clinical decision support.
S3 event notifications are not always instantaneous and can be delayed or missed which may lead to latency in downstream workflows. When a high volume of S3 events occurs in rapid succession, Lambda can become overwhelmed. This was observed when our system demonstrated a higher latency or missed messages as previously discussed. Introducing a Simple Queue Service queue between S3 and Lambda can help with throttling, buffering, and retry logic. If a Lambda function fails after being triggered, the event is recorded but not reprocessed by default. To address this, future versions of the system should incorporate a retry mechanism, for example using a Dead Letter Queue to capture and retry failed events. 21
Our SAFE-WAIT tool utilises ML model development that is targeted for our cohort to address the limited features available in the ED waiting room and risk-stratification using age groups. The use of largely proprietary sepsis alerting systems has resulted in mixed results, largely negative except a recent study by Cull and colleagues. 9 In an uncontrolled before-and-after study, Cull et al. (2023) observed a 44% reduction in the odds of sepsis-related mortality after implementation of the Epic Sepsis Model alert (threshold ≥ 5). 9 Most EPIC sepsis alert models use the developer recommended10,12 threshold ≥ 6, and recent external validation studies show sub-optimal diagnosis alerting assistance missing 67% patients with sepsis with AUC = 0.63, 10 no better than current clinical practice and with reports of potential alert fatigue. 10 This shows the vital need for prospective multi-site validation when scaling up the solution. Current research including our study indicates that targeted validation 22 should be required for any sepsis alerting system prior to deployment. The use of silent trials as part of prospective multi-site validation is a sensible bridge prior to wide-spread deployment and should be evaluated during implementation. 19
Limitations
The SAFE-WAIT tool was evaluated only at a single site ED due to the nature of the pilot. The on-premises proprietary dashboard for clinical decision support was not integrated into the eMR system but existed as a separate web-app visualisation tool, outside the usual clinical workflow.
SageMaker is used for inference, but there is no monitoring for data drift implemented but in future model monitoring should be considered to detect various data drifts like input features, data quality, inference etc. to maintain model performance including when high volume issues remained unprocessed.
Latency of downstream information processing might impact urgent clinical decision-making and the evaluation of potential sepsis cases, and the number of cases might potentially be underestimated by SAFE-WAIT tool, as discussed.
Conclusion
Our study has demonstrated a piloted system architecture that is robust, scalable, serverless and secure for near real-time sepsis detection and management. By leveraging an event-driven, serverless design, the system ensures seamless data processing, high availability and efficient scalability potential across multiple hospitals. However, cost and latency considerations remain a challenge; the architecture's modular design provides flexibility for future optimisation.
We have demonstrated that it is possible to develop a model that is robust within current clinical workflows and considers types of data availability within the ED when identifying cases of sepsis in the waiting room, integrating this model into our architecture for near real-time insights. Human factors insights are critical to identify model usability and the process of comprehensive evaluation should have a silent phase leading to an implementation pilot to optimise human–computer interaction and behavioural insights for integration and adoption. This technical blueprint for an Australian-first clinical AI ED deployment not only addresses current clinical needs but also lays a foundation for enabling broader deployment in adoption of targeted validation and more advanced scalable features in the future.
Supplemental Material
sj-pdf-1-dhj-10.1177_20552076251389389 - Supplemental material for Decoding sepsis: A technical blueprint for an algorithm-driven system architecture
Supplemental material, sj-pdf-1-dhj-10.1177_20552076251389389 for Decoding sepsis: A technical blueprint for an algorithm-driven system architecture by Abdullah Safi, Mostafa Shaikh, Minh Trang Hoang, Amith Shetty, Gladis Kabil and Audrey P Wang in DIGITAL HEALTH
Supplemental Material
sj-pdf-2-dhj-10.1177_20552076251389389 - Supplemental material for Decoding sepsis: A technical blueprint for an algorithm-driven system architecture
Supplemental material, sj-pdf-2-dhj-10.1177_20552076251389389 for Decoding sepsis: A technical blueprint for an algorithm-driven system architecture by Abdullah Safi, Mostafa Shaikh, Minh Trang Hoang, Amith Shetty, Gladis Kabil and Audrey P Wang in DIGITAL HEALTH
Supplemental Material
sj-docx-3-dhj-10.1177_20552076251389389 - Supplemental material for Decoding sepsis: A technical blueprint for an algorithm-driven system architecture
Supplemental material, sj-docx-3-dhj-10.1177_20552076251389389 for Decoding sepsis: A technical blueprint for an algorithm-driven system architecture by Abdullah Safi, Mostafa Shaikh, Minh Trang Hoang, Amith Shetty, Gladis Kabil and Audrey P Wang in DIGITAL HEALTH
Footnotes
Acknowledgements
The authors would like to acknowledge collaborating staff from: WSLHD specifically the emergency department and ICT teams, eHealth NSW, NSW Pathology, CEC, NSW Ministry of Health and The University of Sydney without whose support the sepsis SAFE-WAIT project would not be feasible.
Ethical considerations
This study was approved by WSLHD Human Research Ethics Committee (2019/ETH09607) on 24 October 2019 for the model development and (2020/ETH03269) on 14 May 2021 for the risk-stratification dashboard evaluation. This project approval included a Privacy and Security Framework assessment by NSW Health and adheres to data privacy standards with the use of government HIPPA complaint servers.
Author contributions
AbS contributed to conceptualisation, methodology, software, data curation, investigation and writing – original draft preparation; MS contributed to conceptualisation, methodology, validation, formal analysis, investigation and writing – review & editing; MTH contributed to methodology, investigation and writing – review & editing; AmS contributed to conceptualisation, methodology, investigation, resources and writing – review & editing. GB contributed to methodology, investigation and writing – review & editing; APW contributed to conceptualisation, methodology, investigation, supervision and writing – review & editing
Funding
The author(s) disclosed receipt of the following financial support for the research, authorship, and/or publication of this article: A P Wang acknowledges funding from Westmead Early Career Research Fellowship, Research Education Network, Western Sydney Local Health District, Australia. eHealth NSW contributed in-kind support, funding for the project and publication.
Declaration of conflicting interests
The author(s) declared no potential conflicts of interest with respect to the research, authorship, and/or publication of this article.
Supplemental material
Supplemental material for this article is available online.
References
Supplementary Material
Please find the following supplemental material available below.
For Open Access articles published under a Creative Commons License, all supplemental material carries the same license as the article it is associated with.
For non-Open Access articles published, all supplemental material carries a non-exclusive license, and permission requests for re-use of supplemental material or any part of supplemental material shall be sent directly to the copyright owner as specified in the copyright notice associated with the article.