
Abstract
Objective
Depression is increasingly becoming a global concern among older adults. Many existing studies have found an association between Internet use and mental health in later life. However, most of this research has relied on a variable-centered approach, which may overlook the heterogeneity in Internet use behaviors. We adopted a person-centered approach to explore distinct patterns of Internet use and their associations with depressive symptoms among older adults.
Methods
Using data from the 2022 China Family Panel Studies, 3975 older adults (aged ≥ 60 years) reported their Internet use and depressive symptoms after excluding samples with missing core values. Latent class analysis (LCA) was employed to analyze the potential classification of Internet use.
Results
LCA identified three distinct Internet use profiles: low digital engagement (Class 1, 51.4%), active social engagement (Class 2, 36.1%), and high comprehensive digital engagement (Class 3, 12.5%). Compared to Class 1, both Classes 2 and 3 showed negative associations with depressive symptoms. Heterogeneity analyses revealed that adults under 70 years, males, and rural residents demonstrated stronger associations between Internet use and reduced depressive symptoms.
Conclusion
Internet use has a significant negative impact on depressive symptoms. The results provide an empirical reference for the prevention and intervention of mental disorders in older adults.
Introduction
With the rapid growth of global aging, depression has become a significant risk factor, associated with increased disability, higher mortality rates, 1 and a greater prevalence of comorbidities. 2 Due to the spread of the COVID-19 pandemic and prolonged economic pressures, the incidence of depression has increased rapidly around the world. 3 It is particularly important to note that depression not only directly harms the physical health of older adults, but also complicates their care, as it is often associated with other health problems. 4 In this context, it is extremely important to conduct exhaustive research into the causes of depression and to investigate effective interventions to reduce its prevalence.
With the improvement of Internet accessibility, Internet use rates among older adults continued to grow. Amichai-Hamburger and Ben-Artzi 5 pointed out that the Internet has evolved from a uniform and single platform into a complex network system offering a variety of services. Schehl et al. 6 identified three main reasons why older adults participate in online activities, including informational purposes (such as watching videos, reading news, and accessing health information), social purposes (connecting with friends and family), and instrumental purposes (such as banking, shopping, and taking online courses). Several studies confirmed that the mental health of older adults can be improved through digital technology. According to the Amplification Theory of Technology, Internet use enabled older adults to maintain their existing relationships and expand their social networks, which can have a positive impact on their mental health. 7 Previous studies have shown a correlation between the use of digital technology and reduced depressive symptoms among older adults.8,9
Current research focuses on how specific digital platforms and applications affect mental health. Zhang and Liang 10 noted that the use of WeChat helps middle-aged and older adults improve their mental health by maintaining close social relationships and building trust between people. Similarly, studies have shown that short video platforms strengthen social bonds, provide social support, and can slow cognitive decline in older adults.11,12 In addition to social media, Liu and Guo 13 have found that mobile payment applications significantly improve the physical and mental health of older adults.
Existing studies mainly use factor analysis or classification by functional dimensions to classify Internet usage patterns. Although these methods provide valuable insights, their internal limitations should not be underestimated. They fail to accurately reflect dynamic individual changes in Internet use patterns and may not consider important specific information about individuals. Consequently, the association between Internet use patterns and depression has not yet been systematically explained.
To overcome the above limitations, the study employed the latent class analysis (LCA) method to address the limitations of these issues. As a person-centered approach, LCA can identify subgroups of individuals who possess similar characteristics and ensure that individuals in the same group exhibit comparable patterns in the observed variables. 14 Although this method cannot overcome the limitations of cross-sectional data in terms of drawing causal conclusions, it accurately identified heterogeneous patterns of Internet user behavior in a single sample. 15 The classification of LCA is model-based, and the quality of these classifications can be evaluated using statistical diagnostic tools. 14 Based on the data of the China Family Panel Study (CFPS) in 2022, we explored the relationship between Internet use patterns and depressive symptoms of the older adults.
Methods
Study population and sample
This study extracted data from CFPS. CFPS consists of seven waves with baseline surveys conducted in 2010, and subsequent evaluations conducted every 2 years until 2022. CFPS conducted interviews with family members at different developmental stages (from childhood to old age) in selected households. Data collection involved conducting face-to-face interviews using standardized questionnaires to gather information on sociodemographic factors, lifestyle behaviors, and mental health status. CFPS had been approved by the Biomedical Ethics Review Committee of Peking University (ID: IRB00001052-14010).
The current research is a secondary analysis of prospective data from CFPS. If participants met the following criteria, they were included (1) age 60 years or older; (2) having complete information on the Center for Epidemiological Studies Depression Scale (CES-D) scores in 2022; and (3) having complete information on Internet use. As a result, the final sample size was 3975.
Dependent variable
This study used the CES-D to evaluate depressive symptoms. The CFPS 2022 survey adopted an 8-item condensed version. Participants rated the frequency of each item in the past week on a 4-point scale: 0 = not at all, 1 = several days, 2 = more than half of the days, and 3 = almost every day. The Chinese version of CES-D had been used in previous research, and its reliability and validity have been tested among Chinese populations.16,17 The total score was from 0 to 24, with higher scores indicating more severe depressive symptoms. The Cronbach's alpha coefficient of the CES-D-8 in this study was 0.781.
Independent variable
We consider six variables to capture respondents’ Internet use patterns: playing online games, online shopping, watching short videos, online studying, using WeChat, and sharing content on WeChat moments. They are all measured as binary variables, with “no” coded as 0 and “yes” coded as 1.
Covariates
Building upon previous studies,18,19 the following variables were included as covariates in this study: age, sex, education level, marital status, residence, employment status, exercise frequency, self-reported health status, the number of chronic diseases, drinking status, smoking status, life satisfaction, and region.
Statistical analysis
First, baseline characteristics were described as means and standard deviations for normally distributed continuous variables, and frequencies with percentages for categorical variables. Data are summarized according to Internet use categories and compared using the chi-square test and ANOVA, as appropriate.
Second, we employed an LCA approach to identify distinct patterns of Internet use. As a typical unsupervised machine learning method, 20 LCA was performed to classify participants into homogenous classes or groups based on a set of observed variables. 21 The LCA was conducted using R software to fit models with a varying number of latent classes, ranging from one to six. The fit of each model was assessed using three criteria: the Akaike information criterion (AIC), the Bayesian information criterion (BIC), and the entropy. Specifically, smaller AIC and BIC indicate better model fit. Entropy is used to evaluate the classification accuracy of the model, ≥ 0.8 means the classification accuracy is > 90%. 22 Additionally, all models should exhibit a minimum profile proportion above 5%, a criterion recommended by Tein et al. 23 to ensure representativeness. Since LCA is an unsupervised method, we selected random forest—a supervised machine learning algorithm with demonstrated effectiveness in classification tasks—to assess whether the data-driven clusters from LCA could be reliably reproduced. The dataset was randomly split into 70% training and 30% testing sets. Five-fold cross-validation was conducted within the training set, and the optimal hyperparameter values were selected to improve model performance.
Third, the variance of depressive symptoms exceeded the mean, making Poisson regression inappropriate. Therefore, we used quasi-Poisson regression, which allows the variance to differ from the mean and provides more reliable estimates.
R version 4.4.1 (R Foundation for Statistical Computing, Vienna, Austria) was used to analyze the data and perform descriptive statistics for each variable. LCAs were performed using Mplus version 8.3.
Results
Evaluation and selection of the LCA model
Table 1 presents the LPA fit indices from 1-class to 6-class models. We selected the three-class model for the following reasons: Firstly, it demonstrated optimal performance in terms of AIC (14993.63) and BIC (15119.38), showing relatively low values among all models. Secondly, the three-class model has a robust entropy value (0.816), indicating good classification quality. Thirdly, the three-class model showed a clear distinction with meaningful class proportions (51.42%/36.07%/12.50%), where all classes exceeded 5% of the sample size. In contrast, both the four-class and five-class models included at least one class comprising < 5% of the sample.
Fit statistics results of the LCA.

Note. LCA: latent class analysis; AIC: Akaike information criterion; BIC: Bayesian information criterion; aBIC: adjusted BIC; LMR: Lo–Mendell–Rubin adjusted likelihood ratio test; BLRT: bootstrapped likelihood ratio test.
The number and structure of latent classes may vary with different sample sizes or observed variables. Therefore, we performed cross-validation to validate the latent classes. 24 We assessed the performance of the random forest model through 5-fold cross-validation, and the results demonstrated its strong predictive capability, with an accuracy of 0.901, recall of 0.911, precision of 0.921, and an F1 score of 0.912.
Figure 1 exhibits the cluster-specific estimated probabilities of Internet use patterns for the three-class model from LCA. Class 1 (51.4%), named “low digital engagement,” was characterized by low probabilities across all Internet activities. Class 2 (36.1%), termed “active social engagement,” exhibited high probabilities of WeChat use and video consumption. Class 3 (12.5%), labeled “high comprehensive digital engagement,” exhibited high probabilities across all dimensions, particularly in shopping, video watching, and WeChat use, demonstrating comprehensive digital engagement.
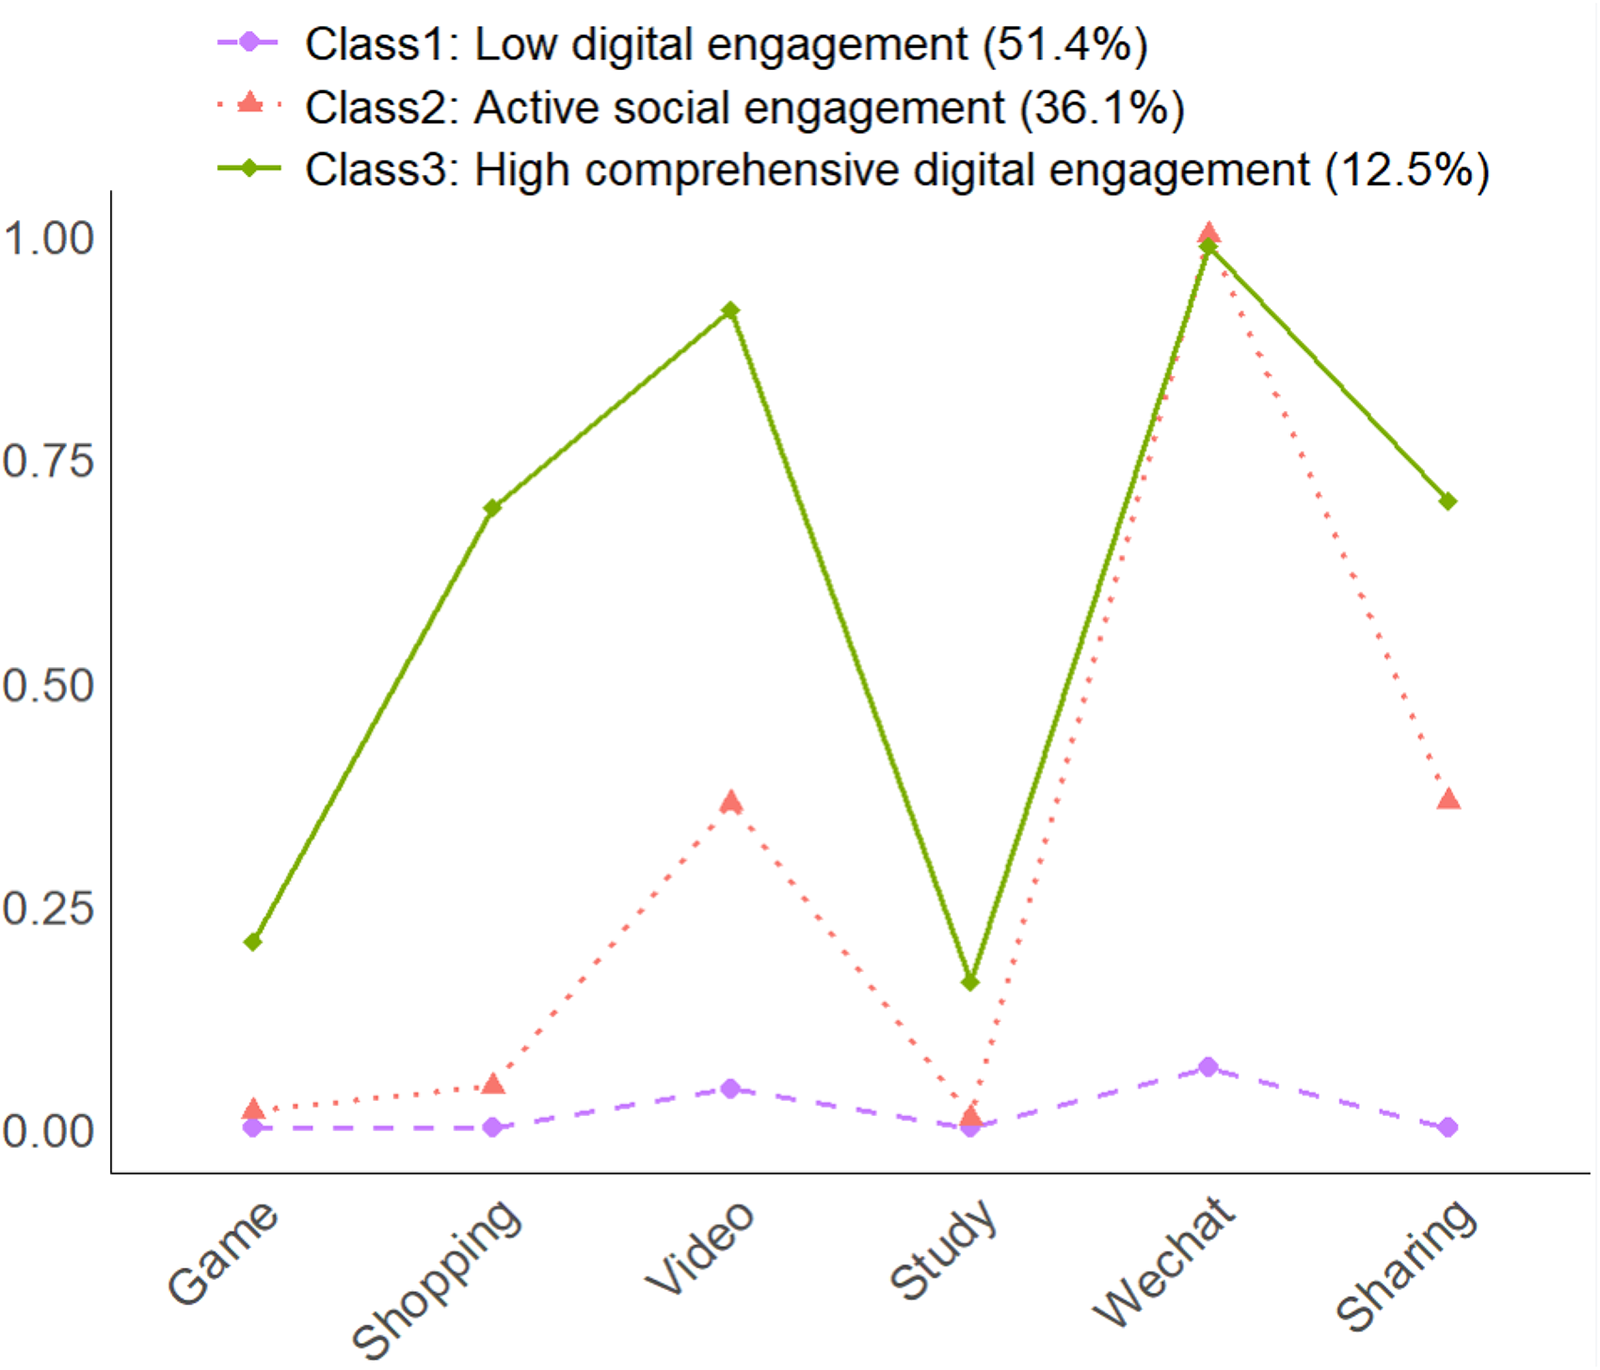
Conditional probabilities of three-class Internet use by latent class. Note. The definition of the classes: Class 1, low digital engagement; Class 2, active social engagement; and Class 3, high comprehensive digital engagement.
Sample characteristics
Based on Table 2, this study analyzed 3975 participants across three Internet use patterns, with Class 1 (low digital engagement) comprising 2044 participants (51.4%), Class 2 (active social engagement) including 1434 participants (36.1%), and Class 3 (high comprehensive digital engagement) containing 497 participants (12.5%).
Baseline characteristics of the total sample and the sample by the different pattern groups. a

Data are presented as counts (percentages) unless otherwise indicated.
p value determined using χ2 test or analysis of variance F-test.
For continuous variables, mean (SD) for each group and significance from analysis of variance F-test are reported.
The definition of the classes: Class 1, low digital engagement; Class 2, active social engagement; and Class 3, high comprehensive digital engagement.
Class 1 (low digital engagement) exhibited the highest depressive symptoms score (6.28), the lowest average Internet use time (0.05 hours), the oldest mean age (70.13 years), the lowest educational attainment (4.73 years), and the highest proportion of rural residence (89.3%). This group also demonstrated challenges in health behaviors, with 68.2% reporting no regular exercise (p < 0.001) and lower self-rated health scores (2.60). In contrast, Class 3 (high comprehensive digital engagement) is characterized by the lowest depressive symptoms score (4.72), the longest Internet usage duration (1.47 hours), the youngest mean age (66.03 years), the highest educational level (10.39 years), the highest proportion of urban residence (40.6%), and the highest proportion of individuals engaging in frequent exercise (≥5 times per week: 49.3%).
Notably, several variables showed no significant differences across groups, including sex (p = 0.511), chronic disease status (p = 0.058), smoking status (p = 0.248), and drinking status (p = 0.949).
Relationship between Internet use and depressive symptoms
Table 3 presents the quasi-Poisson regression results for the association between Internet use patterns and depressive symptoms, with Class 1 (low digital engagement) serves as the reference group. Models 1 and 3 included only independent variables, while Models 2 and 4 incorporated additional control variables. Based on Model 2, both Class 2 (−0.027, p < 0.01) and Class 3 (−0.043, p < 0.001) showed significant negative associations with depressive symptoms compared to Class 1. Model 4 revealed that compared to non-Internet users, 2–3 hours per day had the strongest protective effect against depression (−0.077, p < 0.001), while more than 3 hours showed no significant association.
Association between Internet use patterns and depressive symptoms by quasi-Poisson regression models (reference: Class 1, low digital engagement).
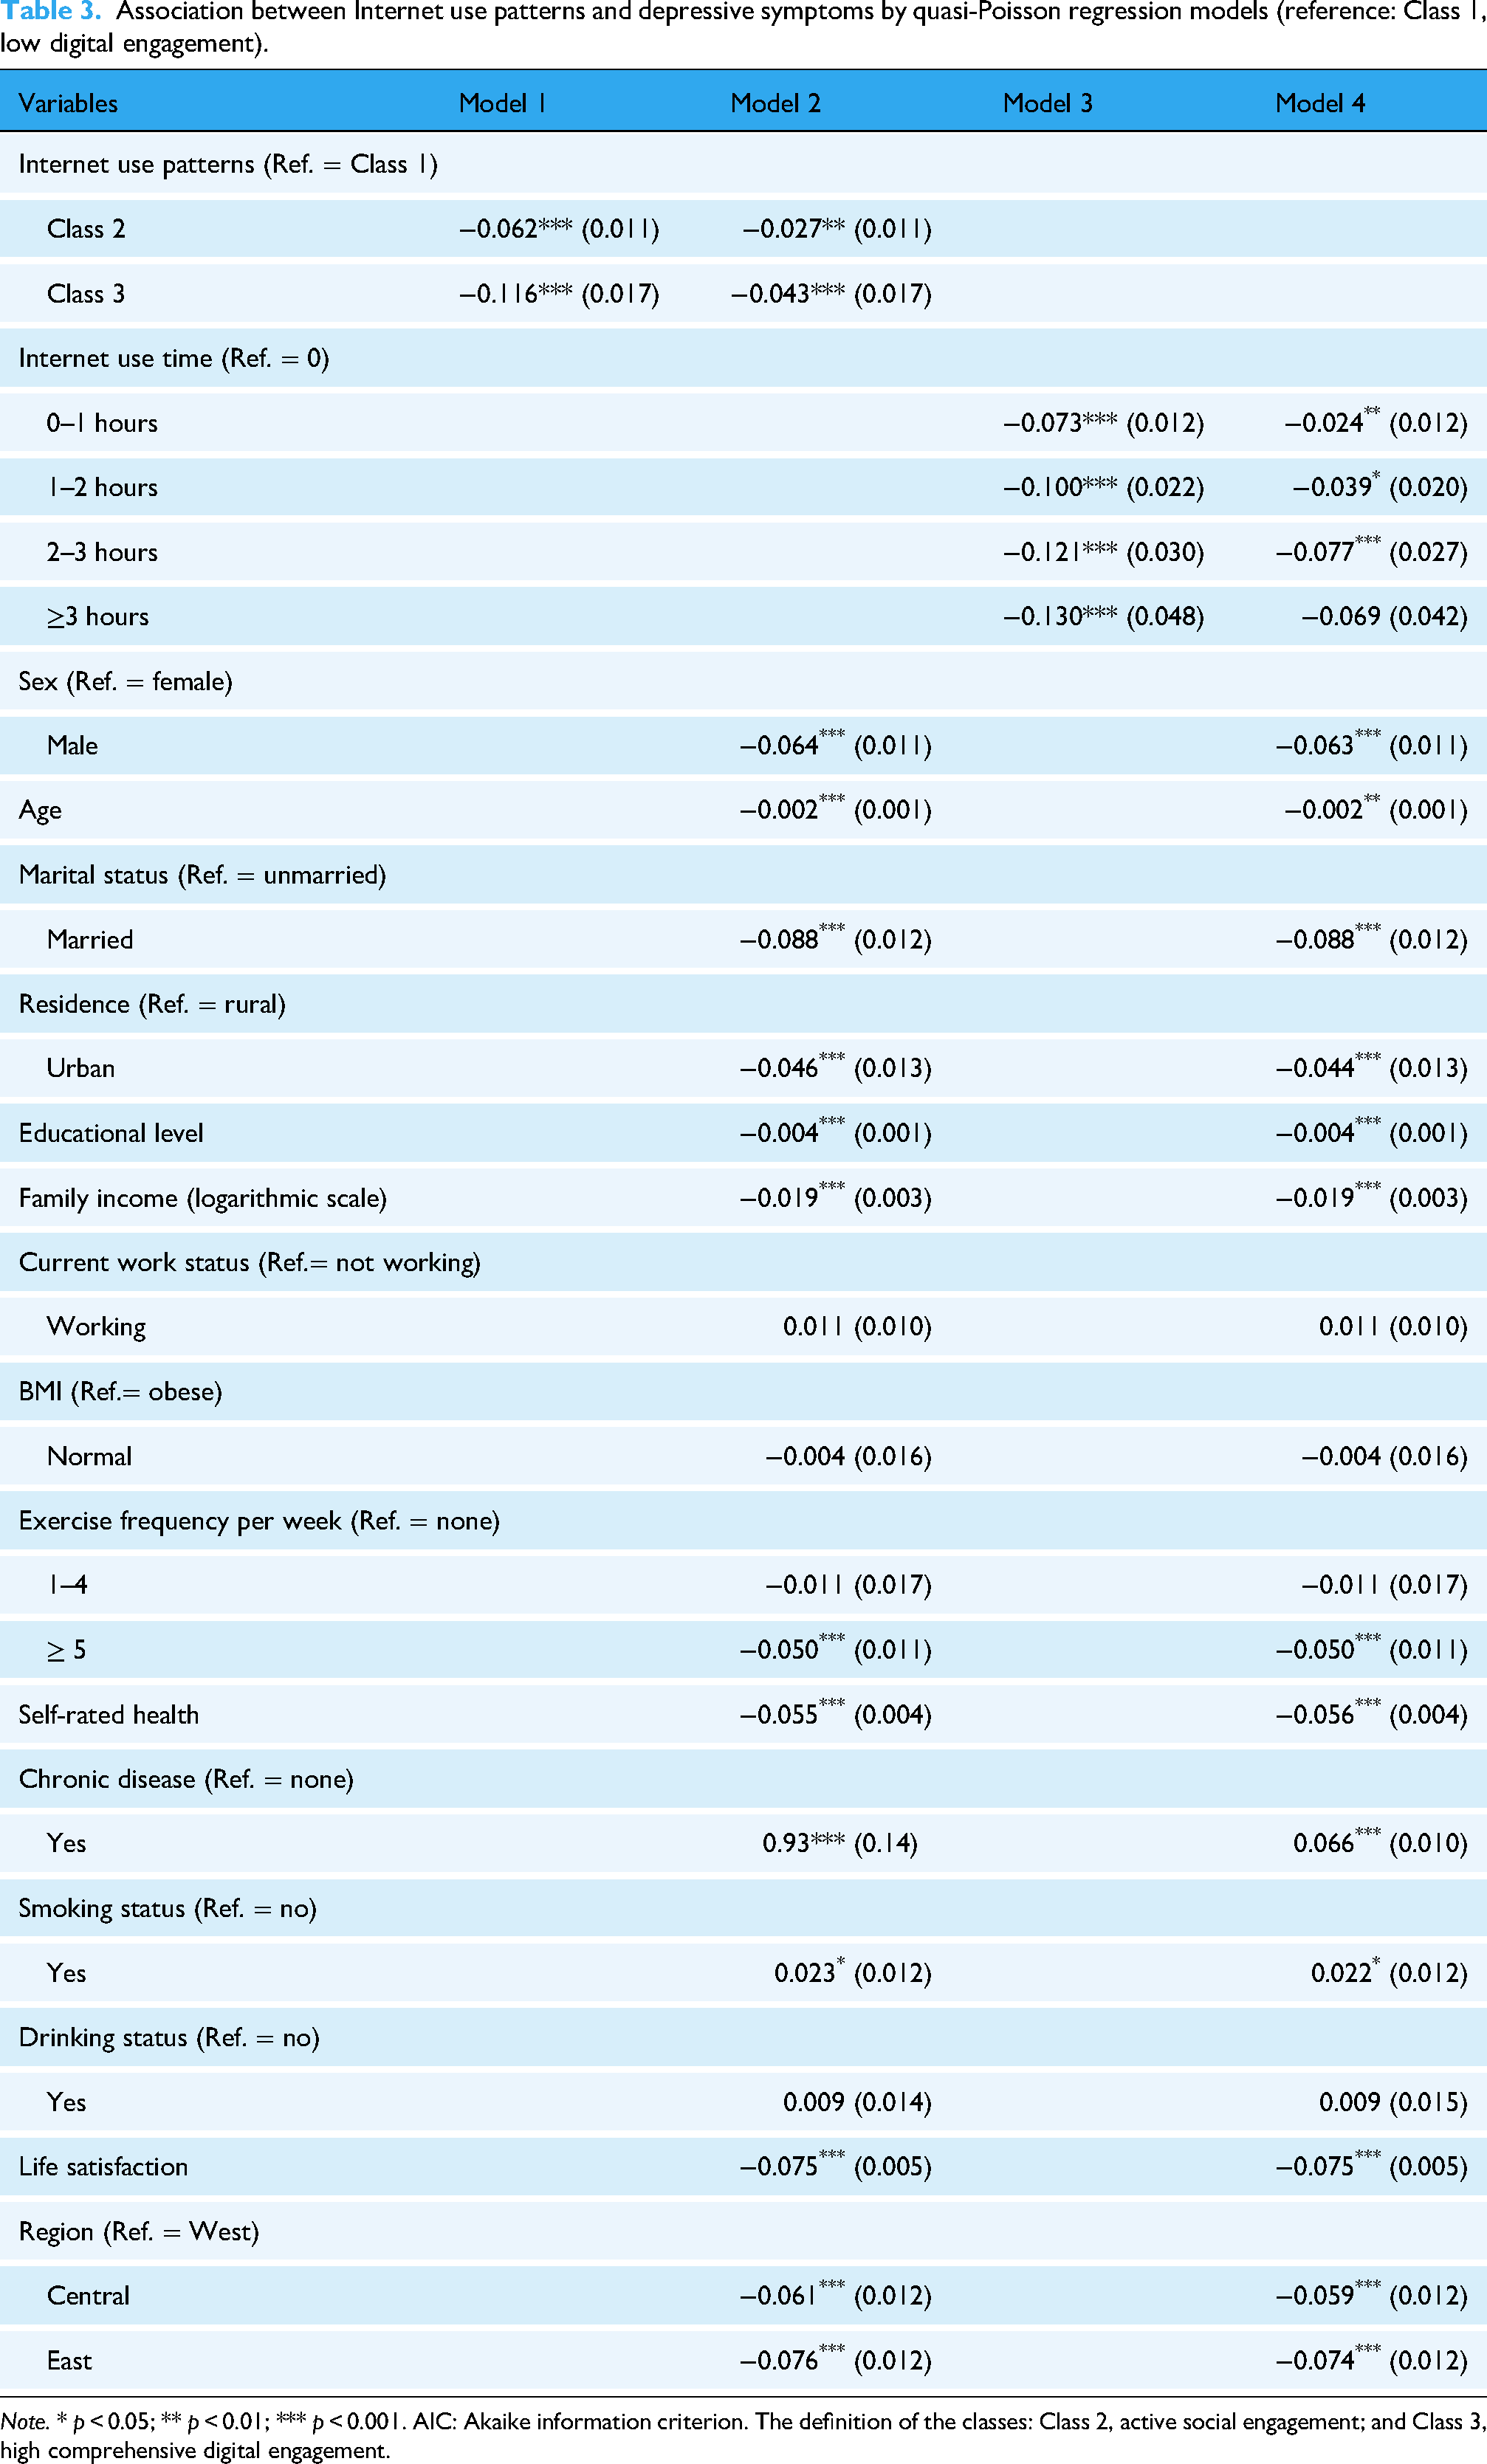
Note. * p < 0.05; ** p < 0.01; *** p < 0.001. AIC: Akaike information criterion. The definition of the classes: Class 2, active social engagement; and Class 3, high comprehensive digital engagement.
In Model 2, being male (−0.064, p < 0.001), older age (−0.002, p < 0.01), being married (−0.088, p < 0.001), urban residence (−0.046, p < 0.001), higher education (−0.004, p < 0.001), higher family income (−0.019, p < 0.001), exercising at least five times per week (−0.050, p < 0.001), better self-rated health (−0.055, p < 0.001), greater life satisfaction (−0.075, p < 0.001), and residence in the central (−0.061, p < 0.001) and eastern regions (−0.076, p < 0.001) were all negatively associated with depressive symptoms. Conversely, chronic disease (0.066, p < 0.001) and smoking (0.023, p < 0.05) showed a significant positive association with depressive symptoms.
The results of the restrictive cubic splines (RCSs) on the association between Internet use time and depressive symptoms are shown in Figure 2. A significant nonlinear association was observed between Internet use time and depressive symptoms (p-overall association = 0.028, p-nonlinearity = 0.034). The level of depressive symptoms declined sharply as Internet use increased from 0 to 2 hours per day, after which the curve gradually plateaued.
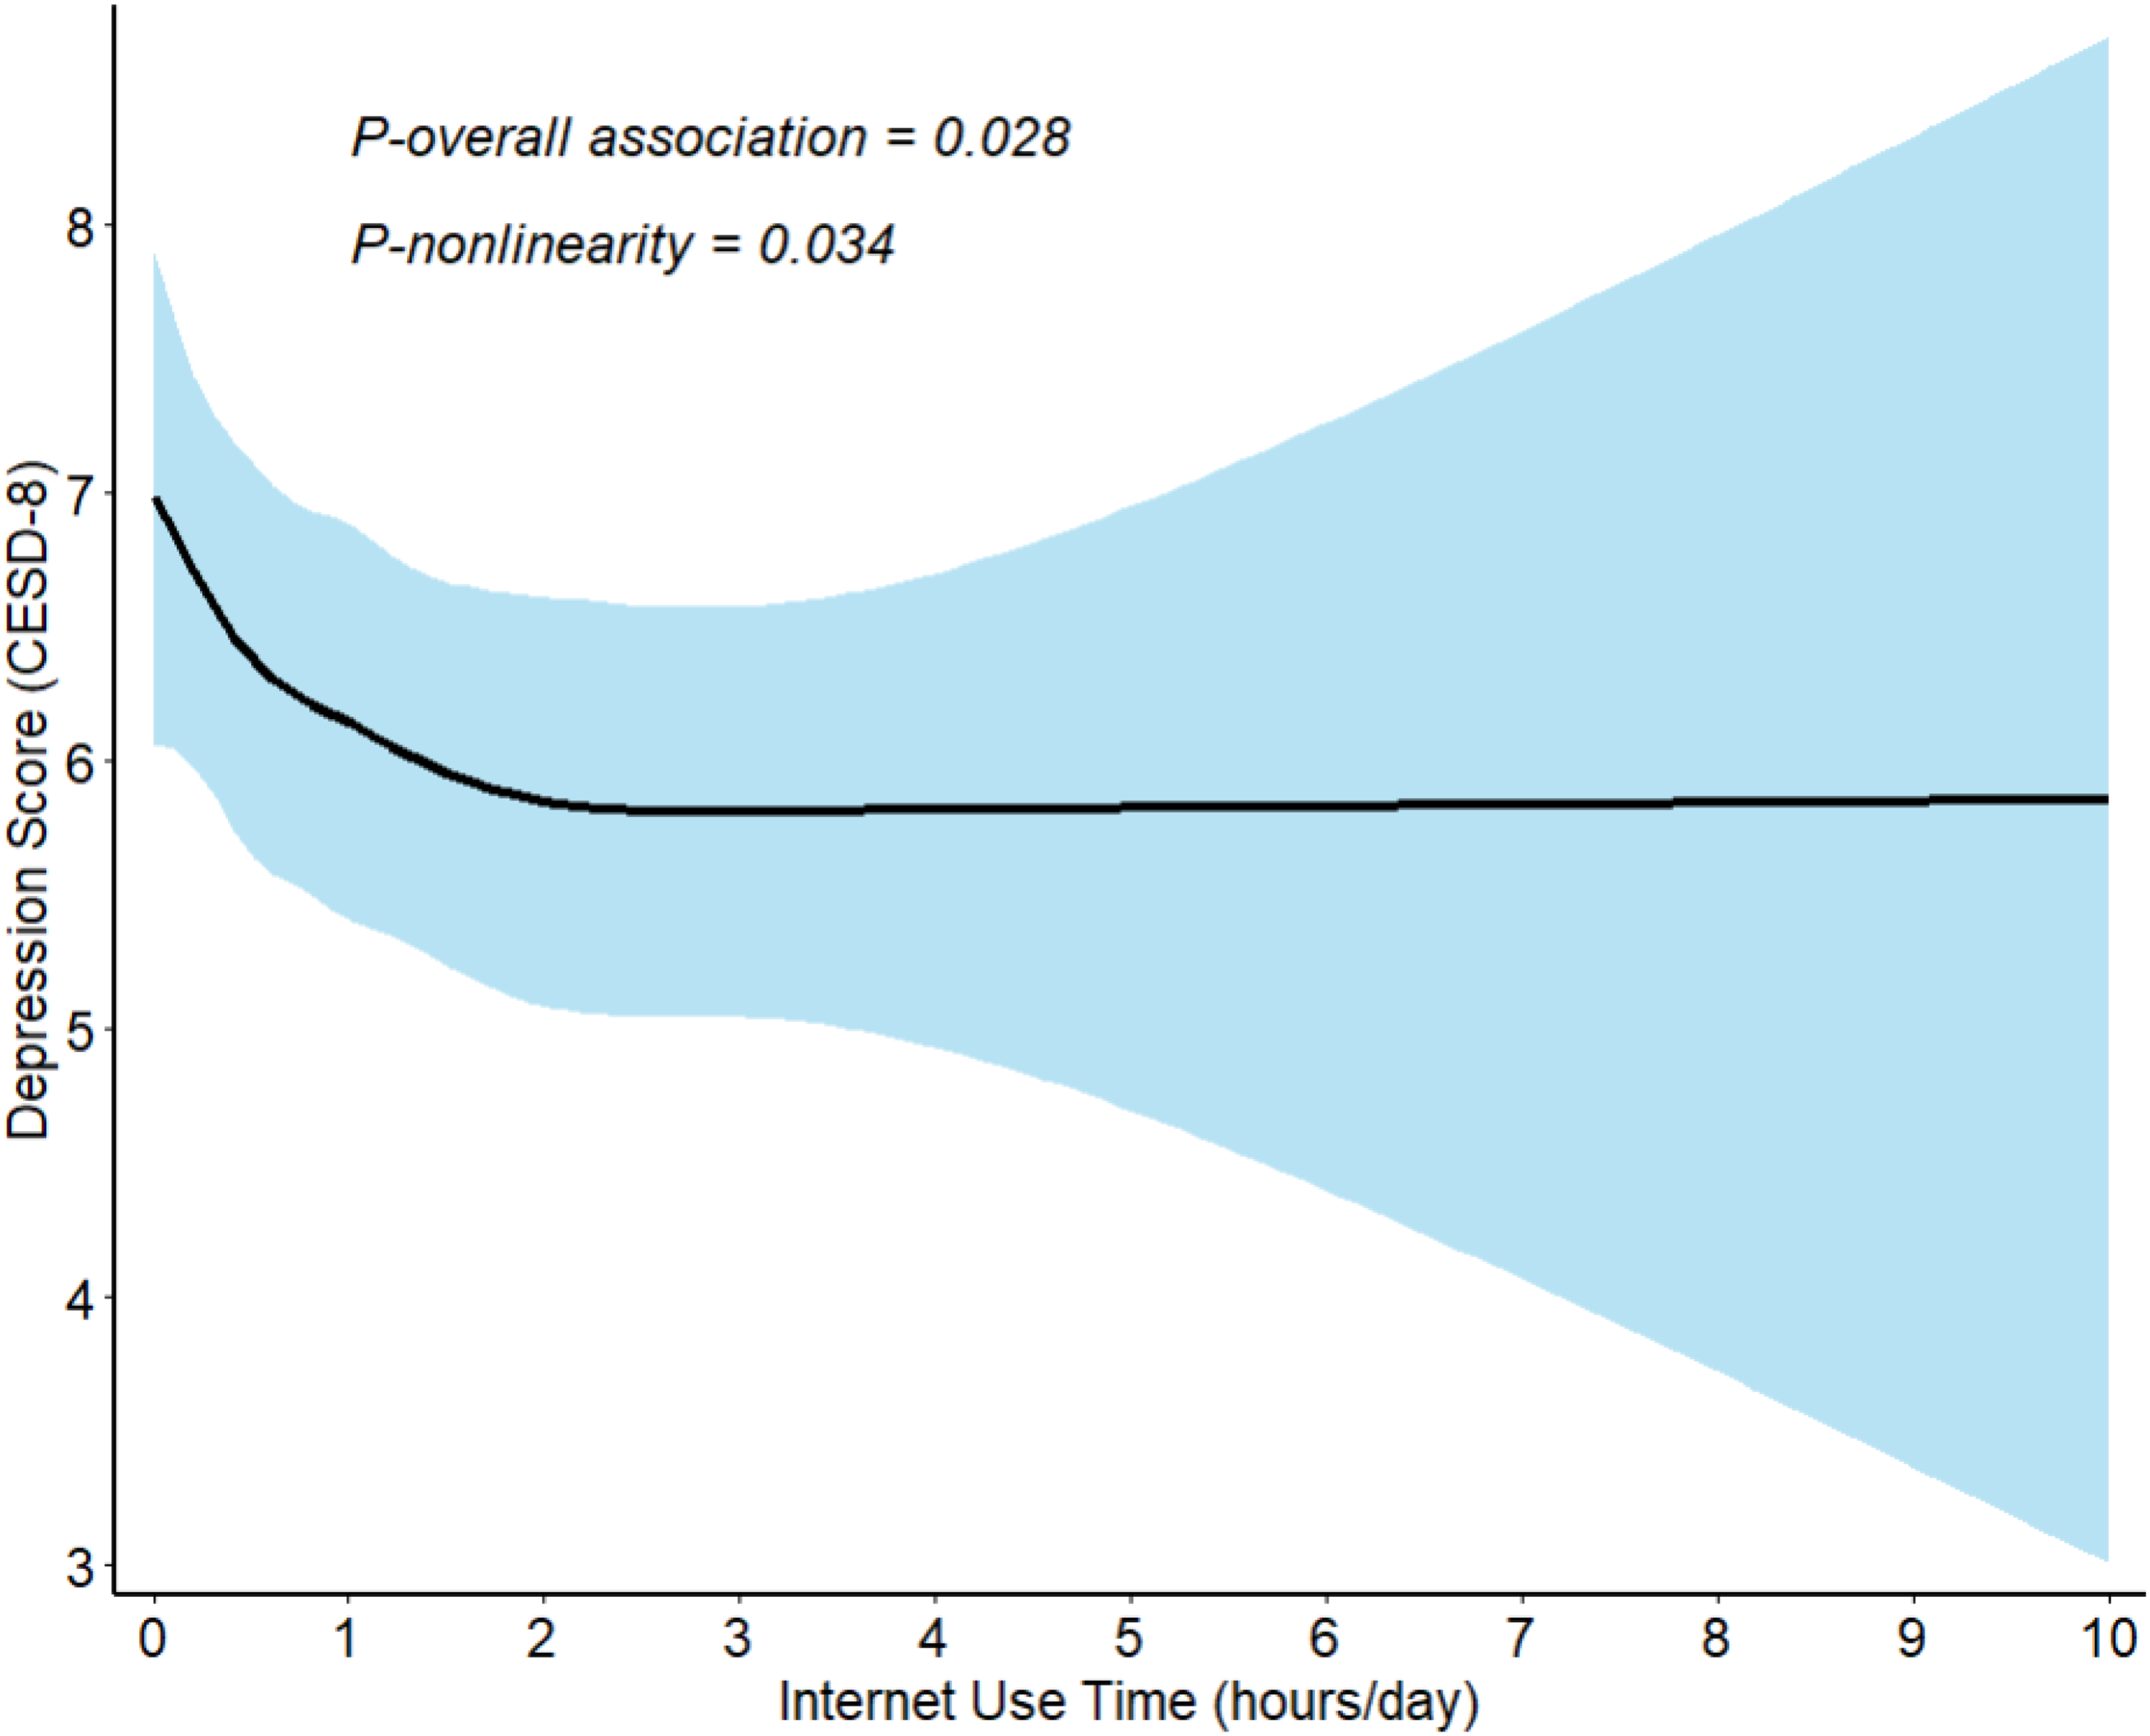
Associations between Internet use time and depressive symptoms using restricted cubic splines. Note. The restricted cubic spine model was adjusted for age, sex, marital status, family income, education level, residential area, working status, chronic disease status, self-rated health, exercise frequency, smoking status, drinking status, life satisfaction, and region.
Heterogeneity analyses
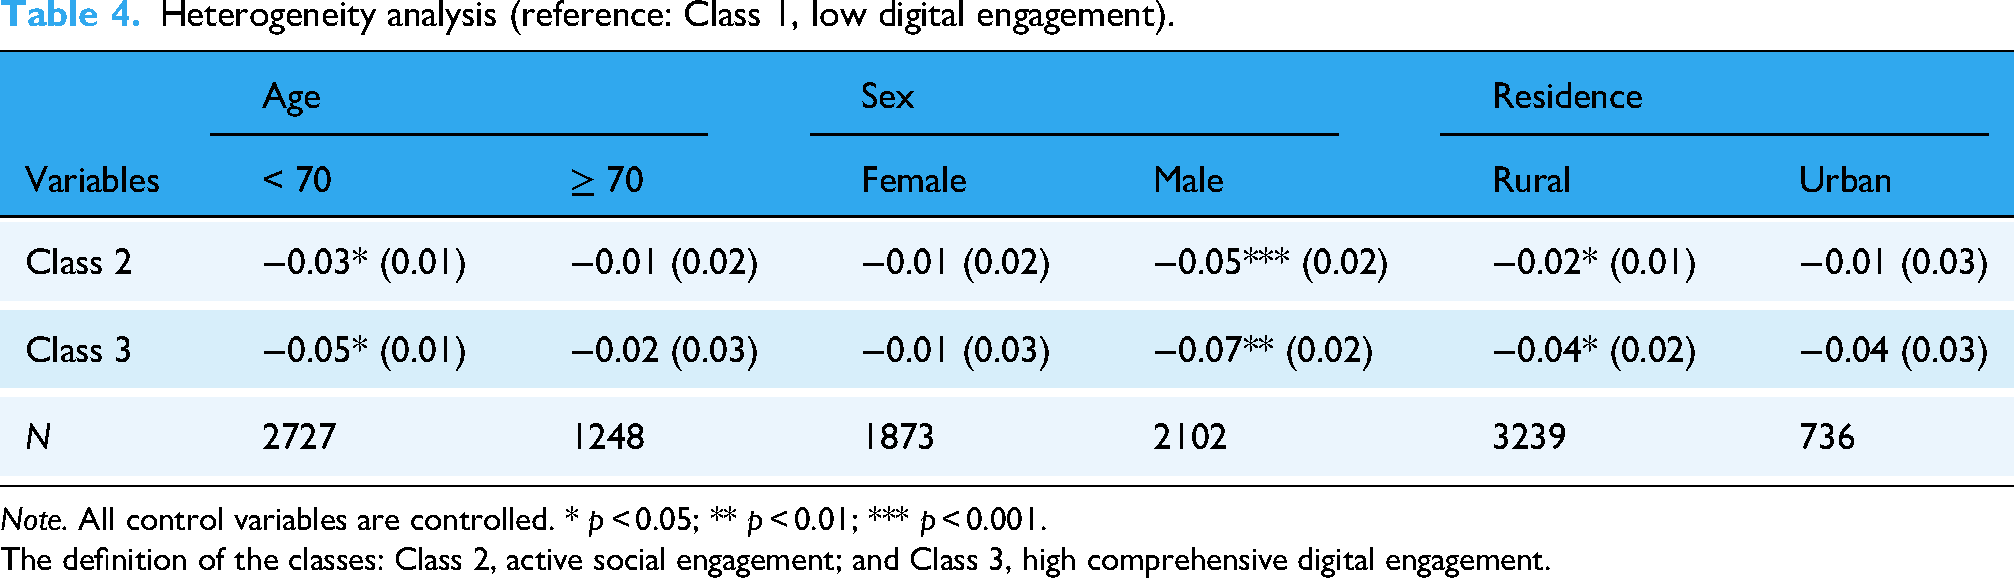
Table 4 presents a heterogeneity analysis, using quasi-Poisson regression, to examine the associations between Internet use patterns and depressive symptoms across different demographic subgroups (age, sex, and residence), with Class 1 (low digital engagement) as the reference group.
Heterogeneity analysis (reference: Class 1, low digital engagement).
Note. All control variables are controlled. * p < 0.05; ** p < 0.01; *** p < 0.001.
The definition of the classes: Class 2, active social engagement; and Class 3, high comprehensive digital engagement.
Regarding age differences, both Class 2 (−0.03, p < 0.05) and Class 3 (−0.05, p < 0.05) exhibited a significant negative relationship with depressive symptoms only in the < 70 group, while no significant association was found in the ≥ 70 group. In terms of sex differences, Class 2 (−0.05, p < 0.001) and Class 3 (−0.07, p < 0.01) showed negative associations with depressive symptoms only among male participants, while no significant association was observed in female participants. With respect to residence differences, Class 2 (−0.02, p < 0.05) and Class 3 (−0.04, p < 0.05) were significantly negatively associated with depressive symptoms only among rural older adults, while no significant association was observed in urban participants.
Discussion
This study investigated the relationship between Internet use patterns and depressive symptoms among older adults using the LCA. Further examination revealed distinct characteristics across three Internet use profiles. Class 1 (low digital engagement, 51.4%) exhibited the highest depressive symptoms scores and was characterized by the lowest average Internet use time, older age, lower education levels, rural residence, and poor self-rated health. Class 2 (active social engagement, 36.1%) demonstrated intermediate characteristics across most measures. Class 3 (high comprehensive digital engagement, 12.5%) showed the lowest depressive symptoms scores, the longest Internet use time, the youngest mean age, the highest educational level, and the highest proportion of urban residence.
Our findings reveal that Internet use patterns have a significant impact on depressive symptoms. Classes 2 and 3 show a stronger negative association with depressive symptoms compared to Class 1. The results align with prior research.25–27 Additionally, compared to Class 2, Class 3 was significantly associated with lower odds of depressive symptoms. This may be because Internet users engage in a wider variety of online activities, including watching short videos and sharing content on WeChat moments, which can enrich daily life and help alleviate feelings of loneliness. Moreover, as Qu et al. 28 observed, using digital platforms like WeChat to maintain contact with family and friends when geographically separated increased older adults’ opportunities for social exchange, reduced social isolation, and ultimately improved their mental health. The relationship between Internet use time and depressive symptoms showed a nonlinear pattern, with the strongest benefits observed in the first 2 hours of daily use. This aligns with findings by Mu et al., 29 who observed that longer durations of Internet use were more likely to be depressed. This may be because excessive Internet use disconnects older adults from fundamental social interactions and activities, thereby causing feelings of depression.
Notably, the heterogeneity analysis revealed important demographic variations in the relationship between Internet use patterns and depressive symptoms. First, the protective effect of Internet use against depressive symptoms was more pronounced among individuals under 70 years old. Chen et al. 30 found that Internet use showed a significant positive association with the mental health of older adults aged 60–69, while no similar effects were observed for those aged 70 and older. This maybe because individuals under 70 generally have better cognitive adaptability and learning ability, making them easily acquire digital skills and more comfortable with digital devices. 31 In contrast, those over 70 may face greater physical and cognitive barriers, which can limit the mental health benefits of Internet use. Second, males showed stronger benefits from Internet use compared to females. This aligns with the findings of Ma, 32 which indicate that Internet use is more likely to alleviate depression in males than in females. It is probably because older female adults generally have more social connections and engage in offline activities, such as square dancing and community volunteering, 33 which enhance their well-being and life satisfaction independently of Internet use. Given that older male adults tend to engage less in offline social activities, Internet use may play a critical role by meeting their social and entertainment needs, which in turn can help alleviate depressive symptoms. Third, rural older adults demonstrated stronger benefits from Internet use, while urban residents showed no such significant associations. This is consistent with the findings of Sun et al., 34 which suggest that rural older adults tend to gain greater benefits from Internet use compared to their urban counterparts. This may be because urban residents can easily access various services and social connections through face-to-face interactions, while rural residents often face difficulties due to geographical isolation. Digital technology helps rural older adults overcome these barriers, enabling them to access essential services and social support online, thus effectively alleviating depression.
The present study has several strengths. Utilizing the LCA approach, the study identifies three distinct patterns of Internet use, providing a more comprehensive understanding of older adults’ digital engagement. Another notable advantage is that our study uses the most recently released, large-scale, nationally representative CFPS 2022 data, offering the latest dynamics of the relationship and thereby enhancing the generalizability of the findings.
Despite these strengths, this study has some limitations. Firstly, a cross-sectional design was used, which prevented us from establishing a causal relationship between Internet use and depressive symptoms. Secondly, the study did not include measures of Internet use intensity and motivation—factors that are essential for understanding how and why Internet use may relate to depressive symptoms. Future studies should use longitudinal data with multiple waves of data to provide stronger evidence on the relationship between Internet use and depressive symptoms. Additionally, taking into account measures intensity and motivation of Internet use could elucidate both the level and underlying motives of Internet use, thereby deepening understanding of its impact on mental health.
Conclusion
This study reveals significant relationships between Internet use patterns and depressive symptoms among older Chinese adults. Through LCA, we identified three Internet use patterns (low digital engagement: 51.4%, active social engagement: 36.1%, and high comprehensive digital engagement: 12.5%), finding that Class 3 (high comprehensive digital engagement) has a stronger protective effect against depressive symptoms.
Our heterogeneity analysis further revealed that Internet use benefits vary across demographic groups, with stronger protective effects observed among individuals under 70 years old, males, and rural residents. These findings suggest the need for targeted digital inclusion strategies that consider individual characteristics and circumstances.
Footnotes
Acknowledgements
We express our gratitude to the CFPS research team for providing us with the data utilized in this study.
Ethical approval
CFPS has been approved by the Biomedical Ethics Review Committee of Peking University (ID: IRB00001052-14010).
Consent for publication
Not applicable.
Authors’ contributions
Weichao Chen and Rong Ji: study conceptualization and design; Weichao Chen and Yuqian Sheng: data analysis; Weichao Chen and Rong Ji: writing; Rong Ji and Caiqi Zheng: proofreading and revision; and all the authors: approval of the final version for publication.
Funding
The authors disclosed receipt of the following financial support for the research, authorship, and/or publication of this article: This research is funded by the Key Project of Hunan Provincial Department of Education (23A0062).
Declaration of conflicting interests
The authors declared no potential conflicts of interest with respect to the research, authorship, and/or publication of this article.