
Abstract
Objective
Hispanic/Latino/a/x (hereafter Latino) persons living in the U.S. are at increased risk for Alzheimer's disease and related dementias (ADRD) compared to non-Latino Whites. Early detection of preclinical changes is crucial. The SALUD-Tech study aims to identify digital behavioral markers—“digital signatures”—of ADRD risk in diverse middle-aged and older Latinos using passive data from smartphones and smartwatches.
Methods
Participants include Latino adults aged 50–70 years living in southern California, with varying degrees of ADRD risk as defined by the presence of mild cognitive impairment and cardiovascular disease risk. Data collection began in April 2022 and will continue through 2026. Participants complete comprehensive laboratory assessments (neurobehavioral, medical, sociocultural, and psychiatric assessments). High-frequency data on sensors, keyboard dynamics, and phone use activity are collected for 30 days following the baseline visit. A subset of study participants completes 18- and 36-month longitudinal assessments; these participants are selected based on risk profiles and retention likelihood. All data are securely encrypted, de-identified, and collected respecting participant privacy and consent in accordance with ethical standards. Data analysis involves integrating multimodal data streams using machine learning to identify behavioral patterns associated with early cognitive decline.
Results
We anticipate 300 participants will be enrolled in the study. Study results will be published in peer-reviewed scientific journals.
Discussion
Early detection of ADRD risk using smartphone and wearable data could help reduce disparities by providing a low-cost, accessible tool. Ultimately, this approach may be integrated into clinical care to enable earlier interventions and reduce healthcare costs.
Keywords
Introduction
Alzheimer's disease (AD) is a progressive neurodegenerative disorder that poses a significant health challenge worldwide. 1 Hispanic/Latino/a/x (hereafter Latino) persons living in the United States are at increased risk for mild cognitive impairment (MCI) and Alzheimer's Disease and Related Dementias (ADRDs) compared to non-Latino White persons.2–4 The number of Latino adults with AD is expected to increase to 3.5 million by 2060, 5 which represents a growth of 832% relative to 2012. 5 Yet, Latino persons continue to be underrepresented in research studies, with a median of 2% of participants in clinical research funded by the National Institute on Aging self-identifying as Latino in 2023. 6
Alzheimer's disease–related brain changes can begin ≥ 20 years before clinical symptoms occur, and the likelihood of staving off anatomic and physiologic changes decreases dramatically with disease advancement.7,8 Early disease risk detection is crucial to maximize the impact of interventions, particularly as new pathology-modifying therapies emerge.9–12 This is especially important for Latino persons, who generally experience an earlier onset of AD symptoms,13–16 and are diagnosed at more advanced stages 16 compared to other ethnic groups. While there has been increased focus on the use of biological markers for early detection of AD, 17 research on these biomarkers among the U.S. Latino population has greatly lagged behind that of the majority non-Latino White population. 18
Emerging research suggests digital markers can identify individuals at risk for developing ADRD.19–25 Digital health technologies offer a passive and continuous way to gather data on behavioral changes affected early in ADRDs (e.g., physical activity, sleep, language). The passive and continuous nature of data collection that digital health technologies allow presents a unique and innovative opportunity to detect ADRD risk at scale in a timely, accessible, and economical manner. 20 However, we also recognize that passive data collection raises important ethical considerations, including privacy concerns and potential participant discomfort with continuous monitoring—issues that are essential to address as the field continues to evolve. The development of potentially impactful digital health solutions for early ADRD detection must not leave behind underserved and higher-risk segments of the U.S. population. Including Latino persons early in the development of digital signatures of ADRD will ensure applicability and optimization for the early detection and monitoring of ADRD in this population, while helping to combat the unequal burden of ADRD among Latino persons.
The SALUD-Tech study aims to identify digital phenotypes of risk for ADRD among middle-aged and older Latino persons, with a focus on vascular contributions to dementia, given the disproportionate impact of cerebrovascular disease risk in this group.15,26–31 Guided by the NIA Health Disparities Research Framework, 32 and recognizing the multifactorial nature of ADRD risk among Latino persons, the study captures multiple behavioral features linked to ADRD risk via passive and unobtrusive data collection methods in the real world. The passive data streams included in this study were selected based on a review of the digital phenotyping literature available at the time the grant was written in 2020.19,20,23–25 Selection criteria prioritized data streams that could be collected using widely available consumer-grade devices and ensuring an unobtrusive approach conducive to continuous data collection in everyday life. Additionally, the selected streams targeted behavioral domains known to be risk factors for ADRD among Latinos, specifically physical activity, sleep, motor movements, geolocation, and social activity. We chose not to include active digital data collection (e.g., mobile cognitive tests, speech samples) in this study to minimize participant burden and maximize adoption of the technology in underrepresented populations. Given well-established sex differences in ADRD and in the behavioral features that are captured in SALUD-Tech,33–45 the study is investigating sex differences in the digital signatures of ADRD among older Latino persons. Considering the heterogeneity within the Latino population in the U.S., 46 SALUD-Tech is also examining whether sociocultural factors (e.g., language use/bilingualism, acculturation, socioeconomic status) impact or modify digital signatures of ADRD risk. Lastly, this study is investigating digital phenotypes of longitudinal neurocognitive change at 18- and 36-months in an exploratory fashion in a subset of Latino persons with and without ADRD risk. Ultimately, the goal is to develop a cost-effective, user-friendly solution for the early detection and monitoring of ADRD among Latino persons, via the identification of culturally relevant digital signatures of ADRD risk in this group.
Methods
Design
The SALUD-Tech study uses a combined cross-sectional and longitudinal design to identify digital phenotypes of risk for ADRD among middle-aged and older Latino persons living in Southern California. The cross-sectional aspect of the study involves the examination of 300 Latino persons aged 50–70 years, with varied degrees of ADRD risk, as defined by the presence/absence of cardiovascular disease (CVD) risk and MCI. Apolipoprotein E (APOE) ε4 and plasma-based AD are also considered for further classification of ADRD risk. During in-person baseline visits, participants complete comprehensive neuropsychological and neuromedical evaluations, and assessments of culturally relevant factors. During this visit, participants are provided with a Fitbit Versa 2 or 4 device and assisted with installing apps on their personal smartphones. High-frequency data on sensors, keyboard dynamics, and phone use activity are collected continuously over 30 days following the study visit in participants’ natural environments. A subset of participants is followed longitudinally with lab-based assessments at 18- and 36-month post-baseline visit. In-person study visits are conducted at the University of California San Diego (UCSD) La Jolla campus, the San Diego State University South Bay Latino Research Center (SBLRC) in Chula Vista, CA or at participants’ homes.
Ethics and institutional review board
All study-related procedures have been reviewed and are overseen by the UCSD Institutional Review Board (Protocol 803609). The most commonly expected risks of the study are feeling stressed or uncomfortable about answering some of the questions, pain or bruising from the blood draw, and mild discomfort when wearing a smartwatch. The most serious risk may include accidental disclosure of genetic information. Multiple provisions are in place to prevent this loss of confidentiality and minimize other risks. While there is no direct benefit to participants, the new knowledge gained regarding the identification of ADRD risk among Latino persons may help others in the future. While not a benefit, participants will receive a small incentive for participating in the study (up to $175 for baseline data, up to $20 for 18-month follow-up data, and up to $55 for 36-month follow-up data). Participants can also obtain results from their cognitive and blood-based metabolic markers data.
Study population inclusion and exclusion criteria
The target sample at baseline is 300 adults ages 50–70 years old who self-identify as Latino with and without MCI and CVD risk as follows: 1) with MCI and CVD risk (MCI+/CVD+); 2) cognitively normal with CVD risk (MCI-/CVD+), 3) with MCI but no CVD risk (MCI+/CVD-), and 4) cognitively normal without CVD risk (MCI-/CVD-). Additional inclusion criteria include: participants may be monolingual in English or Spanish or bilingual (Spanish/English), able to provide informed consent to participate in research, and smartphone ownership. We anticipate most participants will be of Mexican heritage, but we do not exclude participants based on Latino background. Participants are excluded if they have a history of psychotic disorder, notable neurological confounds (e.g., loss of consciousness for more than 30 min, history of brain hemorrhage, brain surgery, diagnosis of seizures, clinical stroke, multiple sclerosis, or dementia), inability to text on a smartphone, and notable alcohol or substance use (10-item Alcohol Use Disorders Identification Test [AUDIT] Total Score >16 or Drug Abuse Screen Test [DAST] total score >6). For the longitudinal aspect of the study, we prioritize inviting participants with (MCI+/CVD+) or without (MCI-/CVD-) ADRD risk at baseline and who were responsive to the study protocol during the baseline assessment (e.g., completed all lab visit assessments; complied with at least 70% of the digital data on at least three data streams) to participate, with a target sample of 90 participants at 18-month and 36-month follow-up.
Culturally relevant considerations
Study procedures follow a culturally informed approach. Our study team includes several bilingual/bicultural members, including one Multiple Principal Investigator (MJM) and all study staff who had participant contact via recruitment efforts or data collection. Study visits are conducted in Spanish or English based on participants’ primary language, determined via methods used in prior studies. 47 These methods include a validated algorithm based on a brief measure assessing participant's language preference, fluency, and use in daily life 48 and confirmed via performance-based measures of fluency in English 49 and Spanish. 50 We have implemented several strategies to reduce practical barriers to research participation including: a testing site in a community with high Latino representation; home visits when needed; study visits during weekends and after regular working hours; transportation to/from study visits; meals during visits; childcare reimbursement; compensation for time and effort; and return of study results. Based on a comprehensive literature review, we identified the most appropriate assessment instruments for middle-age and older Latino persons. We chose those with available English and Spanish versions and strong psychometric properties for Latino persons.
Recruitment and retention
Recruitment activities occur in San Diego County (California). Recruitment efforts leverage an NIH-funded longitudinal observational cohort study of Latino persons (R01MD013502), an existing participant pool at the San Diego State University SBLRC, and other participant registries at UCSD. Bilingual study staff reach out to participants in these cohort studies who had previously provided consent to be contacted for future studies via telephone and provide an overview of the study using a low-literacy recruitment script. Building on years of experience fostering trust in the local Latino community, we also recruit new participants, with a focus on persons residing in Latino neighborhoods in southern San Diego County, CA. Activities for recruitment of new participants include presentations to community organizations that serve the older adult Latino community, participation in health events, flyer distribution, establishing a formal partnership with a promotora de salud, referrals from current participants, and mailings to Latino neighborhoods. Recruitment materials were codeveloped in English and Spanish, utilizing plain language and considering cultural appropriateness.
To ensure evidence-based retention efforts for the duration of the study we will: 1) form a direct relationship with each study participant, 2) call and check-in with participants during the first three days and every two weeks of the digital data collection period, and 3) encourage participants to let us know when their contact information changes and do periodic checks on the accuracy of the records. We will make reminder calls to participants one week, then again one day, prior to their follow-up visit. In addition, our team utilizes participant retention methods based on previously published principles, including: 1) informing individuals that they will be followed up for the duration of the study; and 2) obtaining permission at the time of entry to allow follow-up through other contacts (e.g., family members, trusted confidants).
Instruments
The corresponding author can be contacted to request a complete packet and references of all study measures that are not proprietary.
Laboratory assessments
Neurobehavioral assessments
Neurocognitive function is assessed via a comprehensive neuropsychological assessment battery, which measures seven ability domains (Table 1). All tests are available in English and Spanish and have demographically adjusted normative data for Latino populations. All tests are completed at the baseline and 36-month visits, and a subset at the 18-month visits (noted in Table 1). The neurobehavioral assessment includes also self-report measures of current problems with instrumental activities of daily living 8 and self-report of cognitive symptoms. 51
Comprehensive neuropsychological test battery.
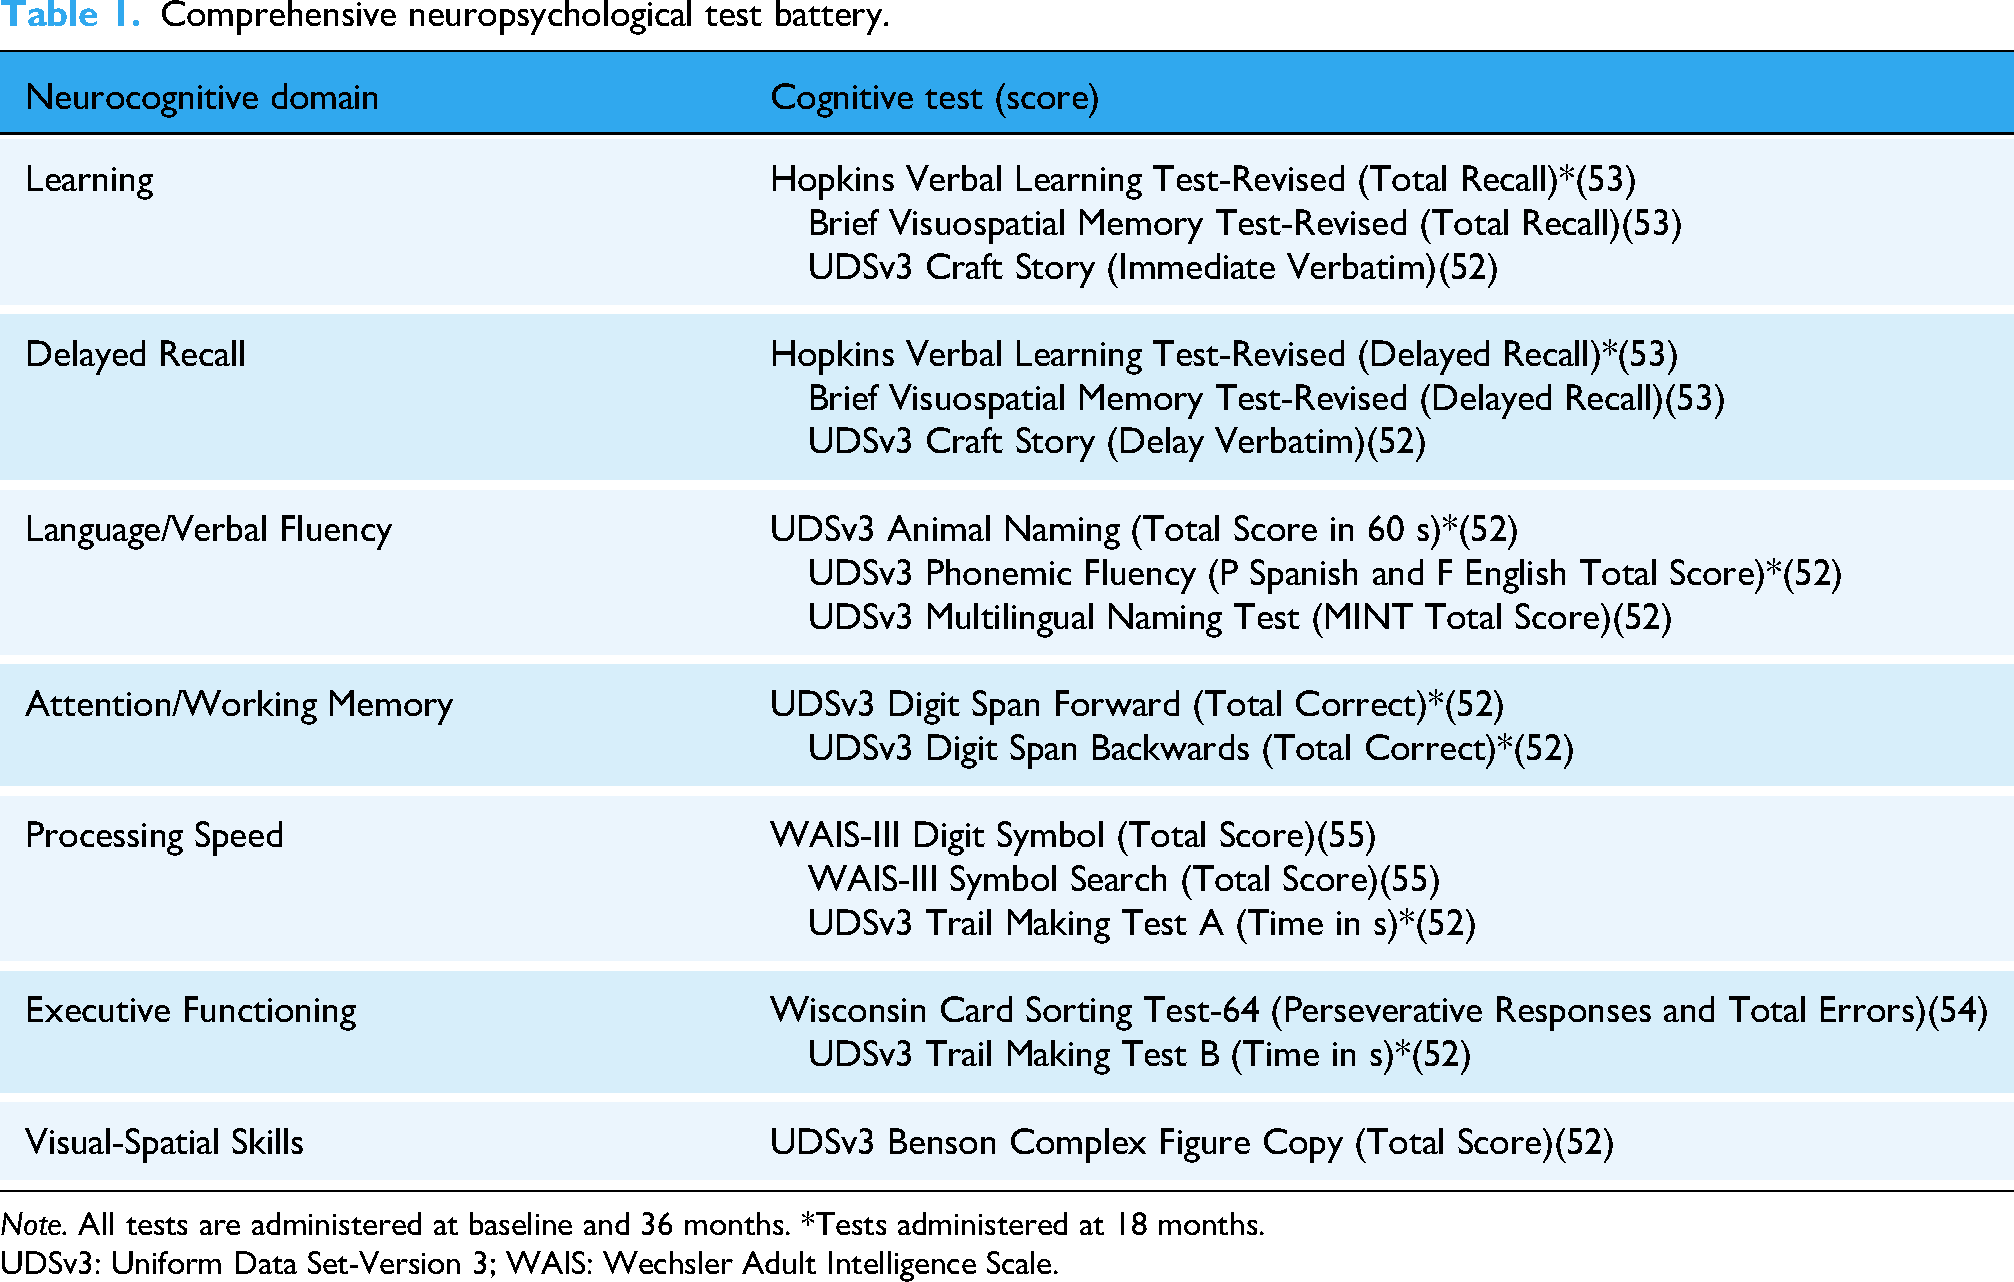
Note. All tests are administered at baseline and 36 months. *Tests administered at 18 months.
UDSv3: Uniform Data Set-Version 3; WAIS: Wechsler Adult Intelligence Scale.
Neurocognitive data will be utilized to compute three types of outcomes: 1) Cross-sectional continuous neurocognitive performance: Raw test scores for each test are converted into demographically adjusted T-scores (age, education, gender).52–55 Adjusted T-scores are averaged to compute global and domain T-scores. 18 2) Diagnosis of MCI. Objective presence of MCI is determined via Jak/Bondi diagnostic criteria. 56 Per these criteria, MCI is defined by impairment in at least one cognitive domain. Domain impairment is quantified by scores of >1SD below the normative mean on at least two tests within the domain. 3) Longitudinal neurocognitive change will be analyzed utilizing cognitive T-scores at baseline, 18 months and 36 months. 57
Neuromedical assessments
The neuromedical exam at baseline consists of medical and medication history, anthropomorphic and vital signs measurements, assessment of physical function via the Short Physical Performance Battery, 6 and a fasting blood draw. Cardiovascular disease risk factors are based on established criteria: 1) diabetes mellitus (fasting plasma glucose ≥126 mg/dL, an HbA1c ≥ 6.5%, and/or use of antihyperglycemic medications) 58 ; 2) hypercholesterolemia and dyslipidemia (total cholesterol ≥240 mg/dL, LDL cholesterol ≥160 mg/dL, or HDL cholesterol <40 mg/dL [for persons with and without diabetes] or on cholesterol-lowering medication) 59 ; 3) hypertension (systolic blood pressure ≥140 mm Hg, diastolic blood pressure ≥90 mm Hg, or on antihypertensive medication) 60 ; 4) current cigarette smoking; and 5) obesity (BMI of ≥30.0). 61 Cardiovascular disease risk burden is defined by the count of CVD risk factors based on prior research. 30 An adverse CVD risk profile is defined by the presence of 2+ CVD risk factors based on findings showing a significant link between a similar CVD risk burden and cognitive function in Latino persons. 62 We also genotype APOE and will consider it in secondary analyses for the determination of ADRD risk along with plasma-based biomarkers known to be important in the expression and evolution of AD (phosphorylated-tau [p-tau181]; neurofilament light [Nfl]).63,64 We are also storing plasma to allow for new assays. A subset of the neuromedical assessments are administered at follow-up visits, including updates on medical and medication history, and anthropomorphic and vital signs measurements.
Culturally relevant factors
Acculturation is assessed via self-report 65 and bilingualism via self-report 66 and performance-based measures.67–69 Participants also complete a self-report sociodemographic questionnaire that collects information on place of birth, time in the US, quality of education (educational setting and resources), income, and characteristics of the childhood environment, among others. 70 Data on all sociocultural factors are collected at baseline, and those that might change over time (e.g., income) are also measured at longitudinal visits.
Psychiatric and substance use characteristics
Psychiatric symptoms and substances are assessed via the Patient Health Questionnaire-9 (PHQ-9), 71 the Generalized Anxiety Disorder – 7 item, 72 the NIH Toolbox Emotion Battery,73,74 and the AUDIT. 75 All psychiatric and substance use assessments are administered at baseline, and the PHQ-9 and GAD are repeated at follow-up assessments. The Life Events Scale 76 is also administered in follow-up visits to capture major life events over the past year.
Digital phenotyping data
Descriptions of the digital data collected are provided below and summarized in Table 2 and include keystroke metadata, sleep, physical activity, geolocation, and phone use activity. Participants use their own smartphones for the study, and Fitbit Versa 2 or 4 watches are provided to collect sleep and physical activity data over 30 days post baseline laboratory visit.
Summary of digital data collected.

Note. GPS: Global Positioning System; GIS: Geographic Information System; PALMS: Personal Activity and Location Measurement System; TLBC: Two-Level Behavior Classification.
Keystroke data
Participants install the KeyWise AI keyboard extension (https://keywise.tech/) on their personal Android or iPhone smartphones, which replaces the standard smartphone keyboard. This keyboard passively collects typing metadata (e.g., time between keypresses, backspace usage, accelerometer during typing) without capturing content, ensuring user privacy. Deidentified data are automatically uploaded to a password-protected AWS cloud server, with no data stored on the device. KeyWise ensures that no personally identifying information is stored with the data. The raw metadata and derived metrics, including average interkey delay, typing speed variability, backspace usage, and circadian rhythms, will be used in analyses.
Sleep and physical activity
Sleep and physical activity are measured objectively using the wrist-worn Fitbit Versa 2 or 4, and participants are asked to wear the device for 24 h/day (except when charging) on their nondominant wrist for the 30-day home assessment period (and the two additional 30-day assessment bursts in the subsample completing longitudinal visits). Indicators for physical activity analyses will be averaged at the day level and include distance traveled, step count, and overall activity, and indicators for sleep analyses will include total sleep time and sleep efficiency.
Geolocation
As another potential objective indicator of ADRD risk, a continuous series of location-based data are obtained using the built-in GPS on participants’ smartphones and will be analyzed to generate representations of the participants and their surrounding environments (e.g., time spent at-home/not-at-home). We use the GPS logger app for Android devices and MyTracks app for iOS devices to collect the GPS data. Indicators for analyses include time spent at home, distance from home, neighborhood characteristics, and total distance traveled in a day.
Further, when these locations are analyzed with the background Geographic Information Systems (GIS) layers using methods such as spatial overlay, we can quantify the neighborhood characteristics that participants are exposed to. Environment will be quantified through two composite indexes of GIS data: physical/built or structural and sociocultural. The index will be created using summed z-scores of a number of features, and a final total environmental disadvantage index from both variables will be created. Physical/built or structural disadvantage will be compiled from walkability, 77 recreation, 78 built food environment, 79 transit, road safety, and green space (NDVI index). 80 Sociocultural disadvantage will be compiled with measures of diversity, 81 language, economy, 82 and crime. 83 We will also explore environmental hazards by examining air, noise, and light pollution, as well as water quality.
Social activity
Communication patterns and social dynamics are quantified by phone use activity (aka “screen time”), such as time spent in messaging/social media apps and time spent talking on the phone. To obtain these data, participants send daily screenshots of their prior day screen time activity to the study team. Indicators for analyses will include mean screen time, daily variability in screen time, top apps used (quantified into categories such as social media, communication, games, and utilities), and time spent in various activities.
Data analysis plan
Feature engineering overview
We will use a combination of existing features provided by industry partners (e.g., robust statistics metrics previously used to predict age and smartphone usage), 84 and we will engineer additional features using nonlinear dynamical systems methods developed to study intrasubject variability dynamics over time (e.g., recurrence quantification 85 and multiscalar entropy analysis 86 ) as well as traditional time-series methods. Intrasubject variability will provide interpretable features that may be indicative of subtle differences due to MCI and/or CVD risk.
Using the keystroke data as an example, an outline of the specific features we aim to extract to demonstrate the potential richness and predictive power of digital phenotypes is as follows. We plan to extract a comprehensive suite of keystroke and session-level features from each individual's daily typing data. Specifically, we will quantify interkey timing metrics—such as the median, harmonic mean, 95th percentile, root mean square of successive differences, and median absolute deviation of alphanumeric-to-alphanumeric intervals, as well as session characteristics such as median and mean session length and total typing duration per day. We will also capture error-related behaviors (e.g., backspace and autocorrect event rates) and derive variability and complexity indices (e.g., multiscale entropy of interkey intervals).
Prior research indicates that these measures predict both demographic and cognitive signal: typing speed can predict chronological age, 87 while entropy-based variability in keypress timing correlates with planning performance on the Tower of London task. 88 Furthermore, within-subject fluctuations in daily typing speed have been shown to track trail-making task performance and depressive symptom severity.89,90 In work currently in review on younger adults (ages 21–40), we derived 39 keyboard-dynamics features and used principal component analysis to reveal that the first component (overall typing speed) and second component (usage patterns such as pause behavior) each significantly predict fluid cognition (NIH Toolbox composite) and TMT-B completion time. 91 For the current sample, we will extend this approach by incorporating pause-based features—capturing intrasession idle durations—to enhance sensitivity to fine-grained changes in processing speed and attentional control.
Lastly, we will use artificial neural networks, specifically a deep learning method that combines convolutional neural networks (CNNs) and long short-term memory networks (LSTMs) called CNN-LSTMs. It will extract features from the individual data streams to examine hidden markers that are predictive of the dependent variables. Such models can automatically “featurize” the raw data, including temporal patterns, during the end-to-end training process. 92 To reduce the risk of overfitting, we will regularize the model aggressively and explore unsupervised pretraining to learn the lower layers of the CNN features.
Feature engineering analyses
For feature extraction from the passive metrics, the goal is to develop stable parameter estimation of the intrasubject variability using both standard and ML approaches. Standard approaches to capture intrasubject variability involve tools from dynamical systems (complex systems tools), such as entropy-based methods for physiological time series methods, and have been used successfully in bipolar disorder to predict changes in mood self-report, 93 motor activity, 94 motor activity in depression, 95 and a range of other physiological disorders such as heart disease. 96 Multiscalar entropy analysis 97 will be applied to measure intrasubject variance, and our own simulations show we need to at least 3000 data points to achieve stable estimates. For keystroke metadata, we can safely assume 300 keystrokes/day × 30 days = 9000 keystrokes/person. For GPS/GIS data, the polling rate is 12 times an hour × 24 h × 30 days = 8640 data points. For the other metrics of intrasubject variance where the time-series is shorter (e.g., gait speed/day, sleep/night), we will use recurrence quantification analysis, another complex systems tool for nonlinear time-series data. Recurrence quantification analysis can be understood as the generalized autocorrelation function and allows the detection of deterministic elements of a signal what might look stochastic in nature 98 and has been successfully applied to EEG, 99 heart rate variability, 100 and postural sway. 101 Recurrence quantification analysis produces several metrics (including entropy) from nonlinear time series, such as where in time the person is repeating patterns and how stable patterns are in time.
Machine learning and statistical analyses
Alzheimer's Disease and Related Dementias risk groups (MCI+/-, CVD+/-) will be predicted from data obtained via passive digital measures collected over 30 days. Digital features from the passive metrics (both standard and machine-learned) will be entered into ML methods designed for high-dimensional multivariate predictors in small sample sizes for cognitive T-scores and CVD risk. 102 Interactions with sex and with language use and other sociocultural factors will also be examined. LASSO will select the most impactful passive digital features while limiting model complexity (help prevent overfitting), maintaining type I error levels in a small sample relative to the number of parameters. 103 XGBoost, 104 a method that incorporates pruning and regularization methods (like LASSO), will help assess the importance of individual features. For the classification of ADRD risk group, modern ML classifiers will be used with standard metrics to assess model fit (i.e., raw accuracy, area under the ROC, specificity sensitivity, and precision). Predictors will be tested stepwise to improve interpretability. The specific algorithms selected will depend on a balance of power relative to underlying assumptions105,106 that are met with an emphasis on model interpretability (e.g., QDA, random forest, XGBoost). To guard against overfitting in all our machine-learning models, we will first set aside 20% of subjects (stratified by group) for a final hold-out validation. Within the remaining 80%, we will perform k-fold cross-validation (e.g., k = 10), monitoring variability in balanced accuracy and F1-score across folds. To reduce feature-space complexity, we will preselect predictors informed by prior literature and, where necessary, apply dimensionality reduction (e.g., PCA, T-SNE). For our CNN-LSTM pipelines, we will additionally withhold 50% of each individual's time-series streams (Fitbit, GPS, KeyWise, screen time) during training, and employ dropout and regularization (e.g., L₂ weight-decay) in the convolutional and recurrent layers. Finally, we will evaluate generalization performance on the 20% subject hold-out set mentioned above.
The specific cross-validation technique will depend on algorithm selection (e.g., leave-one-out, K-fold, or bootstrapping). 107 To assess individual feature importance SHAP (SHapley Additive exPlantations) values will be extracted. To balance type I and II error rate and control for multiple testing, we will use an optimal alpha strategy (a = .05 to .005) depending on whether the question at hand is a main hypothesis or exploratory and relative analysis being conducted (e.g., ML analysis, classical or robust parametric and nonparametric statistics), and how the p-values are derived for the specific algorithm tested (e.g., classical, Bayesian, or bootstrapped). We will use Holm–Bonferroni adjustments for ≤5 tests 108 and false discovery rate methods for >6 tests. 109 When dependent outcome measures are correlated, corrections will be calculated based on the effective number of independent tests. 110 For the longitudinal exploratory aim, generalized linear mixed-effect models 111 will model neurocognitive change and its association with changes in digital data features over time. 112 The variable selection methods above will be used to explore which features are the most impactful. 113 Finally, we will explore the standard feature importance analysis method of drop-feature evaluation, an ablation analysis where we withhold a subset of features at a time and rebuild the models.
Sample size and power analyses
We conducted a sensitivity analysis to determine the minimum effect sizes detectable in our study, using a multiple regression sensitivity analysis. Drawing on previous studies with passive metrics, we anticipate identifying 18–20 passive features relevant to the primary study aim. With 20 predictors, we estimated small-to-medium effect sizes between individual predictors and cognition T-scores, achieving a power of 0.80 with Cohen's f2 = 0.026 (Cohen's d = 0.32; R² = 0.025) and a power of 0.95 with Cohen's f2 = 0.044 (Cohen's d = 0.42; R2 = 0.042). For the examination of sex, language use, and other sociocultural factors, we will also explore the smallest effect size necessary for accurate participant classification into predefined groups using logistic regression, the oldest and most conservative method, assuming moderate intercorrelation among normally distributed predictors (R2 = 0.30): a power of 0.80 analysis resulted in an odds ratio of 1.49 or Cohen's d = 0.22, and a power of 0.95 resulted in an odds ratio of 1.69 or Cohen's d = 0.29. These results indicate adequate power to detect small-to-medium effect sizes.
Results
Enrollment of participants for the baseline assessments started in April 2022 and is expected to be completed by April 2025. As of March 2025, 297 individuals have completed these first-round assessments. The first round of 18-month follow-up assessments occurred in July 2023. Study results will be published in peer-reviewed scientific journals in a timely fashion at completion of data collection. We intend to publish all deidentified datasets, code, and models we create on a publicly accessible project webpage hosted on GitHub. We will also release the raw data files from which we created our unlabeled data on the repository.
Discussion
There is a pressing need to develop tools to detect the earliest manifestations of ADRD, particularly in Latino persons. A variety of behavioral changes can reveal risk for ADRD, and mobile technologies offer ways to unobtrusively collect, track, and analyze these behaviors as a person engages in their daily life. Projects worldwide are emerging to take advantage of the large amounts of data collected via these mobile technologies.114,115 The digital signatures captured through the SALUD-Tech study hold the potential to provide insights into patterns of behavior changes in a well-characterized cohort of Latino persons living in the U.S. with varying risk for developing ADRD. Importantly, the study aims to examine how heterogeneity within Latino persons might impact digital signatures of risk for ADRD.
The identification of culturally relevant digital phenotypes of ADRD specific to the Latino population is crucial for the accurate detection of ADRD risk in this group. Behavior is culturally dependent, and thus, it is imperative that culture is carefully considered in the examination of digital signatures of ADRD. Seminal ADRD research has historically been conducted in primarily non-Hispanic White samples, contributing to a poor understanding of the nature of ADRD among Latino persons and resulting in a skewed understanding of ADRDs. By including Latino persons early in the development of digital signatures, we strive to ensure applicability and optimization for the early detection of ADRD. Further, the utilization of passive data collection methods could mitigate many challenges of traditional neurobehavioral assessment methods to detect preclinical ADRD and provide a powerful tool to identify ADRD early with minimal burden to Latino persons. Such tools can immediately advance ADRD disparities science by providing a low-cost, low-burden risk detection tool for research, and facilitate improved understanding of ADRD risk factors and disease progression.
Findings from the SALUD-Tech study might also contribute to the diagnosis of ADRD in Latino persons in clinical settings. Given barriers to preclinical assessments, incorporating digital health technologies into routine healthcare practices may provide a strategy for early identification. Tools developed via the SALUD-Tech study could ultimately be incorporated into clinical care, providing opportunities for timely disease detection and intervention. Addressing ADRD disparities through research that prioritizes the inclusion and lived experiences of Latino persons can help promote equitable access to resources and care.
Limitations of the current study include the relatively short follow-up period (3 years) in only a subset of participants. To mitigate this limitation, we selected “no-risk” and “high-risk” groups for developing ADRD for the longitudinal follow-up visits. This approach increases the likelihood of observing greater cognitive decline within the study period in our high-risk group and enhances our ability to compare the trajectories of the two groups. We also chose to study an “at-risk” group instead of persons with notable ADRD symptoms, as the goal is to identify subtle behavioral changes in daily life as early indicators of ADRD risk. These digital markers likely differ between persons with subclinical disease burden and those with dementia, given functional impairments in this latter group that impact activities of daily living and often require caregiver assistance. In future work, we plan to continue following this cohort, as well as other at-risk groups, to evaluate digital signatures of long-term trajectories of cognitive and brain changes, and onset of ADRD. Also, given the geographical region in which the study is being conducted (southern California), we expect a majority of our sample will be of Mexican background, which is the largest Hispanic heritage group in the U.S. Yet, findings from the present study might not generalize to persons from other Latino backgrounds and living in other regions of the country. Future multisite studies including Latino persons from other U.S. regions and heritages (e.g., Puerto Rican, Cuban, Salvadoran populations), with associated cultural, educational, and other differences, will be key in determining the generalizability of our findings to Latino persons in the U.S. more broadly and ensuring that digital signatures of ADRD accurately reflect the heterogeneous Latino U.S. population. Lastly, as is the case with several digital health studies, there is the potential for selection bias due to differences in digital literacy and access to technology among participants. In the present study, we provide wearables to participants which might minimize this bias to some extent. We also record reasons for exclusion, including not owning a smartphone, which will help determine the extent to which smartphone ownership was a deterrence to study participation. It is important for future studies to continue considering strategies to further minimize potential biases and ensure that the digital data captured is representative of the broader Latino population.
Conclusion
Ultimately, this study has the potential to make a meaningful contribution to clinical practice and health policy, especially for underserved populations. By using passive mobile sensing and machine learning, it aims to identify early signs of ADRD risk in a way that is unobtrusive and affordable, which is criteria for timely intervention. If successful, this approach could help clinicians monitor at-risk individuals more easily and support earlier interventions. The tools developed through this work could also inform policies around integrating digital health strategies into routine care, helping to improve early detection and reduce health disparities in Hispanic/Latino communities.
Footnotes
Acknowledgements
The authors thank all participants for the time spent participating in this study, and students who assisted with data processing and entry.
ORCID iDs
Ethical approval
All study procedures and protocols were in accordance with the Declaration of Helsinki and were approved by the University of California San Diego Institutional Review Board (Protocol 803609).
Contributorship
RCM and MJM co-led the conception and design of the work, as well as the acquisition, analysis, and interpretation of data for the work; drafted part of the initial work and revised other sections; provided final approval of the version to be published; and are accountable for all aspects of the work. LCG, EES, APD, DG, and LD-W contributed to the design of the work and funding acquisition for this study, interpretation of data, revising this draft and its final approval, and are accountable for all aspects of the work. SN, EGC, PM-M, and RD contributed to revising this draft and its final approval and are accountable for all aspects of the work. MEPL, LRB, and PR contributed to the overall study recruitment efforts and acquisition of data by actively participating in the collection process, ensuring adherence to protocol, revising this draft and its final approval, and are accountable for all aspects of the work. KP and LS contributed to the data acquisition and completion of preanalytical phase of blood specimen collection, including standard processing and preparation for the analytical phase of the APOE genotyping, revising this draft and its final approval, and are accountable for all aspects of the work.
Funding
The authors disclosed receipt of the following financial support for the research, authorship, and/or publication of this article: This work was supported by National Institute on Aging grants R01AG070956 to RCM and MJM, and K24AG075240 to MJM.
Declaration of conflicting interests
The authors declared the following potential conflicts of interest with respect to the research, authorship, and/or publication of this article: Dr. Moore is a co-founder of KeyWise AI and has equity interest. The terms of this arrangement have been reviewed and approved by UC San Diego in accordance with its conflict-of-interest policies. The remaining authors declare that they have no competing interests.