
Abstract
Keywords
Introduction
The United States National Institutes of Health Biomarkers Definitions Working Group defines “biological marker (biomarker): a characteristic that is objectively measured and evaluated as an indicator of normal biological processes, pathogenic processes, or pharmacologic responses to a therapeutic intervention.” 1 Biomarkers are mainly measured from blood or tissue samples; genetic biomarkers are discovered through various medical and statistical methods. Meanwhile, the rapid development of various digital measuring instruments that record and analyze the human body has enabled their use in clinical practice. In light of this, digital biomarker research aimed at utilizing information obtained from biosensors such as biomarkers is on an expanding trajectory. The Journal of Digital Biomarkers defines a digital biomarker as follows: “Digital biomarkers are defined as objective, quantifiable physiological and behavioral data that are collected and measured by means of digital devices such as portables, wearables, implantables, or digestibles. The data collected are typically used to explain, influence, and/or predict health-related outcomes.” (Dorsey ER, editor. Digital biomarkers. Basel: Karger.) It has been reported that digital biomarkers tend to be non-invasive or less invasive than conventional biomarkers, and are beneficial in terms of their ease of measurement and cost reduction. 2 Although traditional statistical methods are still used to find digital biomarkers, many machine learning and deep learning methods have been proposed because of the necessity of dealing with raw data of various modalities as they are.
Several cases of the clinical application of digital biomarker research methods for a range of diseases have been surveyed. The use of digital biomarkers collected through mobile and wearable devices in a personalized, non-invasive and continuous way for diagnosis of Alzheimer’s disease has been investigated. 3 The heart rate variability (HRV) as a digital biomarker for continuous telemedicine in daily life through wearable devices has been investigated. 4 Moreover, surveys have also been conducted on applying artificial intelligence (AI) technology to digital biomarker research. Studies using electrocardiogram (ECG) signals as digital biomarkers extracted through machine-learning methods have been investigated for detecting atrial fibrillation (AF). 5 Studies focusing on the application of AI technology on ECG signals for cardiovascular disease management have been surveyed. 6 The deep learning method, one of the AI technologies, has the advantage of pre-processing data by itself without complicated processing by humans and the advantage of high model accuracy. Biosignal processing and analysis using machine learning and deep learning methods have been investigated. 7 On the other hand, in a different aspect, deep learning methods for the fusion or representation of multimodal data, rather than a model for a single modality, have been surveyed.8,9
In this review, we introduce several kinds of digital biomarkers used in recent times, report their clinical applications, and review deep learning techniques used for the supervized learning and dimensionality reduction. As deep learning methods, supervised learning is suitable for predicting a biomarker, and dimensionality reduction through representation learning is useful for processing with multiple biomarkers at once. We first present examples of the application of deep learning in biomarker research, and then comprehensively review research cases of representation learning that encompasses adjacent fields, and present this as a future research direction for integrated biomarker research for multimodal data. It mainly focuses on sending data obtained through noninvasive methods and excludes invasive methods or image biomarkers. We mainly used PubMed to search for clinical cases of digital biomarkers and Google Scholar for technical reporting of deep learning. The search results of RISS were used for research cases written in Korean.
Clinical use cases of digital biomarkers
Different types of sensors are used alone or in combination for obtaining digital biomarkers for a variety of clinical applications. They are largely divided into electrode-based sensors and inertia-based sensors. ECGs are representative electrode-based sensors. The ECG sensor is attached as a patch to the skin surface around the heart in wired or wireless form. Inertia-based sensors are sometimes used in the form of patches or wearable devices, but they are also embedded in smart devices such as smartphones. In this section, clinical cases using each type of sensor, alone or in combination, are introduced, and Table 1 provides a brief summary.
Clinical use cases of digital biomarkers.

ECG: electrocardiogram; ALS: amyotrophic lateral sclerosis; PD: Parkinson’s disease; PPG: photoplethysmogram; EEG: electroencephalogram; AF: atrial fibrillation; GSR: galvanic skin response.
ECG signals
For ECG signals, it is possible to extract derivative signals such as heart rate (HR), HRV, and RR interval, which can also be used together or separately. Many previous studies have considered ECG-based data as digital biomarkers. In the past, cardiac rehabilitation response was evaluated using a wearable ECG sensor, 10 amyotrophic lateral sclerosis (ALS) was monitored by measuring HRV in a disposable electrode patch-based ECG sensor, 11 and assessed by analyzing HRV and respiration through ECG devices in a study the health statuses of fishermen, 12
Activity data
Motion-based digital biomarkers have also been proposed, which are usually measured using accelerometers and gyroscope sensors. Several use cases of motion-based digital biomarkers have been reported, particularly in Parkinson’s disease (PD), where movement or mobility has been evaluated as a digital biomarker. 13 The symptoms of PD were evaluated by measuring tremor and bradykinesia, 14 and the gait fluctuations in PD patients were reported using magnetometers and barometers, as well as accelerometers and gyroscopes. 15 Monitoring neuromuscular disorders in patients with multiple sclerosis and PD using a wearable magnetoinertial sensor has been reported. 16 Wearable inertial sensors have also been used to improve sternal precautions. 17 A study involving patients with cardiovascular disease and focused on the association between the movement of a wrist-worn fitness tracker and existing biomarkers (blood and body composition) has been reported. 18
Other single modalities
In addition to the major modalities mentioned above, sensor data from various modalities are used as digital biomarkers. HR can also be extracted from a photoplethysmogram (PPG) as an optical method, a smartphone-based PPG used to detect diabetes with a deep neural network (DNN). 19 A wearable electroencephalogram (EEG) is also being used as a digital biomarker to identify mild cognitive impairment. 20 Sound can also be used as a digital biomarker, as evidenced from existing studies focusing on recording coughing sounds using a smartphone as a digital biomarker for asthma. 21 Furthermore, using skin-adhesive patches have also been reported. Sweat and skin body temperature were measured using a skin-adhesive electrode-based radio frequency identification bandage, 22 and pH (biomarker for periodontal disease) and nitric oxide concentration (biomarker for heart failure) were measured using wearable biochemical sensors. 23 Smartphones have also been used for detecting biochemical reactions; smartphones were used in a past study to capture the fluorescence image from a cellulose-based wearable patch, which was then used as a biomarker for analysis of sweat components. 24
Multimodal data
A number of studies have used multimodal data from heterogeneous sensors. As a clinical case in which ECG signals and other multimodal signals are used for cardiovascular disease, the risk of asymptomatic AF has been screened using an ECG patch and a wrist-worn PPG device. 25 Furthermore, many physical and cognitive studies of PD have been conducted using EEG, ECG, speech patterns, and kinematics. 26 ECG and ECG-derived parameters, respiratory rate, fluid status, physical activity, and posture have been used to monitor patients with heart failure. 27 The stress response of music performers was also analyzed using an ECG sensor, thermistor, and accelerometer. 28 A study using a multimodal wearable sensor has to measure gait and voice also been reported. 29 Further, dimensionality of multimodal data obtained from an accelerometer, barometer, galvanic skin response (GSR) electrode, temperature sensors, and photo sensors of multisensor wearable devices was reduced using an unsupervised casual convolutional neural network (cCNN), and fatigue was evaluated. 30 Multimodal data from smart devices have also been used as digital biomarkers. For example, correlation analysis of the severity of social anxiety using smartphone records (call logs, text messages, and accelerometers) has been reported, 31 accelerometer data (activity, tremor, and movement) from the smartwatch of a PD patient was collected and stored, 32 and the severity of symptoms in gastroenteritis patients was estimated through activity and sleep data from smartphones and smart watches. 33 Furthermore, ambient sensors placed at a distance from the body have also been used as essential digital biomarkers. For example, in a previous study, the multimodal sensor data, which were used as digital biomarkers for early signs of heart failure decomposition, such as motion sensor, HR, respiration rate, and toss-and-turn counts were transmitted to the cloud, and their correlation with the administered questionnaire was analyzed. 34
Notable deep learning models
The accumulation of large volumes of data and the exploitation of parallel computing resources have accelerated the development of deep learning technology; over the past decade, these deep learning models have been used in various fields of academia and industry, and they are also being actively applied in medicine and healthcare. In this section, we discuss some of the notable deep learning methods and their derivatives and review their effectiveness.
Deep neural networks
Deep learning is a method of building and training a DNN with hidden layers to be mainly used for inference and prediction. Deep learning can be broadly divided into supervised and unsupervised learning. It can be further subdivided according to the type of hidden layer used. Unless otherwise specified, deep learning methods use a fully connected (FC) layer that connects all nodes, and the stacked structure is called a multilayer perceptron (MLP). More detailed techniques based on the types of hidden layers are discussed in the next subsections. Hidden layers are stacked, and the output layer is usually used for classification, which is the case in binary and multiclass classification, here, the sigmoid function and the softmax function are used as activation functions. Figure 1 shows a schematic diagram of this structure. Deep learning models have the advantage of improved model performance through spatial distortion and weight transfer and update through deep structures, which means they include preprocessing, such as feature extraction and dimensionality reduction internally. Due to these properties, digital signals that have undergone minimal pre-processing can be used as digital biomarkers through deep neural networks.

Schematic diagram of digital biomarker research using deep-learning method. Here, the preprocessed data can be used as digital biomarkers by extracting features through a deep neural network model, predicting the result, and evaluating it. Hidden layers can be composed by combining several types of layers according to functions and roles. AUC: area under curve, CNN: convolutional neural network, GNN: graph neural network, RNN: recurrent neural network.
Convolutional neural networks and graph neural networks
The remarkable performance of AlexNet 35 —an image classifier based on a convolutional neural network (CNN)—which won the ImageNet 36 challenge in 2012 for image classification with an overwhelming margin, greatly improved the wider application of deep learning methods. Convolution automatically enabled feature extraction, which had previously been done manually. Research on stacking hidden layers to increase accuracy has been developed; and as one of them, the inception model, which reduces the number of parameters by concatenating a small-sized convolution operation, has been proposed. 37 ResNet, which transmits the original value by adding a residual block as a skip connection, was also proposed. 38 In contrast, models that apply neural networks to graph structures as connections between nodes have also shown remarkable performance; representative examples include the graph neural network (GNN) 39 and graph convolutional network (GCN) 40 .
Recurrent neural networks
Meanwhile, another notable study proposed a deep neural network model based on natural language processing. This model is a recurrent neural network (RNN), which is suitable for dealing with sequential information such as text or time series data. In addition, the following methods were proposed: an embedding method into a low-dimensional vector (Words to vectors (Word2vec)), 41 a method for transmitting information in long sentences (long short-term memory, LSTM), 42 its lightweight model (gated recurrent unit, GRU), 43 a method for paying attention to time points, 44 and a self-attention method without sequential recurrence. 45
Representation learning and transfer learning
Representation learning, also known as feature learning, is used in unsupervised learning to extract features. Convolutional operation of the CNN model is also a type of representation learning, but other DNN-based methods are also widely used. The restricted Boltzmann machine, which is a bipartite graph with latent variables, 46 and the deep Boltzmann machine (DBM), with hidden layers inside, 47 are representative examples. An autoencoder with an encoder–decoder structure 48 and a stacked autoencoder (SAE) with a hidden layer added 49 have also been used.
Additionally, in terms of reusing model weights, transfer learning, which learns a model with big data from one domain and uses it in other domains, is sometimes used.
Deep learning methods for prediction and dimensionality reduction in noninvasive sensing data
In this section, we discuss the application of deep learning methods to noninvasive sensing data in digital biomarker research, which is the subject of this review article. We considered the two main aspects of supervised learning and representation learning: prediction (including classification and regression) and dimensionality reduction (including feature extraction and decomposition). Figure 2 compares the conceptual difference between Figure 2(a) discovering digital biomarkers through supervised learning for each modality and Figure 2(b) discovering an integrated digital biomarker through supervised learning after integrating multiple modalities through representation learning. Table 2 compares the CNN, GNN, and RNN methods, which are mainly used in the supervised learning of digital biomarker research.
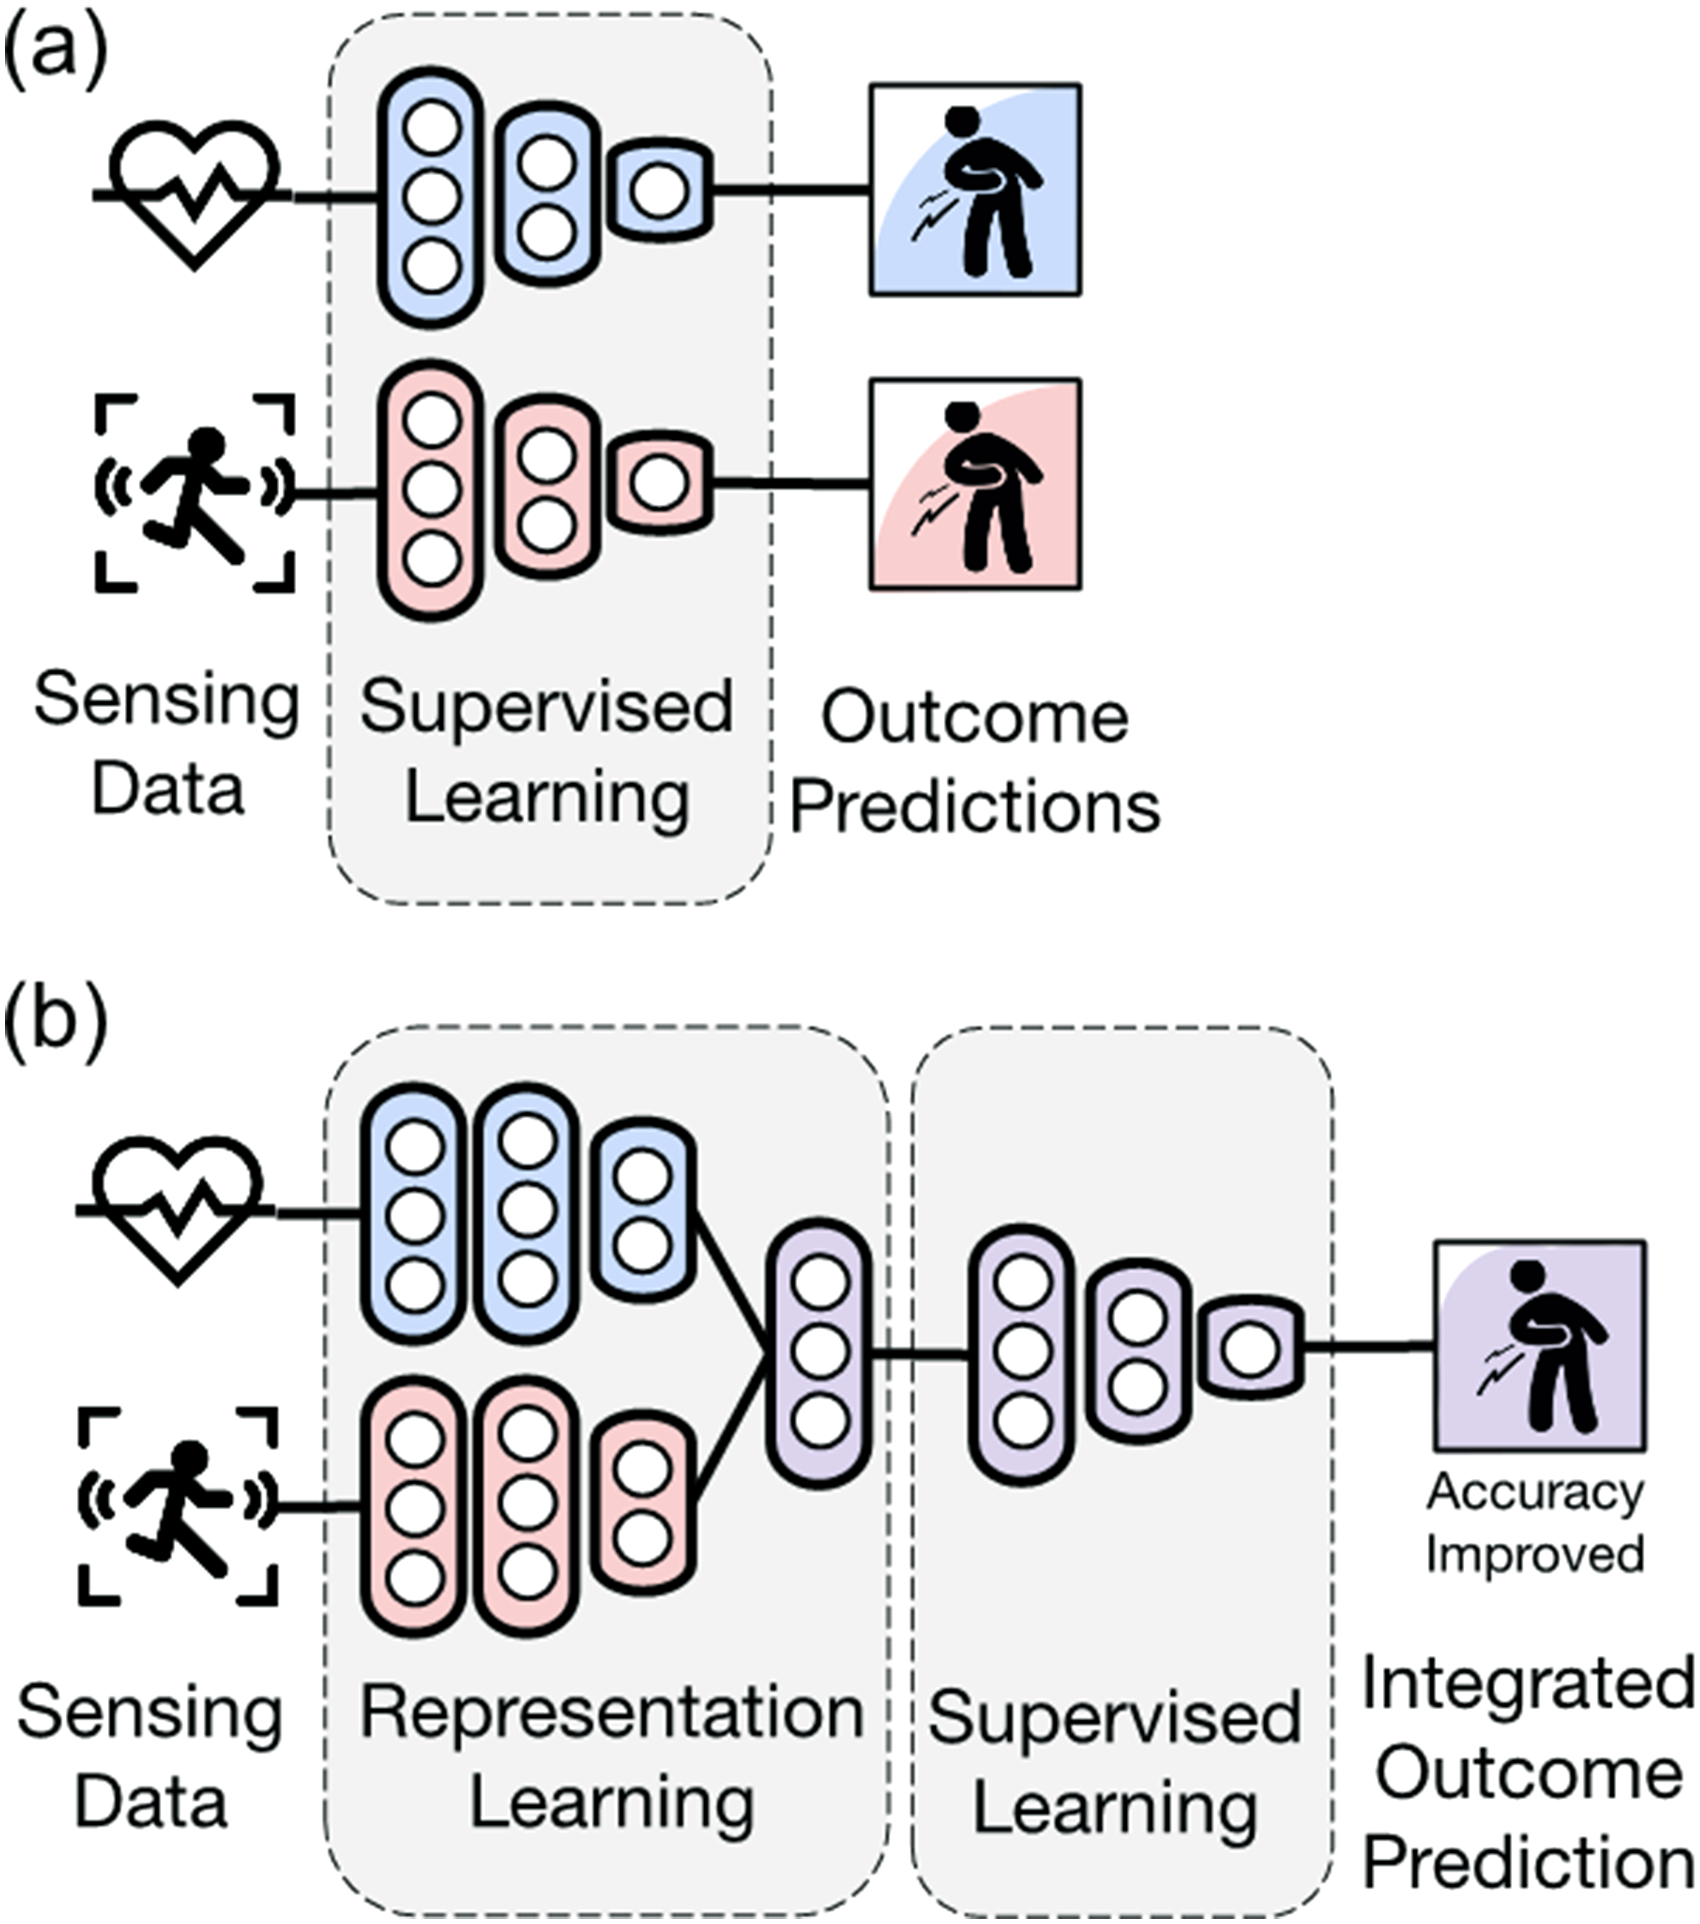
Utilization of multimodal data as digital biomarkers. Here, (a) is for each modality, whereas (b) is for multimodal fusion, which can improve accuracy through representation learning.
Supervised learning method for discovering digital biomarkers.

CNN: convolutional neural network; GNN: graph neural network; RNN: recurrent neural network; FC: fully connected layer; LSTM: long short-term memory; GRU: gated recurrent unit.
The following paragraphs are divided according to the type of sensor, as in the clinical case study in the previous section. ECG signals, activity data from inertial sensors, and other modalities are described, and integrated analysis cases and integrated analysis of biosignals accompanying environmental information are also covered. Table 3 lists the application cases of the deep neural network models according to the type of modality for each sensor mentioned.
Application cases of the DNN model according to the type of each sensor.

ECG: electrocardiogram; BCG: ballistocardiography; CNN: convolutional neural network; ECG: electrocardiogram; EEG: electroencephalogram; DNN: deep neural network; GNN: graph neural network; GPS: global positioning system; HR: heart rate, HRV: heart rate variability, LSTM: long short-term memory; MLP: multilayer perceptron; PSG: polysomnography.
ECG signals
The CNN method is applied to the ECG signals in the following cases. Prediction accuracy of early coronary artery occlusion by constructing a CNN for ECG signals exceeded that by experts. 50 In one study, mental stress was measured with high accuracy of 87.39% by using a CNN model on ultrashort ECG signals rather than the existing HRV-based method (71.17%); 51 for HRV, extracted parameters were used for a length of 5 min, and for ECG signals, a segment with a length of 0.8 s was used. A CNN analysis of the ECG signals was used for noninvasive assessment of dofetilide plasma concentration, 52 which is a nonlinear regression model for ECG segments. Later, these researchers also applied a CNN model for the identification of AF during sinus rhythms of ECG signals. 53 Another group also classified AF by applying the CNN model to ECG signals; 54 furthermore, these researchers used this method to classify sleep apnea. 55 A CNN model was applied to the evaluation of the sleep stages using instantaneous HR extracted from ECG signals. Here, two CNN layers were applied: convolution for extracting local features and a dilated convolutional block for extracting long-range features. 56 A CNN model was used to examine changes in ischemic ST from ECG signal recordings in gait, 57 which was then retrained via transfer learning on an Inception V3 model pretrained with ImageNet data. In another study, multiple classes of myocardial infarction were classified using a model combining CNN and LSTM layers for ECG signals from a portable device. 58 Moreover, a study identified mental stress by combining CNN and LSTM layers for ECG and respiration signals. 59 Here, the CNN and LSTM layers were mixed for each modality, and they were then concatenated to connect the FC layer and the sigmoid layer. It showed a high prediction performance (area under curve (AUC), 0.92) compared with other machine learning methods (0.63–0.80).
Activity data
Studies applying the CNN method to data from accelerometers and gyroscopes have also been reported. PD was diagnosed using the CNN method from smartphone-based accelerometer data, 60 and the severity of PD was predicted by classifying the accelerometer and gyroscope data using a CNN model. 61 Furthermore, a study classified the respiratory patterns using a CNN model on accelerometer and gyroscope data. 62 For motion data from the accelerometer of a smartwatch, two convolution layers and a softmax layer were constructed to classify the five rehabilitation actions. 63 One study predicted freezing of gait by applying an LSTM model to wearable accelerometer data of PD patients, 65 and the accuracy was improved through transfer learning by splitting the sample. A study on detecting abnormal behavior by applying autoencoder and LSTM models to the movement data of dementia patients has been reported. Abnormal behaviors were extracted with an autoencoder that learned the patterns of normal behaviors, after which they were labeled and learnt by the LSTM model. 67 To diagnose PD and essential tremor, high-resolution tremors from patients’ smartphones were captured and classified by combining CNN and LSTM layers. 64 There are also studies wherein a GCN model was applied to human activity recognition (HAR) of time-series data from inertial sensors of smartphones. 66 By dividing the samples, each sample was composed of a graph, and the temporal connection was defined as an undirected edge. After constructing the two GCN layers, an FC layer of softmax activation was combined. In terms of accuracy, the results are higher (100%) than those of existing methods (89.9%–99.9%).
Other single modalities
In addition, data from other single modalities with DNNs have also been analyzed. Sleep-wake states were classified by constructing CNNs on ballistocardiography (BCG) signals; 68 Compared with polysomnography (PSG), this was a simpler and noncontact procedure but showed high accuracy of 94.90%. Furthermore, developmental disabilities were predicted by analyzing smartphone touch information using a CNN model. 69 A CNN model has also been used to diagnose chronic obstructive pulmonary disease by applying it to breathing sounds. 70 A study inferred lung anomalies by applying a CNN model to audio and inertial sensor data from smartphones for pulmonary patients. 71 Depression was diagnosed by analyzing voice samples of PD patients with MLP, 74 which showed high prediction accuracy of 77% compared with other prediction models based on machine learning (0.62–0.76). Encoders, meanwhile, have been applied to predict morbidity and mortality. 75 To measure biological age acceleration, the gait data from the wearable sensor was embedded into the encoder, and age was added to define the biological age. Comparisons between motion-based aging and blood-based aging were found to be related. Depression has also been predicted by applying a GNN model to data from smartphones and wearable devices. 72 The survey results, sensing data (activity, sleep, and HR) and global positioning system (GPS) data were used as node features, and clinical data (diagnosis) were used as true labels. For edges between nodes, similarity etc., was used. Comparing the prediction values from the GNN model and true labels indicated that the accuracy score was higher (80% or more) than those of the traditional method (70% or less). Another study detected driver fatigue by connecting EEG channels with a GCN model. 73 An adjacency matrix was constructed between channels with partial directed coherence as a causal analysis. Local area information and global connection information were combined with the GCN model, and classified as softmax through FC. It showed high accuracy of 83.84% compared with other feature-based deep learning models (63.69%–83.90%).
Integration of multimodal data
In digital biomarker research, deep learning methods have been reported for the integration of multidimensional data. There was also a case of detecting emergency events using a deep learning model that combines video, audio, activity, and dust sensor data. 76 The data correspond to video from CCTV in the home, voice from an AI speaker, activity from a smartphone accelerometer, and dust from the air purifier. As a method for image object detection, a region-based CNN model pretrained with Inception V2 was used, and a Gaussian mixture model was used for sound classification. The fusion method showed a higher accuracy of 94% than many of the models for each modality (89%–94%). The cCNN model has been used as a dimensionality reduction method to evaluate fatigue level (obtained through questionnaire) on multimodal data from the accelerometer, PPG, temperature, GSR, barometer, etc., 30 in which an encoder based on causal dilated convolutions and a triplet loss inspired by Word2vec are combined for representation learning using multiple sensor data. In a study to investigate the brain correlation between task-load and dementia, 77 for classification of the dementia stage from EEG signals and event-related potential with task-load stimuli, tensor-train-decomposition-based 85 dimensionality reduction and an LSTM-based classifier were used. Another study classified a pilot’s mental stress by applying a CNN model to EEG signals and LSTM models to ECG, respiration, and electrodermal activity (EDA) signals. 78 Signals were concatenated in the FC layer and classified as softmax. The stimuli and the corresponding labels were predefined. The approach showed a higher accuracy of 85.2% than the EEG monomodal (77.7%) or other machine learning methods (55.6%–81.4%). One study predicted behavior by applying a transformer (multihead self-attention) model to data from wrist-worn devices (step count, HR, and sleep status) and daily survey data. 80 The model compresses the dimensions with a convolutional encoder, passes through a 4-headed attention layer, and connects a classifier. It showed a higher area-under-curve value of 94% compared with the CNN model (61%) and the eXtreme gradient boosting (XGBoost) model (74%). In addition, the performance improvement was confirmed by dividing the data and using the pretrained model for fine-tuning the small-scale data. In another study, influenza-like symptoms were recognized by applying a GNN model to multimodal mobile sensing data. 79 Data used here are GPS trajectory, Bluetooth encounter trace, and activity (accelerometer and gyroscope), and self-reports are used to infer at least one influenza-like symptom. For each sensing data, features were extracted through the GNN model using a GraphSAGE 86 convolutional layer and then concatenated and classified through FC with sigmoid. It showed higher AUC of 95.39% than other GNN models (67.25%–91.48%) as well as existing machine learning models (65.32%–74.43%). A case of predicting metabolic syndrome by merging lifelog data from wearable devices as well as clinical data and genetic data using unspecified DNNs has been reported. 81
Biosignals accompanying environmental information
In addition, there have been reports of cases of designing a deep learning architecture that also considers biosignals accompanying environmental information. For ECG, EDA, audio, and video data, the prediction of emotional dimension by fusion of the multimodality with bidirectional LSTM model using Pearson’s correlation coefficient as an objective function has been reported. 84 The LSTM layers for each modality were constructed and integrated into the LSTM layer, which showed better results than the single-modality models. In another case, emotions were classified using a model that combines CNN and LSTM layers for not only body physiology data but also environmental information from mobile sensors, 82 which showed a higher accuracy of 94.7% than unimodal-based methods (57.4%–87.4%). On-body physiological data include HR; GSR; motion; body temperature; and environmental information, including noise level, UV, atmospheric pressure, and location information. The CNN-LSTM models were constructed for each on-body, environment, and spatial information, and fused in an FC layer. In another case, by combining CNN and LSTM layers, the driver’s stress level was assessed through multimodal fusion of attention-based CNN-LSTM models using eye data, vehicle data, and environmental data. 83 Self-attention was applied to weighting the fusion layer. Here, eye data included pupil diameter, gaze dispersion, and blinking frequency; vehicle dynamics data included steering wheel angle, brake, and acceleration; and environmental data included distance from the preceding vehicle, time of day, road conditions (lane width and number of lanes), and weather conditions (fog, sun, and rain). The labels were obtained through a questionnaire. The multimodality model showed a higher accuracy of 95.5% than the unimodality model (52.6–85.1%).
Deep learning methods for dimensionality reduction or fusion of multimodal data in other related domains
Because few studies in digital biomarker research have applied deep learning-based dimensionality reduction to multimodal data, we included studies from other related domains that applied dimensionality reduction or fusion models based on deep learning to multimodal digital data in this review. We divided these models into DBM, SAE, and deep canonical correlation analysis (DCCA) models. A comparison of the methods is presented in Table 4.
Deep learning methods for integration of multimodal data.

DBM: deep Boltzmann machine; SAE: stacked autoencoder; DCCA: deep canonical correlation analysis.
Deep Boltzmann machine
The RBM models were used for stream integration of multiple sensors such as accelerometers and angular velocity sensors from smartphones, 87 which consists of a hidden layer for each modality and a combined layer, achieving higher performance compared with other machine learning models. For the diagnosis of Alzheimer’s disease and mild cognitive impairment (MCI), features are extracted through DBM-based representation learning method from multimodal data of magnetic resonance imaging and positron emission tomography. 88 Here, a deep Boltzmann machine consisting of a layer for each modality and an upper shared hidden layer is proposed, and the obtained features are classified using a support vector machine (SVM). Voice and face images from mobile phones were combined using a joint deep Boltzmann machine and used for personal identification. 89 After learning the DBM for each unimodality and learning the shared layer, fine-tuning was performed. SVM was used for classification. In a previous study, a DBM model was used in the bimodal integration of video and text for user recommendation; 90 the image is represented through a CNN model, whereas the text is represented through Word2vec and jointly represented in the DBM layer. In the case of the image, it was reported that more detailed features were added in the case of a single modal, and that the text prediction showed higher similarity.
Stacked autoencoder
First, SAE models were used for integration between multimodalities. For the classification of chronic kidney disease, a method for reducing the dimension of multimodal data such as demographic information and blood test data using an SAE model and classifying it as a softmax layer has been reported. 91 Furthermore, a model for classifying emotions by compression using an SAE model for EEG and electromyography (EMG) data has been reported. 92 Subjects were asked to measure the EEG and EMG signals while watching a video and to evaluate their emotions in response to the video. Pretraining for each unimodality was performed; moreover, fine-tuning was performed by combining multiple modes, and softmax was used for classification.
The following are reported cases in which SAE models are used for the mutual reconstruction of multimodal data. A study detected fatigue while driving by applying an RBM-based deep autoencoder to EEG signals and electrooculogram (EOG) signals. 93 After constructing and joining the RBM layers for each modality, it was reconstructed. The level of fatigue was labeled by tracking eye movements, and correlation analysis using the deep autoencoder showed better results compared with unimodality. Meanwhile, a previous study to classify semantic concepts by constructing a stacked contractive autoencoder for audio, video, and text data was conducted. 94 It involved single-modal pretraining and multimodal fine-tuning and connects the softmax layer to the classifier. Furthermore, another study predicted the missing perceptual information by constructing a multichannel autoencoder related to the three modalities of word, video, and sound. 95 Each modality is embedded through Word2vec, associates in latent space through an SAE model, and decoded according to each modality. According to a study, by fusing multimodal data of temperature, humidity, and illuminance into an SAE model, it is possible to predict other modalities without the use of measurement records. 96 Here, the encoder for each modality is constructed, and after integration in the latent variable layer, it is decoded into each modality again. For emotion detection, a multimodal autoencoder is applied to multimodal data of posture data and EDA data, and classification accuracy is improved by imputation through reconstruction from inter-related contexts. 97 The missing data were input into the encoder and the complete record was obtained as the output. The decoder outputs the imputed values and uses them for the reconstruction. For the classifier pipeline, two feature vectors are concatenated and dimensionally was then reduced using PCA and classified using SVM. It was reported that the multimodal data imputation framework improved the performance of emotional recognition for multimodal data.
Deep canonical correlation analysis
In another reported case, emotions were recognized through DCCA for multimodal signals such as EEG and eye movement. 98 A deep neural network was constructed for each modality, and was then fused through the CCA model and classified as an SVM model. It showed high accuracy of 94.58% compared with the existing methods (81.71%–93.97%). A different study reported multimodality fusion based on the attention mechanism for emotion recognition. 99 For the three modalities of EEG, eye images, and eye movement, the features were extracted with pretrained ResNet with ImageNet data, and a hidden layer was constructed for each, after which they were classified as softmax by fusion with the attention method. This attention method showed a higher accuracy of 82.11% compared with the average weighted sum method (74.66%). For video and motion sensors or video and audio datasets, a temporal fusion model—the correlational RNN—was used for continuous correlation over time. 100 The correlation between one modality and another modality for each time point was obtained using the GRU model; an encoder was constructed by connecting it with the RNN, and a corresponding decoder was constructed. It showed higher accuracy of 96.11% compared with the autoencoder model (94.4%) or the RBM model (95.8%).
Discussion
Deep learning-based methods as the most recent methods for discovering digital biomarkers. In addition to the widely used electrode-based and inertia-based sensors, biochemical-based sensors, satellite-based geolocation, and lifelogs from smartphones such as voice, text, and touch are indispensable digital biomarkers. Furthermore, deep learning methods are not limited to typical data characteristics or the limited functionality of prediction models. The latest methods that utilize various techniques have been proposed, and various application cases of the same have been presented.
Our survey did not collect all clinical cases related to digital biomarkers, but considers the current academic research trends related to the discovery of digital biomarkers and suggests a future research direction. In particular, the link between measurements should not be overlooked. Moreover, connections between devices or between individuals provide mutually enriched information as well as their characteristics. Meanwhile, the integration of multimodality in other related domains has resulted in tremendous progress in research through complementarity and performance improvement between modalities. However, attempts to integrate multimodality in digital biomarker research are still rare. Correlations and predictions between modalities, as well as multidimensional reduction and integrated prediction, are important topics in the selection and discovery of digital biomarkers, and further studies in this regard are needed. For such integration, preprocessing such as time synchronization or matching the format and period of the input is required. In addition, it is worth considering an additional model that prevents communication failure for each input signal of the integrated model and reconstructs data loss in case of data loss.
The integrated digital biomarker will be more useful in studies such as neurological diseases that require data from various sources to be treated together. By considering not only traditional clinical and laboratory data, but also electrode-based and motion-based sensing data, and mobile records, it will be possible to take into account the interaction effect between signals without missing delicate signals from patients. This could help with immediate detection and more accurate prediction of symptoms. In addition, the integrated digital biomarker can be utilized in the study of environmental diseases in which not only the signal derived from the subject but also the surrounding environmental factors must be considered. It will be possible to detect changes in bio-signals for individuals exposed to environmental harmful factors, and lead to immediate action on the aspects of these symptoms.
Abbreviations
atrial fibrillation
ballistocardiography
convolutional neural network
deep Boltzmann machine
deep canonical correlation analysis
deep neural network
electrocardiogram
electrodermal activity
electroencephalogram
electromyogram
fully-connected
graph convolutional network
graph neural network
global positioning system
gated recurrent unit
galvanic skin response
heart rate
heart rate variability
long short-term memory
multilayer perceptron
Parkinson’s disease
photoplethysmogram
polysomnography
restricted Boltzmann machine
residual network
stacked autoencoder
support vector machine
words to vectors
Footnotes
Contributorship
Conceptualization was handled by H Jeong; acquisition of data was taken care by H Jeong, YW Jeong, Y Park, K Kim; funding acquisition was done by DR Kang; investigation was carried out by H Jeong, YW Jeong, Y Park, K Kim; project administration was done by DR Kang; Resources: J Park; supervision was done by DR Kang; visualization was handled by H Jeong; Writing—original draft, Writing—review and editing, approval of final manuscript was handled by all authors.
Declaration of conflicting interests
The authors declared no potential conflicts of interest with respect to the research, authorship, and/or publication of this article.
Ethical approval
This study was reviewed by the Institutional Review Board of Yonsei University Wonju Severance Christian Hospital (Approval number: CR321327).
Funding
The authors received the following financial support for the research, authorship, and/or publication of this article: This work was supported by the Korea Environment Industry & Technology Institute (KEITI) through the Development of a Personalized Service Model for Management of Exposure to Environmental Risk Factors among Vulnerable and Susceptible Individuals Program, funded by the Korea Ministry of Environment (MOE)(2021003340003).