
Abstract
Background
Digital therapeutics (DTx) are promising for treating musculoskeletal disorders (MSD) which contribute significantly to global disability. Despite full reimbursement of certified DTx in Germany and other countries, their utilization remains low, mainly because of uncertainty about how to integrate DTx best into standard patient care.
Objective
Using four years of claims data, this cohort study employs state sequence analysis to describe the claims-documented use of DTx in combination with other therapies and the influence of different care pathways on the change of chronicity risk over time.
Methods
Health claims data of 6090 DTx users from one of the largest German sickness fund were analyzed (2020–2023). First, three treatment events were classified: outpatient consultations, medication prescriptions, and conventional physical therapy. Second, hierarchical clustering based on patient pathways was performed. Third, associations between clusters and the change of the patients’ pain chronicity risk over time (improved vs worsened/equal) were analyzed via binomial logistic regressions.
Results
We identified distinct patient clusters and showed that older and more severe cases were more likely to receive more healthcare services in addition to DTx. Prescriptions of additional pain medications (OR = 2.16, 95% CI: 1.63–2.84, p < .001) and concomitant conventional physical therapy (OR = 1.43, 95% CI: 1.16–1.76, p < .001) were associated with higher odds of reducing chronicity risk, while outpatient supervision levels had no impact.
Conclusion
This study emphasizes the need to individualize the prescription of DTx and supplementary treatments based on patient age and complexity. The combination of DTx and conventional care is especially promising for patient groups with high pain chronicity risks.
Keywords
Background
Musculoskeletal disorders (MSD) are highly prevalent across all age groups, with about 1.71 billion affected persons worldwide. 1 MSD comprise degenerative joint diseases, inflammatory diseases and skeletal disorders (e.g., back pain, osteoarthritis and osteoporosis). 2 Accounting for over 107 million disability-adjusted life years in 2015, the global burden of MSD has increased significantly in the last decades and is continuously rising. 3 Moreover, approximately 17% of the German population suffer from chronic pain, defined as pain persisting for more than three months or recurring intermittently.4,5 Chronic pain is most commonly localized in the back (50%–59%), followed by other joints, including the hip and knee (33%–44%).4,6 MSD and chronic pain impose substantial economic, social, and personal costs, primarily due to lost workdays, reduced productivity, and early retirements, resulting in Gross Domestic Product losses of up to 2% among working-age people in the European Union (EU).5,7 Rising healthcare costs add further strain; in Germany alone, MSD were the leading cause of doctor visits in 2019, with 37.3 million outpatient visits. 8
Medical guidelines emphasize the importance of physical activity, patient education, and self-management as core elements in managing MSD and chronic pain.9,10 Physical therapy is the most common treatment approach for increasing muscle strength and functionality. Given the growing demand for healthcare services, the World Health Organization and the EU promote digital health interventions to complement traditional healthcare services.11,12 Digital health interventions also include digital therapeutics (DTx), which are defined as `health software intended to treat or alleviate a disease, disorder, condition, or injury by generating and delivering a medical intervention that has a demonstrable positive therapeutic impact on a patient's health´. 13 p.1
DTx are a promising treatment option, but there is uncertainty on how to best integrate DTx into standard patient care. This claims data analysis focuses on care pathways involving DTx as stand-alone therapy or in combination with medication, conventional face-to-face physical therapy, and/or supervision by outpatient providers for MSD patients. This study examines three DTx which can be prescribed at the expense of the German statutory health insurance (SHI). Vivira [Vivira Health Lab GmbH] aims at patients with non-specific back pain, while Companion Patella [PrehApp GmbH] and Mawendo [Mawendo GmbH] are geared towards the treatment of knee pain. These apps contain typical contents of DTx, such as health monitoring, symptom tracking, evidence-based patient education, and digitally-guided home exercises 14 Patients independently perform movement therapy guided by the video-based app, with intensity and difficulty levels dynamically adjusted based on user feedback. Recent systematic reviews highlight positive outcomes of DTx for MSD in experimental settings, such as improving functional disability and enhancing quality of life. However, the evidence regarding pain reduction remains inconclusive.15,16 An additional systematic review and meta-analysis of ten health economic studies concluded that DTx for MSD are cost-effective. 17
Since 2020, a so-called fast-track regulatory process allows DTx to be reimbursed by the SHI once approved by the German Federal Institute for Drugs and Medical Devices. 18 These digital medical products are called Digitale Gesundheitsanwendungen (DiGA) and can be prescribed by physicians or psychotherapists, or requested from the health insurance company by the patients themselves, if they have a suitable diagnosis (self-prescription). Despite their potential, DiGA utilization remains below expectations after introduction into the healthcare system. Only 374,377 DiGA were activated for more than 73 million people with SHI in the first three years (2020–2023). 19 For patients with backpain, the most frequently used DiGA Vivira was activated by only 0.01% of MDS patients. 20 In a 2022 survey of 2238 outpatient physicians, only 33.6% had prescribed a DiGA at least once. Among these are a few physicians responsible for a significant number of prescriptions, while most have only prescribed one to five DiGA so far. 21
Physicians in Germany, the Netherlands and other countries are hesitant to prescribe DTx for various reasons.22,23 A scoping review of 29 studies outlines various barriers, both on an app and healthcare system level, for example, data security and prescribing hurdles. In addition, physicians are concerned regarding patients’ adherence to DTx and their clinical effectiveness in the real-world. 23 Currently, few data exist on the real-world use and effectiveness of DTx in the context of established therapeutic concepts.
Using four years of claims data, this cohort study employs state sequence analysis to describe the claims-documented use of DTx in combination with other therapies and the influence of different care pathways on the change of chronicity risk over time.
Research questions
Based on claims data regarding DTx use for MSD, this study investigates the following research questions:
Which care pathways can be identified for DTx users with MSD in terms of outpatient consultations, medication prescriptions and conventional physical therapy? Do different care pathways (DTx stand-alone and combined with in-person treatments) influence the MDS patients’ change of pain chronicity risk over time?
Methods
Data and study population
This longitudinal retrospective cohort study analyzed nationwide claims data of the largest sickness fund in Germany, the Techniker Krankenkasse (TK). The data set comprised all 6090 DTx users for MSD from this sickness fund, which covers approximately 11 million people. The claims data contained information about patient and physician characteristics, inpatient and outpatient treatments, medication prescriptions, remedies, rehabilitation, and preventive measures.
Inclusion and exclusion criteria
Adult patients (at least 18 years of age) who used at least one DiGA for MSD since September 2020 were included in the study. The DiGA pharmaceutical central number was used to identify eligible patients. Patients had to be continuously insured with TK in the observation period, with a tolerated gap of up to 30 days. Patients who died in the follow-up period were included in the analysis. Data of individuals marked with a privacy protection indicator (e.g., persons who objected to using their data for research purposes or employees of the TK) were not included.
Definition of observation periods
Patient-specific observation periods were formed based on the first MSD-DiGA (self-)prescription date. Each observation unit comprised one quarter (90 days), which mirrors the mainly quarterly remuneration in the German healthcare system, especially in the outpatient sector. Each patient's pre-observation period (PO) consisted of eight quarters, and the follow-up period (FU) included two to eight quarters depending on data availability. Due to delays of up to several months in the availability of some claims data, the analysis encompassed all healthcare services until March 31, 2023 (Figure 1). In the data timeframe, three DiGA were listed in the DiGA directory 24 : (a) Vivira for unspecific lower back pain and osteochondrosis; (b) Companion patella and (c) Mawendo for anterior or patella-related knee pain.
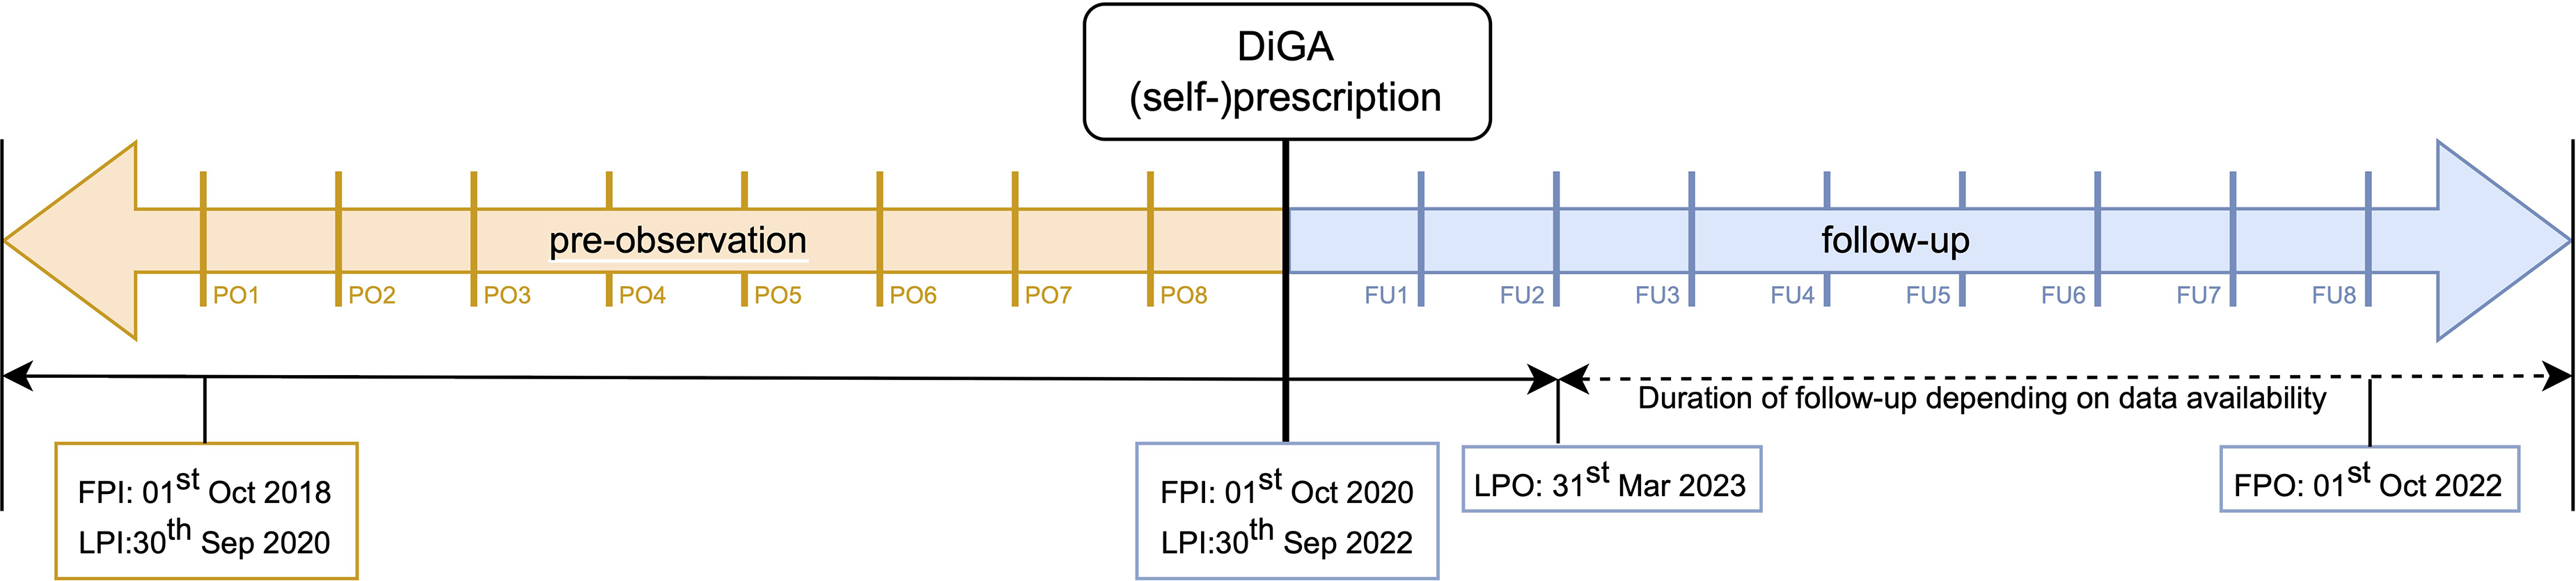
Timeline of the observation periods. Pre-observation (PO), follow-up (FU), first patient in (FPI), last patient in (LPI), first patient out (FPO) and last patient out (LPO).
State sequence analysis
State sequence analysis (SSA) is an emerging method for analyzing patient pathways in health claims data. This method distinguishes patient subgroups with different utilization patterns, outlines the timing of interventions and reveals associated characteristics.25,26 Researchers have applied SSA to examine a range of medical conditions, including heart failure, coronary artery disease, multiple sclerosis, and schizophrenia.25–28 Our SSA comprised the following four steps.
Step 1: Defining states and identifying sequences
For SSA, data were first converted into a wide state sequence format, each row representing one patient. A state sequence of length l is an ordered list of l elements from a finite set of A, the alphabet, containing possible states. The states represent healthcare events that have occurred and were sorted in chronological order. We constructed three types of sequences to represent each patient's care pathway (Table 1). Due to the different lengths of each patient's FU-periods, our sequences were right truncated. The first sequence type included outpatient consultations with a general practitioner (GP), an orthopaedic specialist (O) or other relevant specialists for MSD [e.g., surgeons or rheumatologists (S)]. The second type represented physical therapy prescriptions (Yes = Y, No = N), while the third type indicated patients’ MSD-relevant medications (Analgesics = A, Opioids = O, Antidepressants = AD). For this analysis, the following ATC (anatomical therapeutic chemical) subgroups were summarized under the term ‘analgesics’: nonsteroidal anti-inflammatory drugs and antirheumatics (M01A); other analgesics and antipyretics (N02B); peripherally and centrally acting muscle relaxants (M03A and M03B); antiepileptics (N03A); antipsychotics (N05A); hypnotics and sedatives (N05C); local anaesthetics (N01B). If multiple care events occurred in a quarter, such as a visit to a GP and an orthopaedic specialist, this combination was noted for that state (e.g., GP and O).
Construction of states and sequences.

Step 2: Measuring dissimilarity between sequences
When clustering sequences a distance matrix, indicating the grade of similarity between sequences, is mandatory. We used the longest common subsequence (LCS) approach to create the distance matrix, a specific case of optimal matching. 29 In LCS, two sequences are considered highly similar if they share long subsequences, allowing for gaps between the elements.
Step 3: Clustering sequences
We employed agglomerative hierarchical clustering using Ward's criterion to create homogenous groups of sequences based on the quantitative and qualitative characteristics of the patient pathways.30,31 This iterative process begins with each subject as its own cluster and continues until all subjects are combined into a single cluster. At each step, a sequence merges either with an existing cluster or forms a new cluster based on the smallest distance observed. Ward's criterion minimizes the intra-cluster variance while maximizing the inter-cluster variance at each step. Subsequently, the optimal number of clusters needs to be determined. In our study, we used a combination of visual inspection of the elbow plot and evaluation of the weighted average silhouette width (ASWw).32,33 In the elbow plot, the within-cluster variance (sum of squared errors [SSE]) is plotted against the number of clusters. The course of the graph is reminiscent of an exponential decrease, where at the beginning, an increase in clusters by one means a strong reduction in the SSE and later, the decrease in the SSE becomes less and less for each added cluster. The point where the flattening begins is considered the optimal number of clusters – the ‘elbow’. To back up this visual inspection, we evaluated the ASWw, which measures the consistency of clusters. The metric ranges from −1 to 1, with 1 indicating a perfect inter-cluster separation and a strong intra-cluster similarity.
Step 4: Comparing clusters
Visual and statistical comparisons were performed after creating and determining the optimal number of clusters. For the visual inspection, we first plotted the index plot of each cluster, showing all patient pathways longitudinally. The chronogram, the second plot, displayed the percentage of patients being in a specific state (healthcare event) at a given time (quarter). The third plot is a barplot, which represents the mean time spent in each state for every cluster. For each cluster, we calculated summary statistics on age, gender distribution, DiGA utilization, average total quarterly healthcare costs per patient and chronicity risk. The healthcare costs from the payer perspective included outpatient and inpatient, medication, sickness benefits, remedies, rehabilitation, prevention, and DiGA expenses. A mean value was calculated for each patient for one pre-observation and one follow-up quarter. Pain chronicity risk was stratified using proxies like sick leave days and medication patterns. As defined by Freytag et al., individuals were categorized as high risk when they had more than 42 sick leave days or at least two opioid prescriptions, as middle risk if they had psychological comorbidities, and all others as no risk. 34 The psychological comorbidities considered are presented in Table 2.
Psychological comorbidities considered for chronicity risk categorization.

Chi-squared tests or one-way ANOVA were performed to test if sociodemographic characteristics differ statistically significantly between clusters. All analyses were performed using R Studio. 35 For the SSA and clustering, the TraMineR 36 and the cluster 37 packages were applied.
Logistic regressions
To compare longitudinal health outcomes of patients in different clusters, we conducted binomial logistic regressions. We examined the odds ratios (OR) of improving in the pain chronicity risk (worsened or equal [0] vs. improvement [1]), using a binomial regression model with the cluster as an independent factor and age, gender, DiGA and (self-)prescription as covariates. The change in the pain chronicity risk was measured between one year before (PO5-PO8) and one year after DiGA (self-)prescription (FU1-FU4). This outcome measure represents a suitable proxy for the progression of pain chronicity risk in the absence of clinical parameters in claims data. The algorithm suggested by Freytag et al., building on sick leave days, medication patterns and psychological comorbidities, was developed in a stepwise approach, considering expert opinions while ensuring close fit with the national care guideline.34,38 The resulting algorithm demonstrated a fair validity against the von Korff Graded Chronic Pain Scale in a claims-linked validation study, correctly classifying approximately 70% of cases. 39 Similar proxies have been widely used in claims data analyses to operationalise pain severity and chronicity.40–42
Law, ethics and data protection
All methods carried out in this study adhered to relevant guidelines, including the German Reporting Standard for Secondary Data Analyses (STROSA) and Good Practice in Secondary Data Analysis (GPS). Claims data were provided with authorization from the German Federal Office for Social Security under § 75 of the Social Code (SGB X). The Ethics Committee of the Medical Faculty at the University of Bonn has reviewed the study proposal and raised no ethical or legal concerns (054/23-EP). Individual informed consent was not required, as no experiments or surveys were conducted.
Results
Characteristics of the study population
A total of 6090 patients met the inclusion criteria for the analysis. The patients were predominantly female (65.2%) with a mean age of 45.7 (SD = 13.8) years. About two-thirds of the study population in PO and FU showed no indication of chronicity risk. The proportion of patients with a medium risk rose slightly from 24.4% in PO to 25.7% in FU, while the high-risk group decreased from 8.4% in PO to 7.5% in FU. Vivira was the most frequently used DTx (83.2%), followed by Companion patella (15.3%) and Mawendo (1.5%). Almost all DTx were physician-prescribed (93.9%); mainly by outpatient orthopaedic specialists (72.7%) and general practitioners (8.0%). Patient characteristics are displayed in Table 3.
Patient and DiGA characteristics of the study population.
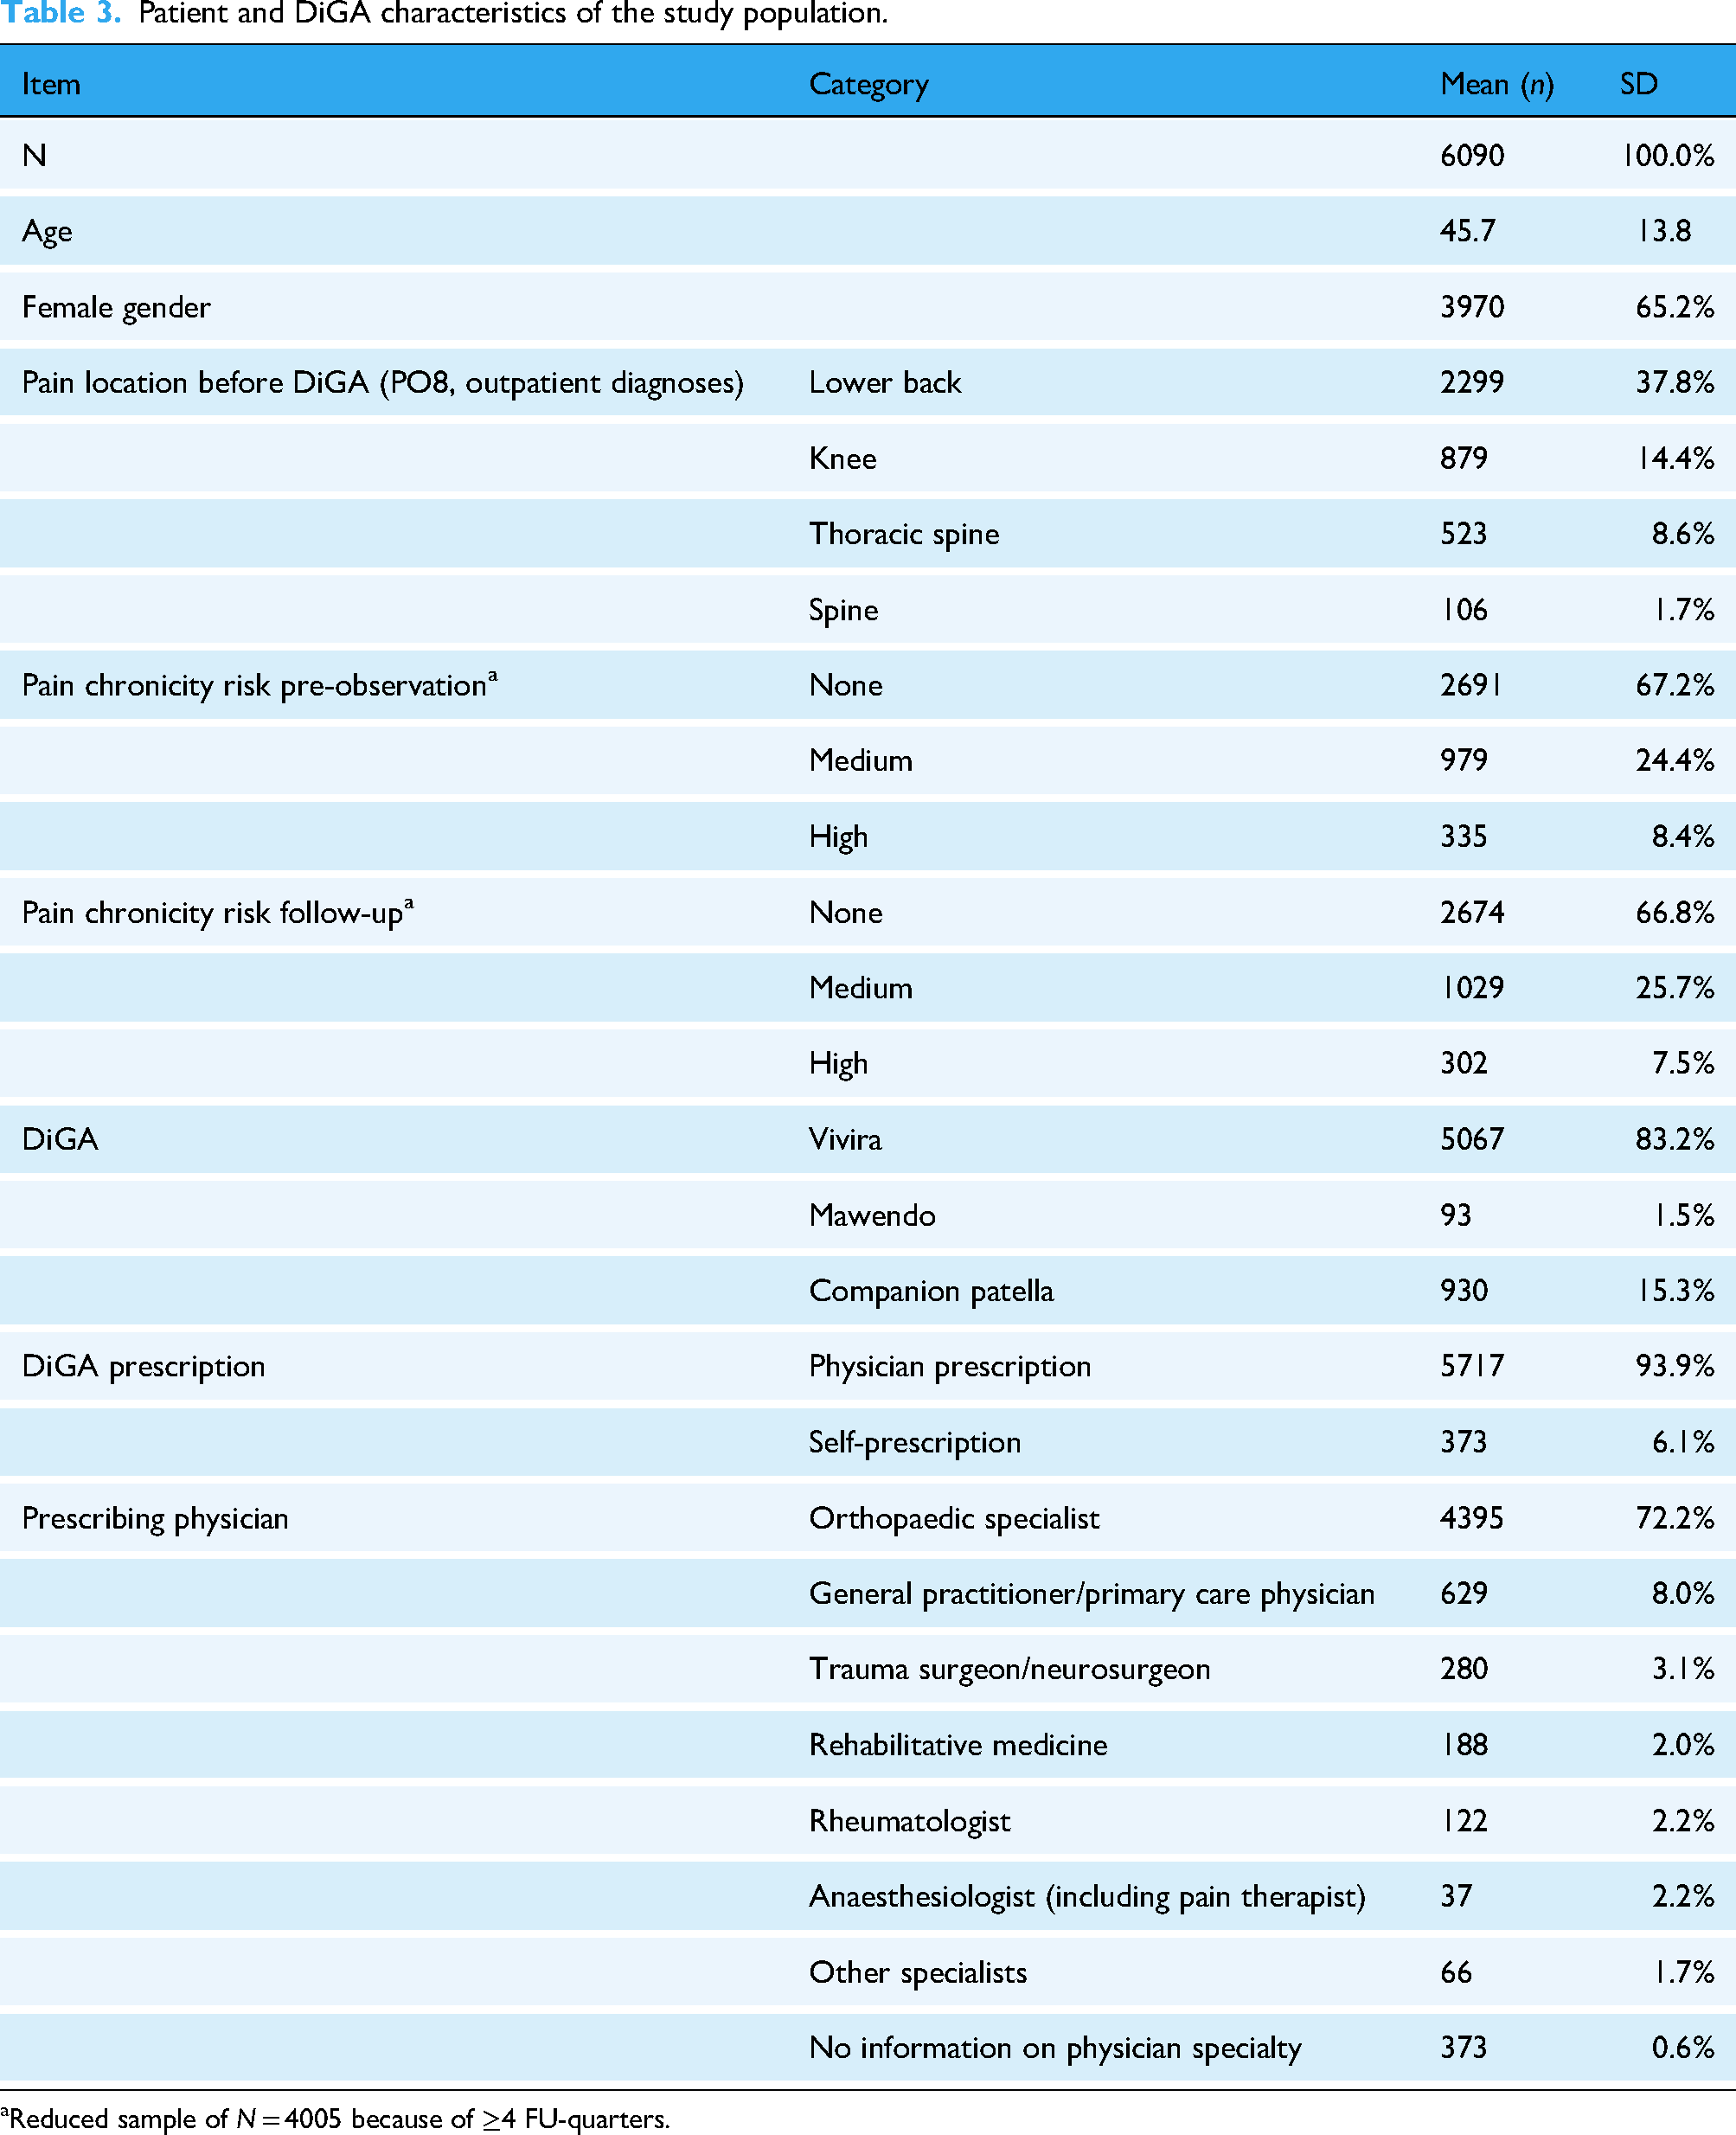
Reduced sample of N = 4005 because of ≥4 FU-quarters.
As presented in Table 4, about 30.0% of patients were on sick leave for at least one day each quarter, with an average duration of five days sick leave. Between 20.6% (FU2) and 34.4% (PO8) of the study population received conventional physical therapy, either overlapping with the DTx prescription or occurring in close temporal proximity. Of the pain-specific medications, physicians prescribed analgesics the most with a peak immediately before the DTx: 42.8% of the patients received at least one analgesics prescription in PO8. Thereafter, the proportion of patients with such prescriptions decreased in the following quarters. Similarly, consultations of orthopaedic specialists peaked in PO8, which corresponds to the high DTx prescription rates in this time period. Although the highest average provision of healthcare services occurred in PO8, the average total quarterly costs were highest in FU1, amounting to €972.53 per patient, primarily due to the costs associated with the DTx itself.
Healthcare utilization of the study population.

Results of clustering and SSA
The clustering algorithm revealed three clusters for outpatient consultations (ASWw = 0.18), two clusters for physical therapy (ASWw = 0.40) and four clusters for medication prescriptions (ASWw = 0.24). The associated elbow plots and silhouette coefficients are presented in the supplemental material (Supplemental material 1).
Cluster results – Outpatient consultations
The first cluster, named ‘General Practitioner – Regularly’, encompassed 2461 patients. More than 60.0% of these received such care in all observed quarters (Figure 2, index plot and chronogram, indicated in blue and green). In addition, in PO8 many patients also consulted an outpatient orthopaedic specialist. A comparable peak in orthopaedic specialist consultations in PO8 was observed in the second cluster (n = 2651), labelled ‘Event-related Orthopaedic Specialist Care’ (chronogram). This trend aligns with the observation that orthopaedic specialists were the predominant prescribers of DTx. Generally, patients within the second cluster demonstrated fewer outpatient consultations compared to the other two clusters (indicated in grey), except for the quarters prior and after the DTx use (PO7-FU2). The third cluster ‘General Practitioner & Specialist – Regularly’ comprises 978 patients who primarily received regular GP care while between 40.0% and 70.0% received additional orthopaedic or specialist care over several quarters (chronogram, indicated in green shades).

Index plot, chronogram and barplot of mean time spent per state of each outpatient consultation cluster.
Cluster results – Physical therapy
The clustering process of physical therapy prescriptions revealed two clusters. The first cluster, ‘Physical Therapy – Occasionally’, comprised 4036 patients (66.3% of the study population). Most patients in this cluster did not receive conventional physical therapy in addition to DTx in any given quarter (Figure 3, indicated in grey). However, during the peak quarter (PO8), approximately 20% did receive conventional physical therapy treatment, as presented in the chronogram. The second cluster, ‘Physical Therapy – Regularly’, consisted of 2054 patients with about half of them receiving physical therapy over time (barplot). Most physical therapy prescriptions in this cluster aligned closely with the timing of the DTx prescription (chronogram). The observed increase in physical therapy prescriptions towards the end of the follow-up period (blue in the chronogram) is attributable to the decreasing number of patients in the right-truncated pathways. This does not necessarily reflect an actual rise in the number of prescriptions.

Index plot, chronogram and barplot of mean time spent per state of each physical therapy cluster.
Cluster results – Medication prescription
Four distinct clusters were constructed. The first cluster with 1044 patients was characterized by consistent long-term analgesic prescriptions and is therefore labelled ‘Analgesics – Regularly’. A subset of these patients also received prescriptions for antidepressants and opioids. The second cluster with 1877 patients was labelled ‘No Medication’, because these patients did hardly receive any prescriptions (Figure 4, chronogram, indicated in grey). The third and largest cluster, comprising 2752 patients, is labelled ‘Analgesics – Occasionally’. Although the majority of patients in this cluster did not receive medications, approximately 30.0% were prescribed analgesics during PO8, just prior to the quarter with the DTx (chronogram). Similar to physical therapy, an increase in medication prescriptions was seen in the follow-up quarter, partly due to patient dropout after FU2. However, unlike the clusters ‘Analgesics – Regularly‘ and ‘No Medication’, the reduction in medication prescriptions after the DTx quarter was not as strong (FU1).
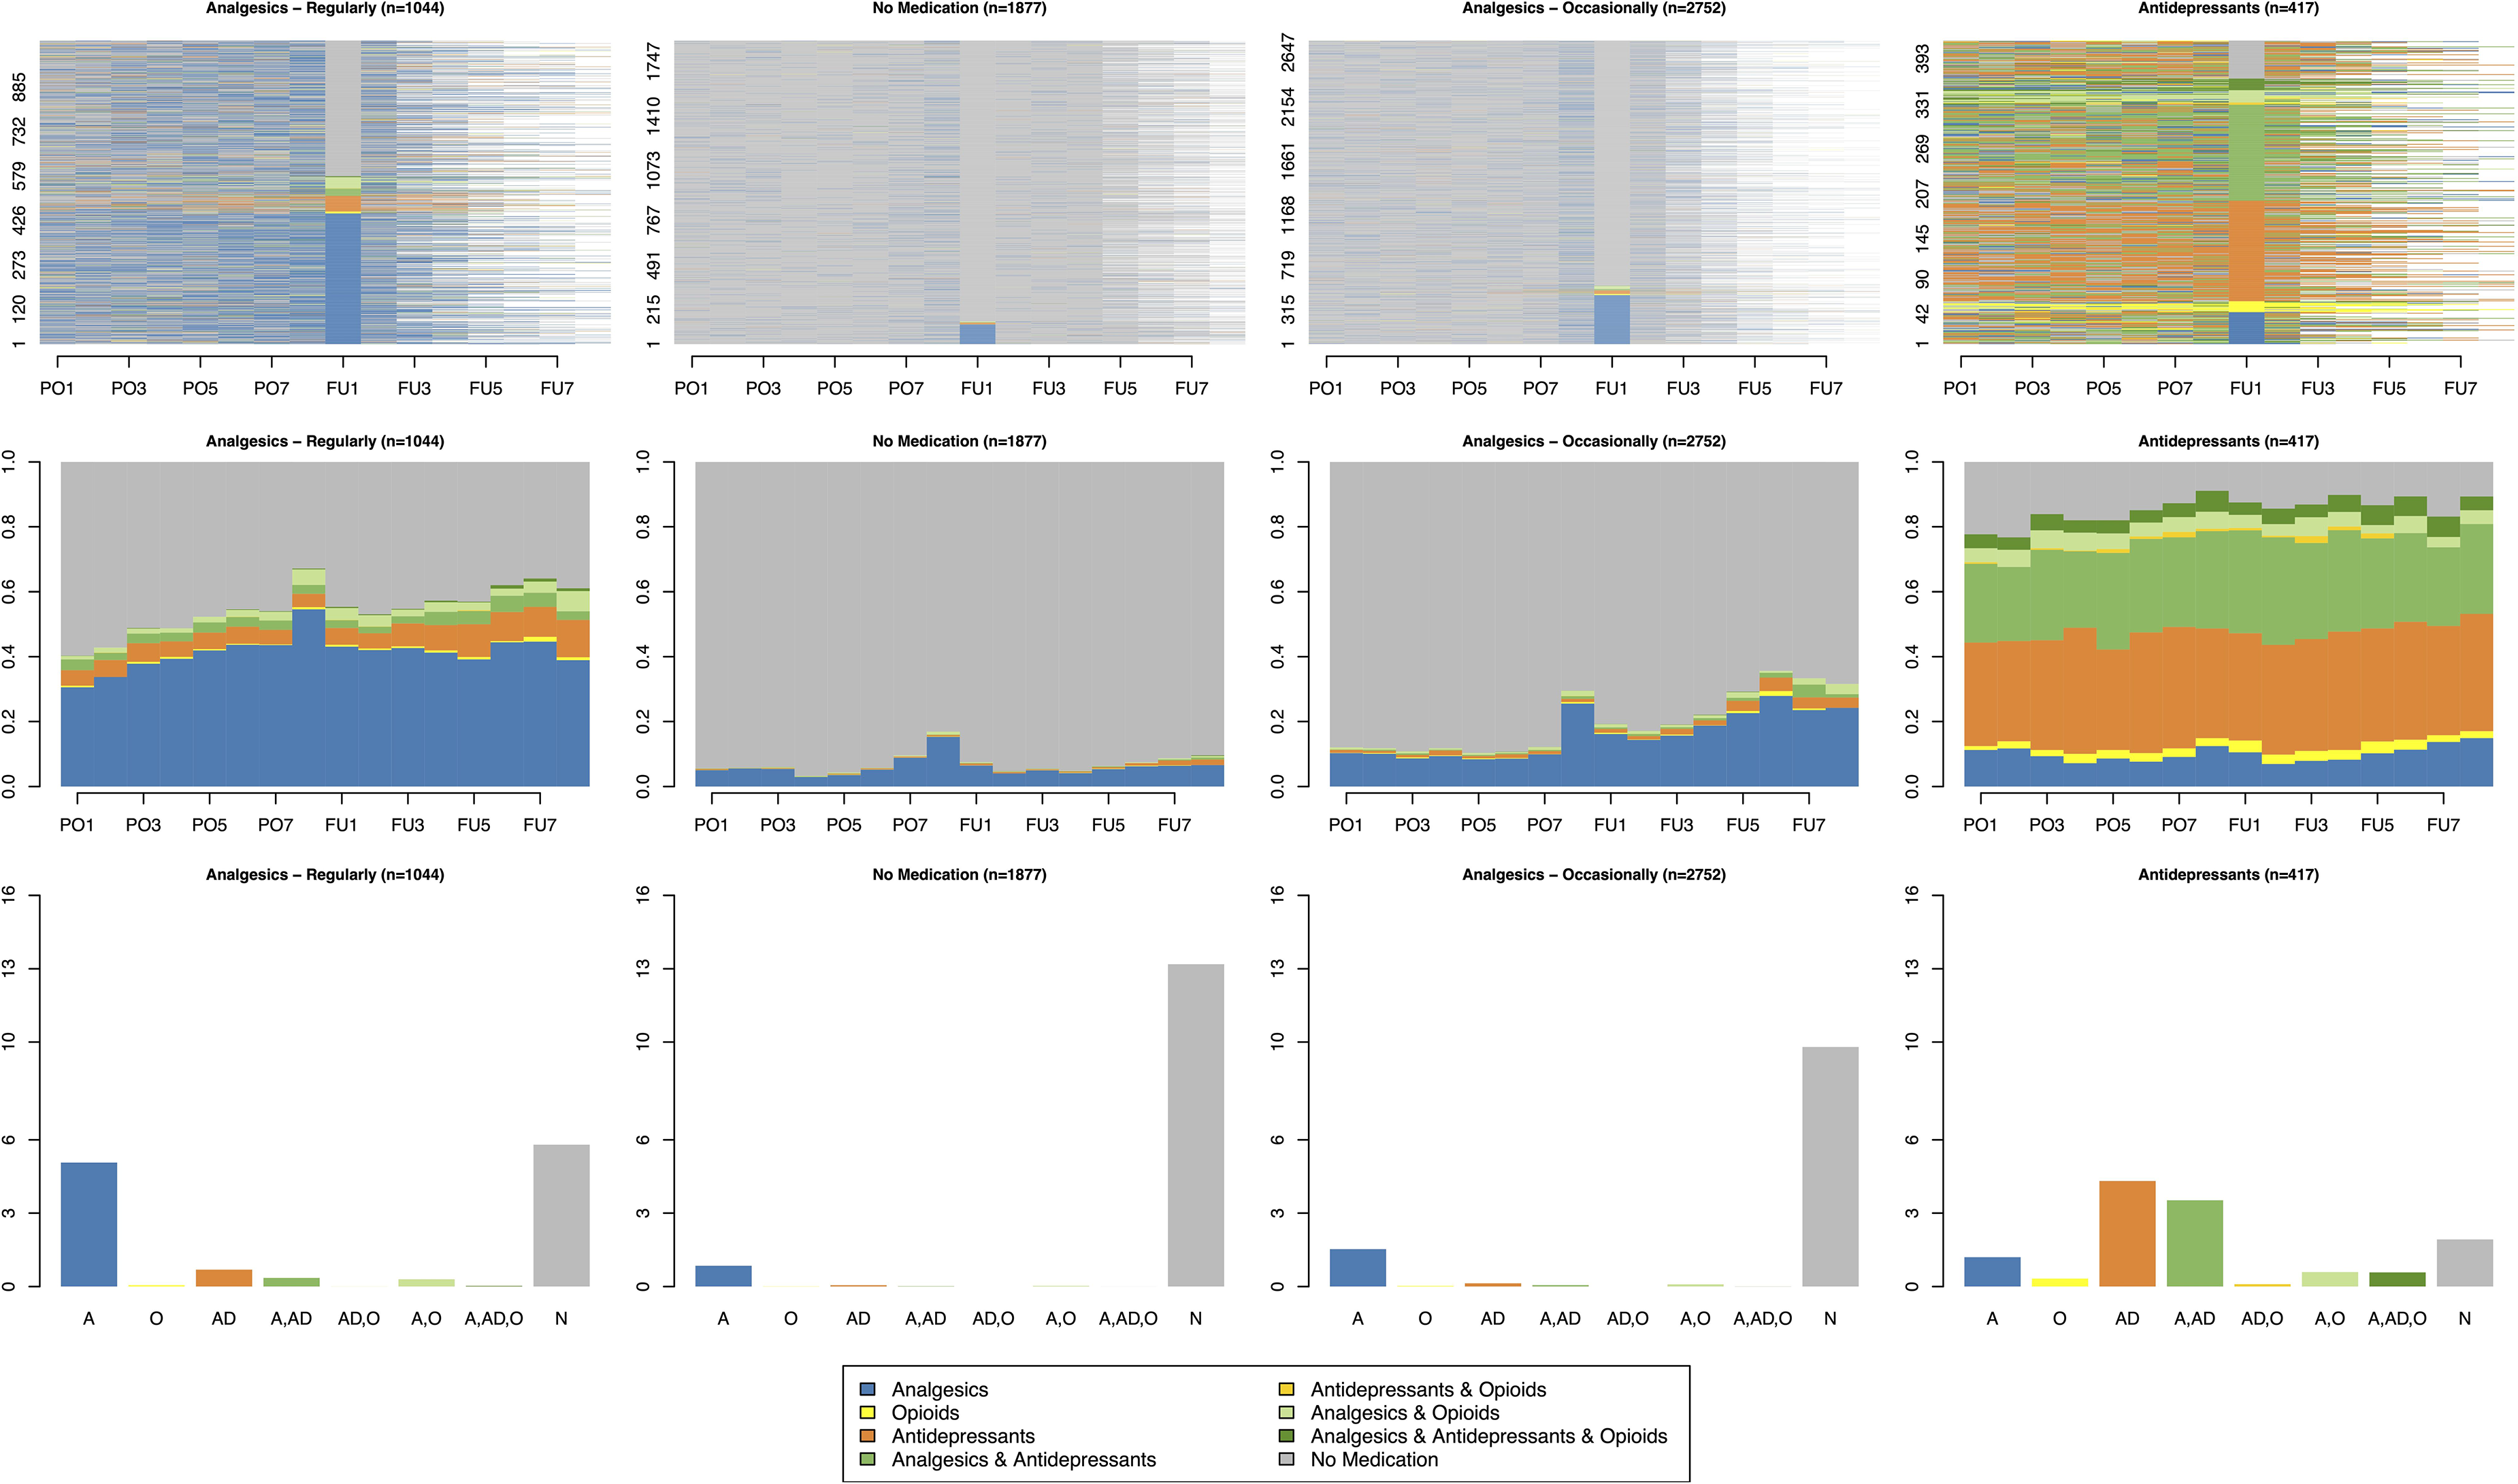
Index plot, chronogram and barplot of mean time spent per state of each medication cluster.
The fourth and smallest cluster, labelled ‘Antidepressants’, included 417 patients who had the highest proportion of prescribed medications. Almost half of these patients took antidepressants regularly, often alongside with analgesics. This cluster also had the highest proportion of opioid medications.
Characteristics of the clusters
Table 5 summarizes the sociodemographic and medical characteristics of each cluster. Older patients and those at higher risk of pain chronicity tended to receive more healthcare services in addition to DTx. This trend is evident in the clustering of the outpatient consultations: In the ‘Event-related Specialists’ cluster, the mean age was 41.5 years (SD = 12.6), with only 5.7% of patients classified as high risk for chronicity prior to the DTx. In comparison, the ‘General Practitioner and Specialist - Regularly’ cluster showed a higher mean age (M = 51.9, SD = 13.9 years) and 14.9% of patients at high chronicity risk. Age and chronicity risk differed significantly between these clusters (p < .001).
Characteristics of each cluster.

Reduced sample of N = 4005 because of ≥4 FU-quarters, SD = Standard deviation.
A similar pattern was observed in the physical therapy clusters, where older patients with higher chronicity risk were more likely to receive conventional physical therapy in addition (p < .001). Among the medication clusters, the ‘Analgesics – Regularly’ (M = 49.8, SD = 13.0 years) and ‘Antidepressants’ (M = 50.1, SD = 12.5 years) clusters had the highest mean ages. Again, in these two clusters patients received most medication. Notably, the ‘Antidepressants’ cluster included the highest proportion of women (77.7%). In contrast, the ‘No Medication’ cluster comprised the youngest patients (M = 44.2, SD = 13.9 years) and the lowest proportion of patients with high chronicity risk before the DTx (self-)prescription (3.1%). While sociodemographic differences were apparent across clusters, DiGA patterns remained consistent: Vivira for back pain was the most frequently used DTx, and nearly all DiGA were prescribed by physicians. All sociodemographic characteristics differed significantly between the clusters (p < .001), except for the mode of DiGA prescription (self- vs. physician prescribed).
Results of logistic regressions
No statistically significant associations were detected between the outpatient consultation clusters and changes in pain chronicity risk over time (Table 6). Regardless of the intensity of the outpatient consultations, patients showed improvements in chronicity risk. Yet, the trend suggests that higher levels of outpatient supervision were associated with higher odds of reducing the chronicity risk (OR = 1.11, 95% CI: 0.89–1.39, p = .35 for ‘GP – Regularly’ and OR = 1.30, 95% CI: 0.97–1.73, p = .07 for ‘GP and Specialist – Regularly’).
Results of logistic regression – outpatient consultations.
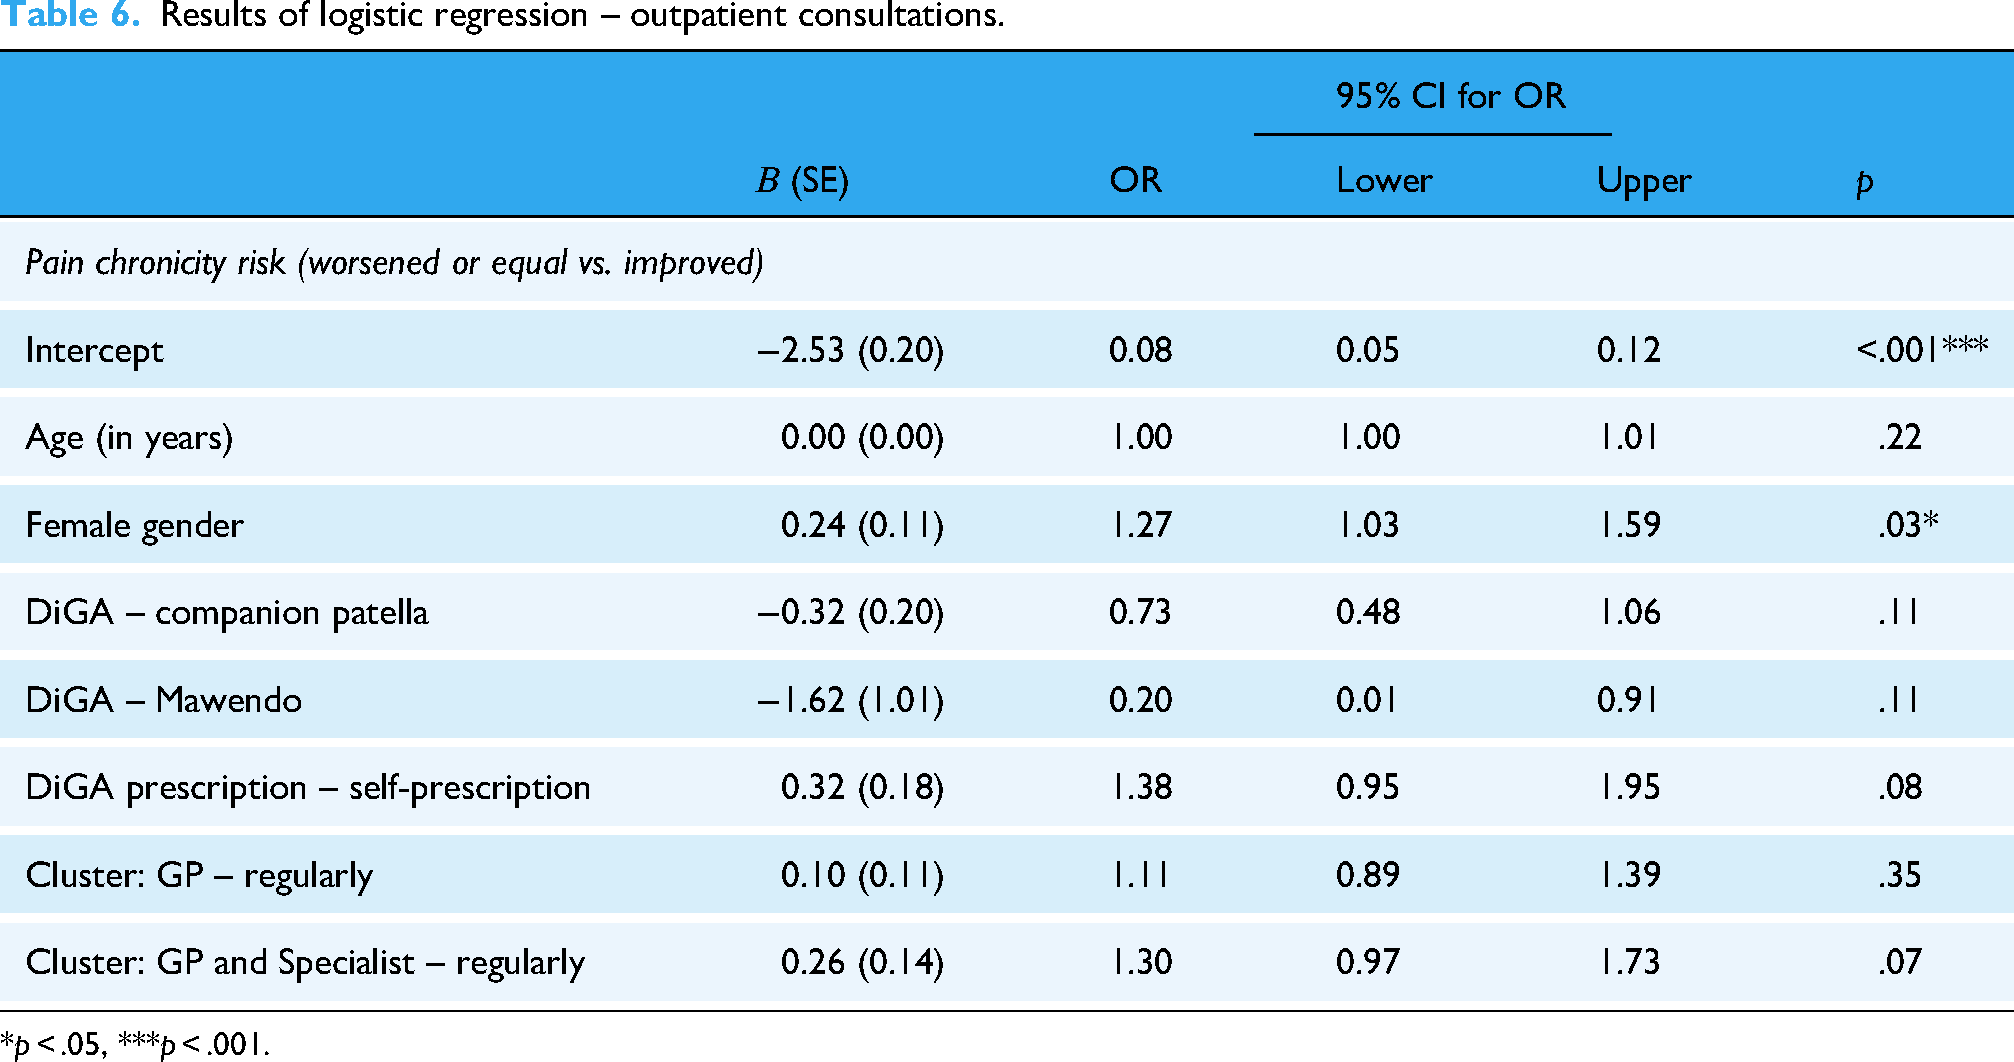
*p < .05, ***p < .001.
The binomial logistic regression regarding physical therapy clusters revealed that patients receiving conventional physical therapy in addition to the DTx had a 1.43 times higher OR to improve compared to patients without physical therapy (95% CI: 1.16–1.76, p < .001). Apart from the cluster, no other predictors significantly influenced the change of the chronicity risk (Table 7).
Results of logistic regression – physical therapy.
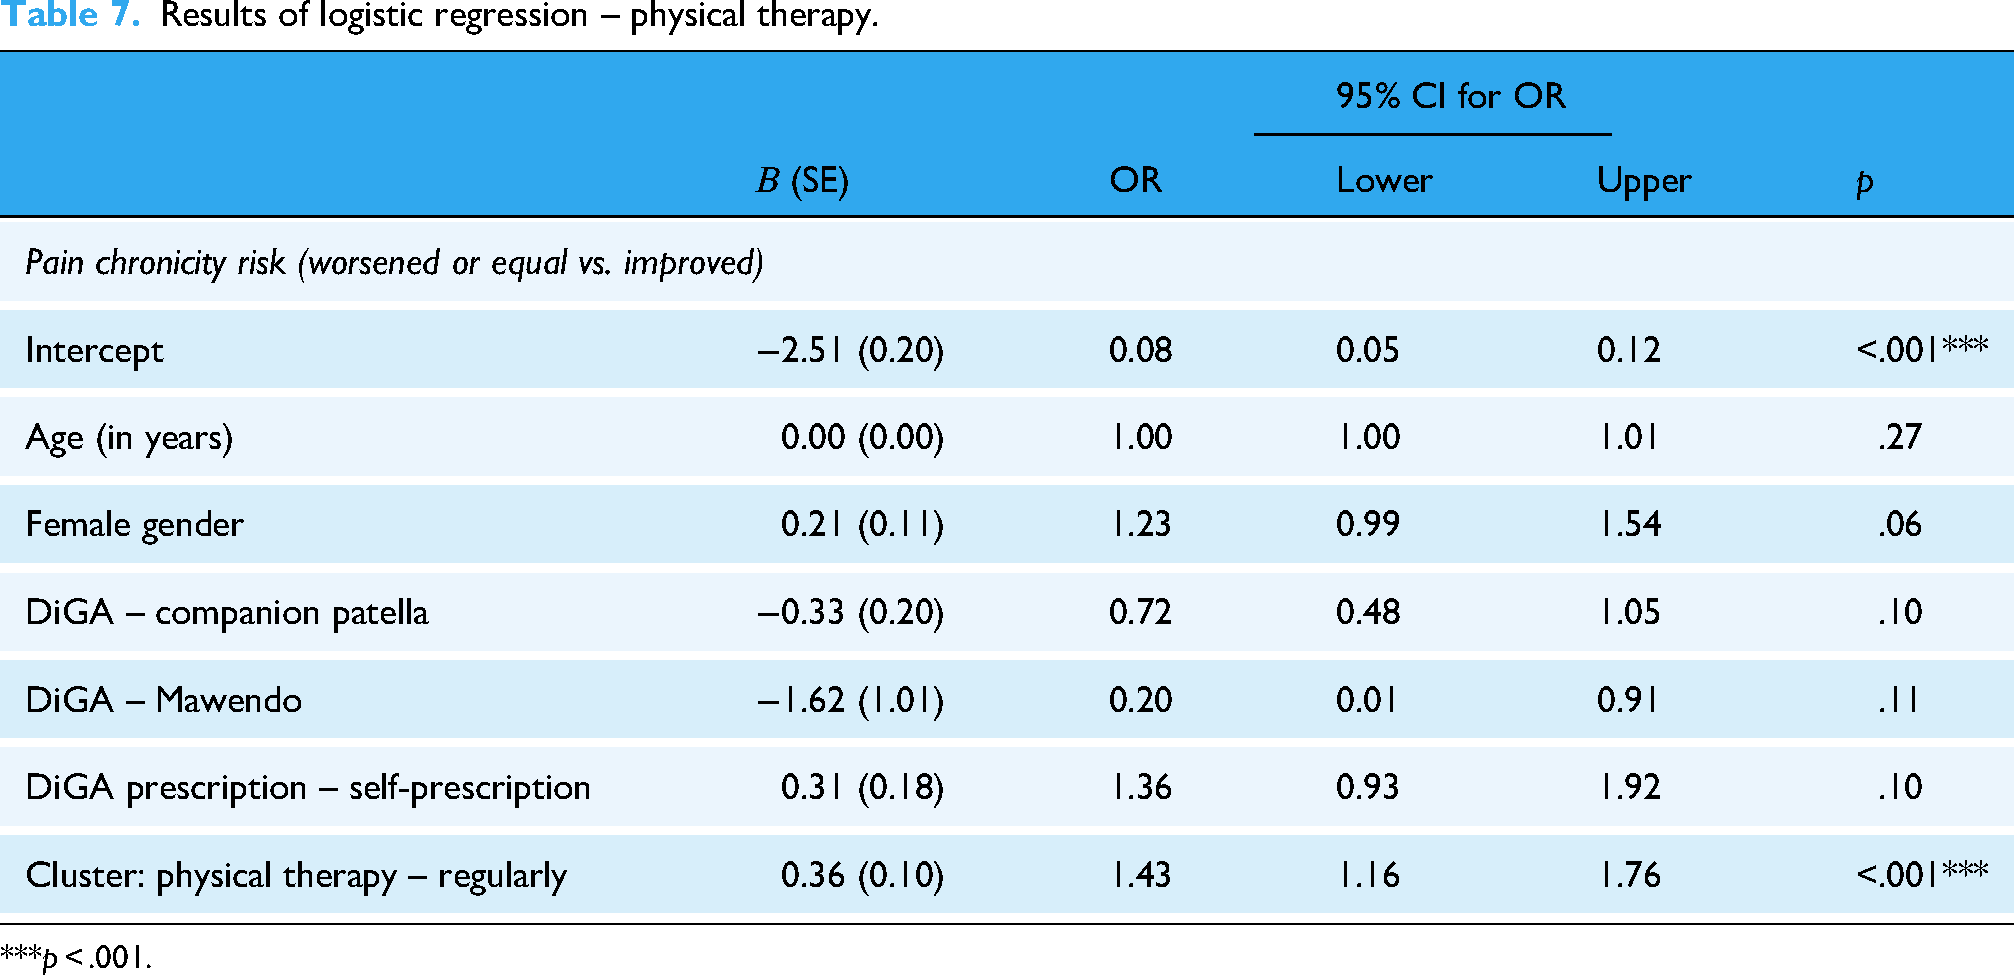
***p < .001.
Patients belonging to the clusters ‘Analgesics – Occasionally’ (OR = 1.78, 95% CI: 1.41–2.25, p < .001) or ‘Analgesics – Regularly’ (OR = 2.16, 95% CI: 1.63–2.84, p < .001) had higher OR of improvement in chronicity risk compared to patients in the ‘No Medication’ cluster, when controlling for sociodemographic factors (Table 8). However, for the fourth cluster with patients who used antidepressants and opioids regularly, no statistically significant difference in the OR was observed (OR = 1.36, 95% CI: 0.88–2.03, p = 0.15).
Results of logistic regression – medication prescription.
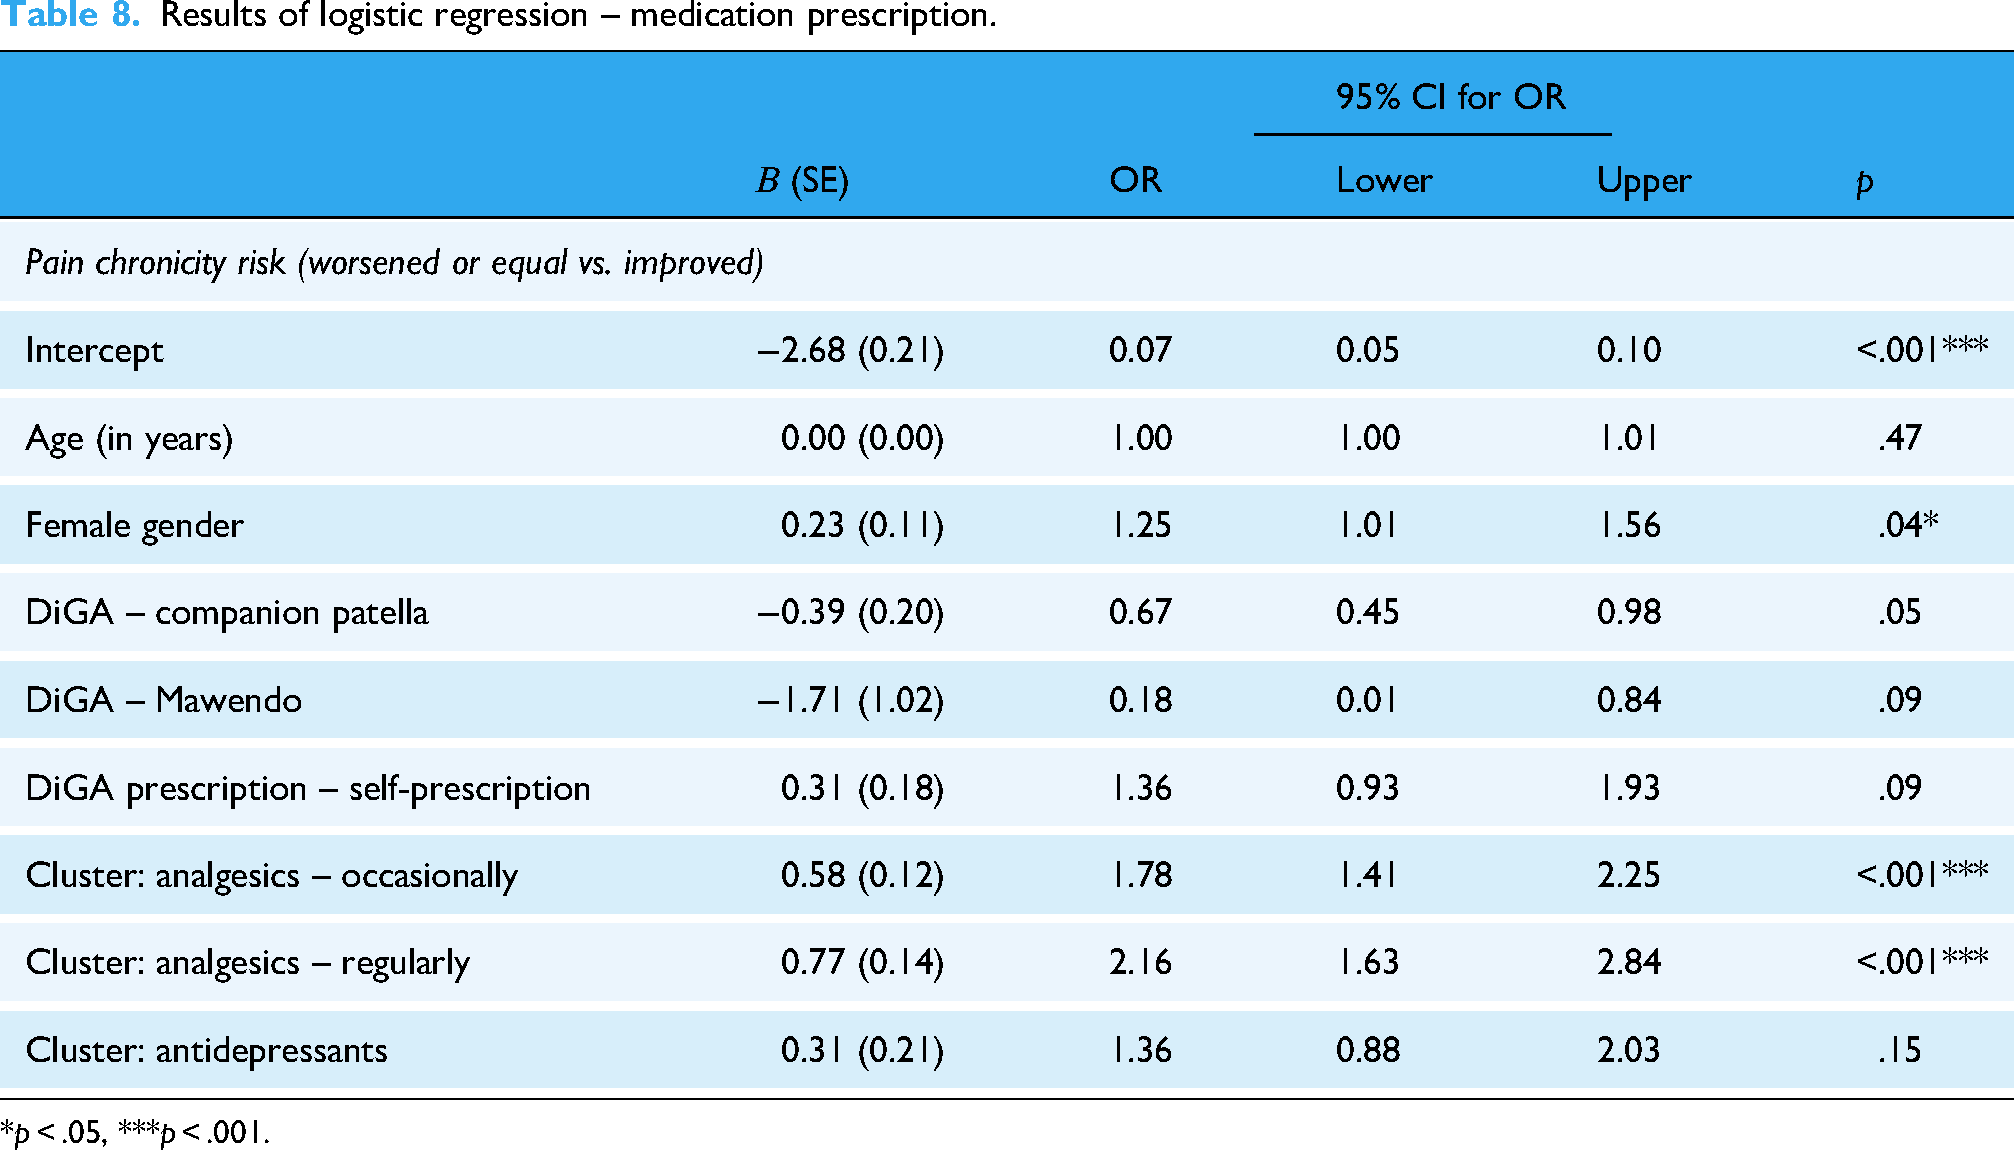
*p < .05, ***p < .001.
Discussion
Principal findings
Based on claims data from the first years of DiGA introduction into the German healthcare system, we identified distinct clusters of patient pathways and described the sociodemographic and medical characteristics of the associated patient groups. Older patients and those with more severe cases received more healthcare services in addition to DTx, compared to younger patients and less severe cases. While prescriptions of additional pain medication and physical therapy were linked to higher odds of reducing patients’ chronicity risk following DTx prescription, we found no statistically significant differences in how this risk progressed over time based on varying levels of outpatient supervision. These results offer valuable insights into the real-world adoption of DiGA for MSD based on health claims data.
Digital (DTx) and conventional physical therapy
In our regression analysis, concomitant in-person physical therapy led to higher OR for reducing pain chronicity risk. Such an approach combines the benefits of both therapies, the high scalability and accessibility of DTx and the personal contact and individualization of traditional physical therapy. DTx offer the potential to reinforce the impact of conventional therapy, for example, by improving adherence to home exercises. A systematic review of video-based telerehabilitation led to 8% higher attendance and 9% better exercise adherence compared to in-person physiotherapy, with similar satisfaction levels. 43 Similarly, a systematic review and meta-analysis on DTx for MSD showed that self-reported exercise adherence was higher in digital rehabilitation compared to non-digital approaches at mid-term, but not short- and long-term follow-up. 44
Prospectively, comprehensive blended physical therapy concepts may show important benefits but hardly exist in Germany and other countries. Weber et al. identified multiple reasons for the slow implementation of blended physical therapy in osteoarthritis via a Delphi study with physical therapists, patients, and healthcare stakeholders. 45 This study highlighted several requirements on different levels, including personal factors (e.g., patients’ and healthcare providers’ acceptance of digital health), intervention-related factors (e.g., individualization options and usability), organizational factors (e.g., practice setting and interprofessional communication), and system-related factors (e.g., data protection, legal aspects and reimbursement structures). 45 Currently, it is up to the healthcare providers and patients to decide, whether DTx is a suitable treatment option, and to what extent additional healthcare measures may be beneficial.
Role of outpatient specialists and GPs in DTx treatment
In the German healthcare system outpatient specialists and GPs have an important role in prescribing and supervising the use of DTx. In our analysis, almost all DiGA were prescribed by a physician, mainly outpatient orthopaedists or GPs. As described by in a qualitative study on enablers and barriers to the adoption of DiGA, providers need to consider the patients’ motivation and (e)-health literacy when proactively offering these new treatments. 46 Therefore, physicians’ acceptance of DTx is essential. They need comprehensive information about the apps’ content, effectiveness, and quality, as emphasized in a prior systematic review. 47 In our study, we mainly observed the ‘early adopters’ of DiGA, who were the first to try DiGA as a new healthcare component.
Once prescribed, the physician's professional advice influences patients’ acceptance and adherence to DTx, 46 which is particularly relevant given that adherence to DTx is generally low.48,49 For both knee injury apps analyzed in our study, either no adherence parameter was reported 50 or the study results have not been published yet. For Vivira, the DiGA for back pain, real-world data collected from 3629 patients after market entry revealed substantial drop-off rates: within the first two weeks 48.9%, within four weeks 36.6% and after 12 weeks only 12.6% of users remained active. 51 Another post-marketing study of 7628 Vivira users found that adherence to the app was associated with pain reduction. High users (≥3 routines per week, 64.9%) and intermediate users (≥2 routines per week, 17.8%) were 9.0% (95% CI: 6.7–11.5) more likely to achieve clinically significant pain reduction (≥30% on the Verbal Numeric Rating Scale) compared to lower user group. 52 Since the POs of these two studies overlap with our data, we assume a similar distribution of frequent and infrequent users in our study population. Given the association between adherence and treatment success, one potential strategy to improve patient engagement with DTx could be a stronger involvement of healthcare professionals. The literature emphasizes physicians’ key role not just in introducing patients to DTx but also in actively supporting their adherence through scheduling structured follow-ups, setting achievable goals and monitoring progress.53–55
Interestingly, we observed that the frequency of patient-physician-interactions did not influence the change of pain chronicity risk. Notably, all patient clusters demonstrated improvement, irrespective of the level of physician engagement. Two factors may play a role: First, the data do not reflect the exact number of physician contacts, but whether at least one contact occurred within a quarter. Due to the partially flat-rate billing of services in German healthcare reimbursement, it is impossible to account for the actual number of contacts. In addition, there was no cluster mainly without services, which could have served as a reference category. Almost all patients received outpatient services, particularly around the time of the DiGA prescription (PO8 and FU1).
DTx and medications
As expected, the SSA showed that analgesics were the most frequently prescribed medication for MSD. They also served as an important predictor for improvement of chronicity in the logistic regression. In three of the four clusters formed, analgesics were the primary medication, with a peak in the last quarter before the DiGA prescription (PO8). Thereafter, medication prescriptions in the clusters ‘Analgesics – Regularly’ and ‘No Medication’ decreased to the initial level, while in the cluster ‘Analgesics – Occasionally’ the initial level is not reached again and a trend towards increasing prescriptions can be observed. This is consistent with the mixed results from the literature: While findings of Hans indicate that Vivira reduces analgesics use in a twelve weeks follow-up when compared to conventional physical therapy, 56 such results could not be replicated for the DiGA Kaia for unspecific back pain (listed in the DiGA directory since February 3, 2023). 57
In our real-world results, patients in the ‘Antidepressants’ cluster (patients with opioids and antidepressants, often in combination with analgesics) received stable medication over time, because this cluster represents the oldest patients and the highest rate of chronic conditions. It is therefore debatable whether Vivira, Companion patella or Mawendo are optimal for treating MSD in such complex cases. A DTx focussing on chronic pain management incorporating cognitive behavioural therapy as a primary approach could be (more) beneficial.
Strengths and limitations
This study was based on comprehensive healthcare claims data, which were analysed using the innovative SSA method: The claims-documented uptake of DTx was described in the context of other healthcare measures in a longitudinal manner. The association between different care pathway clusters and changes in chronicity risk was analyzed using logistic regressions. Relevant for stakeholders, these results outline the integration of DTx into care in real-world settings. Our results from the German setting can be compared to DTx internationally, e.g., the NHS Digital Health Apps Library or the USA's 510(k) premarket notification.
Some limitations constrain the validity of our analysis. It was not feasible to observe data from a control group of non-DiGA users. To address this, we formed clusters. Health claims data inherently have limitations, 58 which also apply to our analysis. Specifically, they are restricted to services reimbursed by the sickness fund, excluding over-the-counter medications that patients may have used additionally. Moreover, assessing effectiveness through clinical parameters was not feasible, so we used the pain chronicity risk as a surrogate measure. Additionally, we were unable to account for patient adherence to the DTx and other therapeutic measures. However, only patients who successfully activated the DTx were considered for our analysis. Moreover, the cluster analysis showed a comparably low ASWw, especially for the outpatient consultations (ASWw = 0.18) and for medication prescriptions (ASWw = 0.24) clusters, which can be explained by the high variance of states and states-combinations over up to 16 quarters.
Conclusion
Our study provides important insights into the distinct care pathways regarding DTx prescriptions for MSD in real-world settings. While simpler cases can be managed with DTx alone, more complex cases with higher chronicity risk and older patients may benefit from blended approaches with additional conventional therapies. Future research should focus on the development of patient-centred, blended care models integrating DTx into broader treatment pathways.
Supplemental Material
sj-docx-1-dhj-10.1177_20552076251378626 - Supplemental material for Care pathways combining digital therapeutics and conventional care for musculoskeletal disorders: State sequence analyses of 4-year claims data
Supplemental material, sj-docx-1-dhj-10.1177_20552076251378626 for Care pathways combining digital therapeutics and conventional care for musculoskeletal disorders: State sequence analyses of 4-year claims data by Silke Frey, Annika Schmitz, Udo Schneider, Linda Kerkemeyer and Birgitta Weltermann in DIGITAL HEALTH
Footnotes
Acknowledgements
We want to thank Techniker Krankenkasse (TK) for providing the data and Wissenschaftliches Institut der AOK (WIdO) for allowing us to use their medication database. We would also like to thank Zentralinstitut für die kassenärztliche Versorgung (Zi) for funding this study. This publication was supported by the Open Access Publication Fund of the University of Bonn.
Ethical considerations
The Ethics Committee of the Medical Faculty at the University of Bonn has reviewed the study proposal and raised no ethical or legal concerns (054/23-EP). The University Hospital Bonn (UKB) data protection officer actively contributed to the data protection concept and provided a positive assessment of the project. Individual informed consent for data usage was not required, and no experiments or surveys were conducted to gather the data.
Contributorship
SF, US, LK and BW contributed to conceptualization. SF, AS and US contributed to data curation. SF, AS and US contributed to formal analysis. SF, US, LK and BW contributed to funding acquisition. SF, AS and US contributed to investigation. SF, AS, US, LK and BW contributed to methodology. SF, AS and BW contributed to project administration. US and BW contributed to resources. SF and AS contributed to software. US, LK and BW contributed to supervision. SF, AS, LK and BW contributed to validation. SF and AS contributed to visualization. SF contributed to writing–original draft preparation. AS, US, LK and BW contributed to writing–review and editing.
Funding
The authors disclosed receipt of the following financial support for the research, authorship, and/or publication of this article: The study was funded by Zentralinstitut für die kassenärztliche Versorgung (Zi). The funder had no role in the study design, data transfer, data analysis, data interpretation, manuscript writing, or decision to submit for publication. This work was supported by the Open Access Publication Fund of the University of Bonn.
Declaration of Conflicting Interests
The authors declared no potential conflicts of interest with respect to the research, authorship, and/or publication of this article.
Data availability
The data underlying this study belongs to the Techniker Krankenkasse (TK). In accordance with German data protection regulations, access to the data is granted only to employees of the University Hospital Bonn (UKB) within the context of this approved research project DiGAmove. The claims data supporting this study's findings are not publicly accessible due to the protection of data privacy. Access to the data can be obtained from the authors upon reasonable request and with permission from the TK. The data protection concept of DiGAmove must be adhered to. For inquiries related to the data used in this study, please contact the corresponding author SF (silke.frey@ukbonn.de).
Supplemental materials
Supplemental material for this article is available online.
References
Supplementary Material
Please find the following supplemental material available below.
For Open Access articles published under a Creative Commons License, all supplemental material carries the same license as the article it is associated with.
For non-Open Access articles published, all supplemental material carries a non-exclusive license, and permission requests for re-use of supplemental material or any part of supplemental material shall be sent directly to the copyright owner as specified in the copyright notice associated with the article.