
Abstract
Background
Epilepsy is a prevalent chronic neurological disease with significant impacts. Traditional diagnostic methods and machine learning face challenges due to the complexity of electroencephalography (EEG). Deep learning (DL) shows potential in epilepsy management through EEG processing and brain imaging analysis. This study aims to fill the gap of missing bibliometric analysis in this field by conducting a visual bibliometric analysis of DL applications in epilepsy, revealing research trends, hotspots, and cutting-edge developments to guide future research directions.
Methods
In this study, a comprehensive search of original research articles and reviews, limited to English-language, published from 2006 to 2025, was conducted by the Web of Science Core Collection database. Bibliometric analyses and visualizations were conducted by CiteSpace, VOSviewer, and Bibliometrix.
Results
This search retrieved 1266 papers related to DL applied in epilepsy from the Web of Science Core Collection database, showing a consistent upward trend. These papers were from 1957 organizations across 290 countries/regions, primarily from China and the United States. “Biomedical Signal Processing and Control” ranked as the journal with the most published papers. Acharya, U. Rajendra from Ngee Ann Polytechnic, was the most authoritative author. DL-based seizure detection, prediction, and epilepsy management are key research hotspots. Moreover, multimodal data integration approaches are gaining more attention.
Conclusions
This study innovatively employs bibliometric methods to visually analyze research on DL applications in epilepsy, which reveals a rising trend in research within the field and identifies key hotspots, such as DL in seizure detection and prediction. The potential of DL to enhance epilepsy management is highlighted, particularly in improving the accuracy of seizure detection and prediction, thereby enhancing patients’ quality of life. Furthermore, the findings highlight the importance of increasing seizure prediction accuracy, exploring multimodal data integration, and developing more interpretable DL models for future research.
Keywords
Introduction
Epilepsy, a prevalent neurological disease marked by high incidence and disability rates, seriously impacts patients’ health and quality of life. 1 The sudden seizures commonly associated with epilepsy can lead to physical injuries, while the unpredictability of the condition might result in psychological issues such as anxiety and depression. 2 Moreover, epilepsy can impose restrictions on patients’ daily activities like driving and swimming, underscoring the need for timely and effective treatment and management.3,4
Traditional methods for diagnosing epilepsy have faced several difficulties, such as the profound complexity of electroencephalography (EEG) and the subjectivity of doctors’ visual interpretations, which can pose challenges to accurate diagnosis in some cases. 5 While traditional machine learning (ML) has been used in epilepsy research, it also has some challenges. For instance, traditional ML often requires extensive manual feature engineering, which is time-consuming and perhaps leads to feature extraction errors because of the complexity of EEG and the presence of noise and artifacts. 6 Additionally, traditional ML models can be prone to overfitting, especially when trained on small datasets, making them less effective in real-time applications. 7 Furthermore, the effectiveness of traditional ML models heavily relies on the quality and quantity of labeled data, which could be challenging to obtain in clinical settings due to the variability of EEG patterns across patients and even within the same patient over time. 8 These challenges have highlighted the necessity and importance of applying deep learning (DL) technology in the field of epilepsy.
Since its inception in 2006, DL has accomplished outstanding results in domains like image recognition and natural language processing. With the advent of the big data era, its applications in the medical field, particularly in epilepsy detection, prediction, and diagnosis, have become increasingly widespread, demonstrating great potential.9,10 In 2018, DL achieved remarkable progress in the field of epilepsy. For instance, Ullah et al. developed a one-dimensional deep convolutional neural network (CNN) model, achieving 99.1% accuracy for EEG-based epilepsy detection. 11 Achary et al. demonstrated that a 13-layer deep CNN algorithm was used to detect normal, preictal, and seizure classes, achieving 88.67% accuracy, 90.00% specificity, and 95.00% sensitivity. 12 Siouris et al. showed that a two-layer long short-term memory (LSTM) network combined with a CNN achieved EEG-based epilepsy prediction, successfully forecasting all 185 seizures with a false rate of 0.02–0.11/hr over 15-min to 2-h windows. 13 Zhou et al. released a CNN-based epilepsy detection method using frequency-domain signals, which showed higher accuracy than time-domain signals in the Freiburg and CHB-MIT databases, indicating its suitability for CNN applications. 14 Khan et al. demonstrated that using CNNs and wavelet transformation of EEG signals achieved a 10-min seizure prediction horizon with 87.8% sensitivity and a false alarm rate of 0.142 per hour on the test set. 15 These research achievements laid the foundation for the application of DL in epilepsy. In 2019, Daoud et al. proposed a DL-based epilepsy prediction method using CNNs and recurrent neural networks (RNNs) that achieved 99.6% accuracy, 0.004 false alarms per hour, and a 1-h early seizure warning, making it suitable for wearable devices. 16 Meanwhile, Abbasi et al. argued for the urgent need for interpretable models in DL-based epilepsy seizure detection. 17
Since then, DL has been increasingly applied, particularly in epilepsy research, where in the realm of EEG processing, techniques such as CNNs, RNNs, and their variants have been utilized extensively for seizure detection and prediction. 18 These methods can leverage the spatial-temporal characteristics of EEG to enhance the accuracy of seizure identification. For example, studies have demonstrated that hybrid models combining CNNs and RNNs are effective in detecting spatial-temporal patterns in EEG, leading to more reliable predictions.19–21 Meanwhile, in brain imaging analysis, DL has been employed to diagnose and classify epilepsy using structural and functional magnetic resonance imaging (fMRI) data. Models like 3D-CNN have been used to extract features from these imaging modalities, aiding in distinguishing epileptic patients from healthy individuals. 22 Furthermore, research has also shown that integrating multimodal imaging data can further improve diagnostic accuracy. 23 These advancements underline the potential of DL for improving epileptic diagnosis. With ongoing technological progress and increased data availability, DL is expected to play an even more crucial role in the future.
This study aims, through a bibliometric analysis spanning 2006–2025, to systematically synthesize the DL literature on epilepsy, precisely identify core hotspots, trace emerging frontiers, and forecast evolving trends, thereby furnishing an evidence-based roadmap for future research and clinical translation.
Materials and methods
Data sources
This data for the bibliometric analysis was derived from the Web of Science Core Collection database (WoSCC), a widely utilized standardized database in bibliometrics. 24 In WoSCC, “TS” denotes “Topic Sentence.” For this study, the search criteria were defined as TS = (“deep learning”) and TS = (“epilep*” or “seizure*”). The search spanned from January 1, 2006, to April 24, 2025. Only articles and review articles in English were included. Using these criteria, the results were compiled into plain text files in TXT and CSV formats for WoSCC searching. The study was concluded on April 24, 2025, to avert data distortion from subsequent database renewals.
Eligibility criteria
This study employed particular inclusion and exclusion standards, with the inclusion standards centering on studies investigating the use of DL in epilepsy, limited to English-language original research articles and reviews, while the exclusion standards comprised Early Access, Meeting Abstract, Editorial Material, Proceeding Paper, Book Chapters, Letter, and Retracted Publication. Discrepancies were resolved through discussion, with adjudication by a third scholar if necessary; if consensus remained unattainable, a senior neurologist would make the final decision. 25
Data analysis and visualization
CiteSpace, a tool favored in the field of bibliometric analysis, excels at accurately identifying trends in scientific literature as well as key nodes and intuitively presenting them, helping researchers uncover emerging trends and influential studies. 26 In this study, CiteSpace 6.4.R6 was used with VOSviewer, a tool strong in bibliometric network graph analysis. VOSviewer visualizes co-authorship, co-citation, and keyword networks, helping identify key research domains, authors, and institutions in epilepsy studies. The CiteSpace 6.4.R6 analytical framework, including journals, keyword bursts, and reference clustering, was analyzed via automatic clustering and advanced visualization methods, with suitable tags applied to distinguish clusters. 27
R software (version 4.4.2), with the Bibliometrix R package and Biblioshiny tool, was used to visualize literature references, keywords, and publication/citation trends. 28 Bibliometrics aids in data comparison, trend analysis, and thematic exploration. All data came from the Web of Science public databases, so no ethical evaluation was needed.
This study integrates three analytical tools-CiteSpace, VOSviewer, and bibliometrix-organically to focus on revealing the hotspots and frontiers of DL applied to epilepsy through visualization. The analysis is primarily conducted from the following aspects: Citation Trends, Distributions of Countries/Regions, Distributions of Authors, and Keyword Analysis.
Result
Global overview
Based on the flowchart of the search strategy (Figure 1(a)), a systematic search of WoSCC (2006–2025) yielded 1266 records for screening, comprising 1132 original articles and 134 reviews. The average citation per article was 21.85. As a novel research field, 124 of these articles garnered over 50 citations. In total, 5958 authors from 290 regions and countries, and 4561 institutions, published related literature on DL applications in epilepsy across 425 global journals.

(a) The flowchart of the search strategy of DL applied in epilepsy from WoSCC. (b) Annual trends in article publication volume and citation frequency.
Annual publications and citation trends
Figure 1(b) illustrates the yearly output count and citation rate of related articles spanning the past 20 years from 2006 to 2025. The yearly output count, which began with two articles in 2006, has undergone fluctuations over the years. After reaching a milestone of 36 articles in 2018, there was a rapid surge in publications, peaking at 243 articles in 2023. However, the growth rate of publications began to moderate in 2023, with the number of articles slowly rising to 275 in 2024. From the overall trend of annual article production, the number of articles published annually has shown a steady increase. Between 2018 and 2023, the upward trend was characterized by rapid growth. Although the rate of increase in publications began to moderate in 2023, the number of articles continued to increase substantially. The highest publication count within the observed period was recorded in 2024.
In contrast, the mean citation rate per article, starting at 38 in 2006, saw a significant peak of 194.5 in 2007. Since then, it has followed a downward spiral trend, with fluctuations but an overall decrease. It fell to 9.72 in 2023 and further dropped to 0.29 in 2025. These trends collectively suggest that research activity in the field has intensified, marked by an increasing number of publications as more scholars join and academic exchanges grow more frequent, while the rising volume of articles might be contributing to a dilution in the average citation impact of individual articles.
Distributions of countries/regions
The study of DL applications in epilepsy spans 290 countries and regions. As per Table 1, the top 10 countries account for 74% of the total publications in the field. China tops the list with 331 publications, the highest citation count (5330), and the most multinational copublications (63). The United States and India follow with 204 and 154 publications, respectively. Despite China's lead in publication volume, the United States has a higher citation frequency (9478 vs 5330), indicating differing academic influences.
Top 10 productive countries regarding study on DL applications in epilepsy.

SCP: single country publications; MCP: multiple country publications.
In terms of collaborative outcomes, the United Kingdom (62.1%) and Australia (55.4%) have a higher proportion of multiple-country publications (MCP%) compared to China (19%) and India (18.2%) (Table 1 and Figure 2). The United Kingdom shows a more significant presence in multicountry publications, while China has a higher proportion of single-country publications.
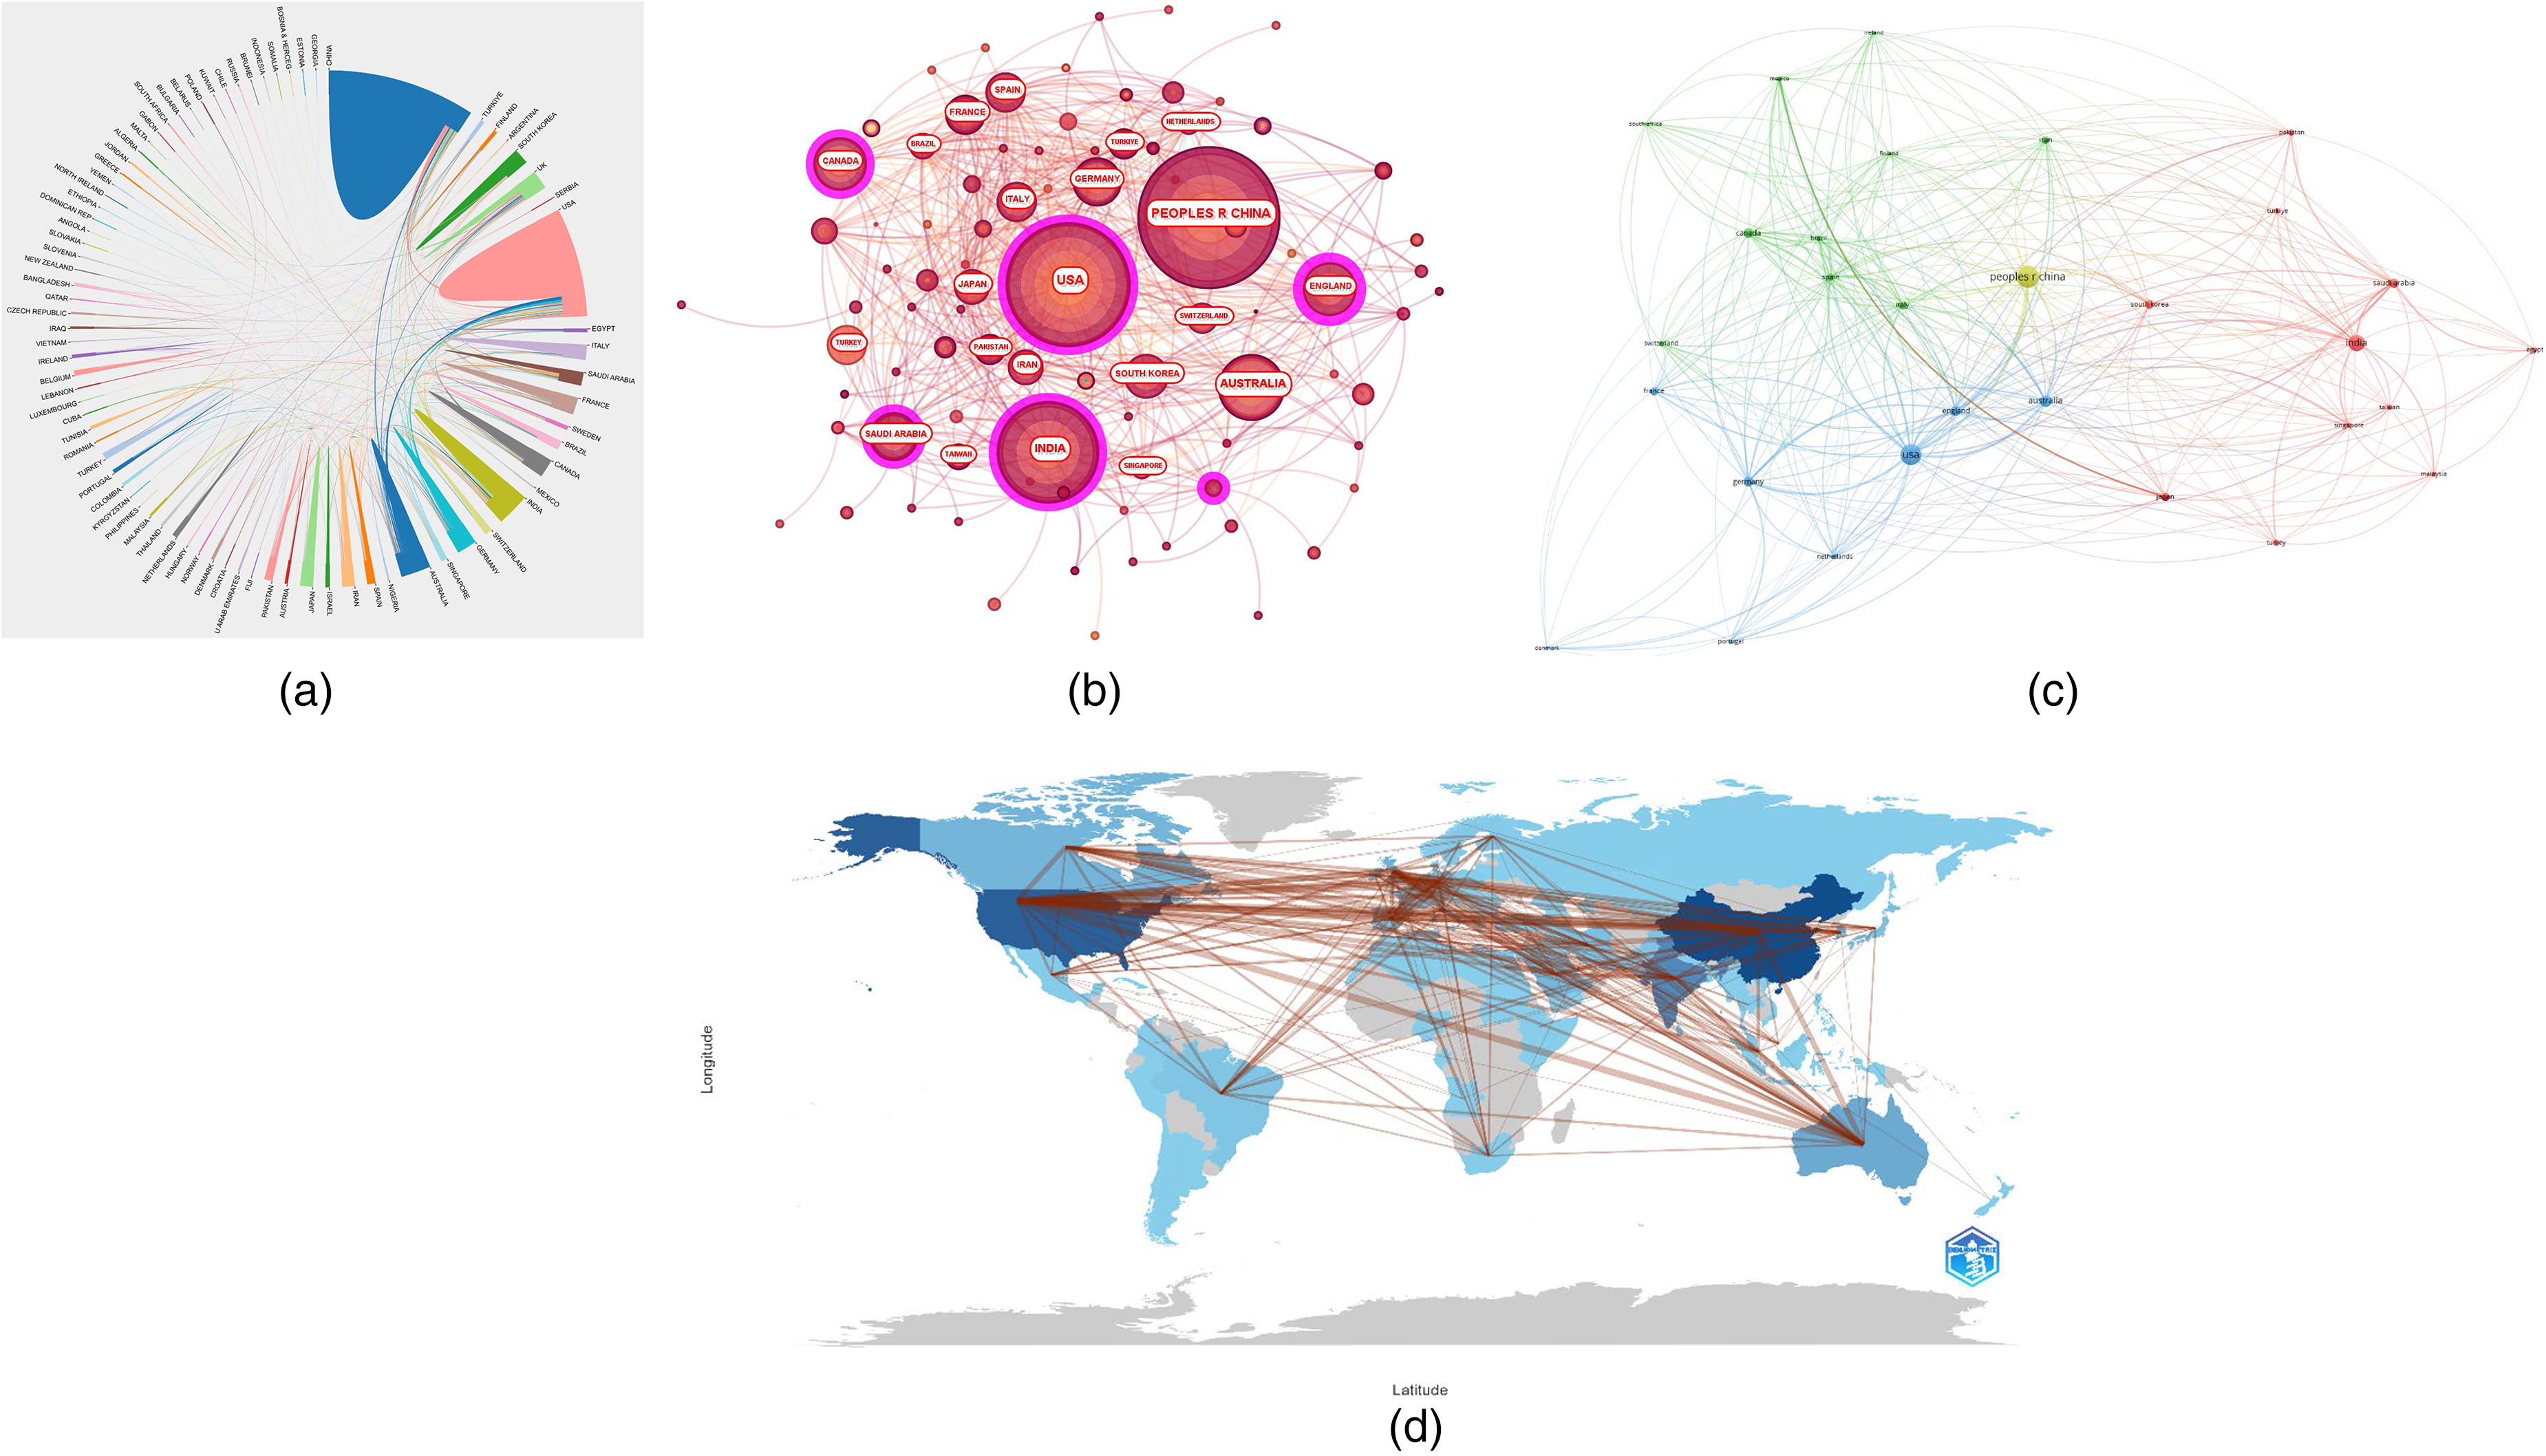
DL and epilepsy-related countries/regions analysis. (a) Chord plot of country/region cooperation. (b) Global collaboration network on DL in epilepsy research. Note: (i). Citation tree-rings represent the temporal distribution of citations received by documents over time. (ii). Each ring corresponds to a specific year, with the thickness of the ring indicating the number of citations received in that year. (c) Visualization of the cooperation network among countries/regions. (d) Country collaboration map. DL: deep learning.
As Figure 2(a) shows, the global cooperation network is complex and uneven, consisting of an inner ring, an outer ring, and connecting lines. The inner ring denotes major cooperative entities, while the outer ring lists countries/regions in different colors. Connecting lines, color-matched to the inner ring and varying in thickness to indicate cooperation intensity, show that NATO cooperates closely with the United States and the United Kingdom, the United States is linked to many countries, and Japan, South Korea, and the Chinese are active in cooperation. In Africa, most cooperative ties are with European countries, reflecting the varying scales, depths, and distributions of international cooperation.
In Figure 2(b), nodes are depicted with citation tree rings, where thicker rings indicate higher citation counts, reflecting greater document influence during that period, and thinner rings signify fewer citations, suggesting lower influence. As Figure 2(b) presents, China, the United States, and India are represented by the largest dots, indicating their central positions in the field. The complex lines surrounding these countries illustrate their extensive collaborative networks in based-DL epilepsy research. China, the United States, and India, represented by the largest dots, are the top three in paper output. In terms of collaboration with other countries, the United States has a higher level than China and India.
Figure 2(c) illustrates the global cooperation network in DL-based epilepsy research. China, marked as “people's China,” is a key player with dense links to India, the United States, and Russia, indicating broad-ranging collaboration. The United States has close ties with Germany, the United Kingdom, and Australia, reflecting its strong cooperative network. Links between Russia and India show emerging economies’ collaboration. Meanwhile, the few links between the Netherlands and Singapore imply limited external cooperation. Overall, the figure reveals a complex pattern of global collaboration in the field, highlighting countries’ interactions and joint efforts.
As shown in Figure 2(d), the “Country Collaboration Map” presents the global cooperation activity distribution. The United States and China, with numerous connection lines, are at the core of the cooperation network and engage closely with many countries. There is extensive cooperation among European countries and between Europe and other regions. In contrast, some African and South American countries have fewer connection lines, indicating relatively limited cooperation in scale and scope. In general, the map reflects the diverse and complex nature of global cooperation.
Table 1 quantifies the distribution of the top 10 countries/regions in terms of publications in the field through specific indicators, and Figure 2 further visualizes the distribution of publications across countries/regions from a different perspective. Such information helps scholars understand the distribution of key countries/regions in the research area.
Distribution by institutions
Research on the use of DL in epilepsy involves a wide array of institutions. The following is a detailed analysis of the distribution and collaboration patterns of these institutions, along with key findings from network visualizations. Currently, a sum of 2050 institutions are engaged in research on the use of DL in epilepsy. These institutions are spread across 290 countries and regions, with the United States and China being the most prolific contributors. Among these institutions, the top 10 ranked by publication output are particularly remarkable.
Table 2 presents these leading institutions ranked by the quantity of publications. Each paper is assigned to only one category according to the first-listed affiliation string. Harvard University tops the list with 46 publications, followed closely by Harvard University Medical Affiliates with 42 publications. Among these top 10 institutions, five are in the United States, three in China, and one each in France and the United Kingdom. The distribution highlights the significant contributions of these countries to the field of DL in epilepsy.
Top 10 institutions by article output and corresponding centrality metrics.

Note: i. “Harvard University”—records that list “Harvard University” only, without any medical-school or hospital designation.
ii. “Harvard University Medical Affiliates”—records that name any Harvard-affiliated teaching hospital or clinical center.
iii. “Harvard Medical School”—records that explicitly contain the phrase “Harvard Medical School.”
In the academic cooperation network, an institution's centrality is a crucial metric. The University of California System stands out with a centrality of 0.26. The high centrality indicates that the University of California System plays a pivotal role in connecting different parts of the research community and facilitating the flow of information and knowledge. Other institutions such as the Chinese Academy of Sciences, University of London, and Capital Medical University also exhibit relatively high centrality (0.09, 0.09, and 0.07 respectively). Their high centrality values reflect their active participation in global academic exchanges and collaborations, making them key players in spreading research results and developing the area.
Figure 3(a) visualizes the collaboration and citation networks among institutions in DL epilepsy research. Node size reflects centrality, with larger nodes like Harvard University (centrality 0.06) indicating greater influence. Line thickness shows collaboration strength or citation frequency, as seen in the link between Harvard and the University of California System. This helps identify key institutions and their connections, aiding researchers in finding collaboration partners and understanding information flow in the field. By analyzing these networks, researchers can identify potential partners for collaboration and better understand the flow of information and innovation within the field. 29

Visualization of distribution by institutions. (a) Visualization of institutional collaboration and citation networks. (b) Bibliographic coupling network of institutions.
Figure 3(b) presents the bibliographic coupling network of institutions, where institutions are interconnected based on the similarity of their reference lists. For instance, the Chinese Academy of Sciences and Capital Medical University are closely linked in this network due to their shared research interests in epilepsy neuroimaging and their frequent citation of common literature in the area. The close coupling indicates that they share a common intellectual foundation and research focus. The network highlights clusters of institutions that are closely related in terms of research focus and academic output. One such cluster includes the University of London and Zhejiang University. These institutions have published numerous papers on seizure detection and prediction through DL techniques and frequently cite each other's work. By examining the density and structure of the coupling network, we can uncover the collaborative landscape and thematic groupings within the field of DL applications for epilepsy. The analysis can help researchers identify which institutions are leading specific research directions and how knowledge is being built upon and advanced within the research community.
The analysis of research institutions seeks to grasp the global distribution of DL-related epilepsy research and to facilitate collaboration opportunities. By identifying key institutions and their collaborative patterns, researchers can better navigate the research landscape, find potential partners, and contribute to the collective advancement of knowledge in the critical area of neurological research.
Distribution of authors
In this section, the author statistics are based on the search results from WoSCC (search query TS = (“deep learning”) and TS = (“epilep*” or “seizure*”)), with a total of 1266 documents and 5666 authors. The top 10 authors in terms of citation counts and number of papers are shown in Table 3, while the highly influential papers by individual authors are shown in Table 4, where they are described in detail. As indicated in Table 3, among the top 10 authors, Chinese authors make up the majority and have a high total output of papers. However, in terms of impact factor (IF), the average impact IF factor of Chinese authors (mean IF = 204.75) is significantly lower than that of the top four authors (mean IF = 619). It might be because Chinese authors have not taken a leading role in the research direction of the field, or their research direction is not currently a hot spot. Moreover, Acharya, U.R.'s h-index is significantly higher than those of other authors, and he published a paper titled “Deep Convolutional Neural Network for the Automated Detection and Diagnosis of Seizure Using EEG Signals” in 2018, which laid the foundation for the application of deep learning in epilepsy. 12
Top 10 authors’ statistics for “citations” and “documents.”

Note: i. Rankings are listed separately based on the number of documents and the number of citations.
ii. Citations: total Web of Science citations received by all papers authored by the researcher
iii. Documents: number of papers authored by the researcher.
Top 10 highly cited references.

Note: CNN: convolutional neural network; RNN: recurrent neural network; DL: deep learning; EEG: electroencephalography; LSTM: long short-term memory.
Figure 4(a) presents the author collaboration network within the research field. Authors positioned at the core of the network, such as “Acharya, U.R.,” “Fookes, C.,” and “Chen, X.,” demonstrate significant influence in the field, having established collaborative relationships with numerous other authors.30,31 Analyzing these networks helps to uncover the main research forces and patterns of collaboration within the field, offering insights into the development trends and directions of the research area. The visualization provides a clear depiction of the collaborations among authors and their standing within the research field, offering crucial information for understanding research dynamics.

Visualization of distribution by authors. (a) Visualization of authors’ collaboration network. Note: (i). The size of the nodes reflects the influence or importance of the authors. (ii). The color coding differentiates various research directions, with each color representing a specific research topic. (b) Timeline of authors’ collaboration network clustering analysis.
Figure 4(b) presents a timeline of the clustering analysis of the author collaboration network, offering insights into the formation and development of different author collaboration groups over time. The timeline spans from 2006 to 2025, showing how collaborations have evolved across various research domains. The visualization highlights key authors like “Acharya, U.R.,” and “Andrzejak, R.G.” as central figures in the network. 32 Different colored clusters represent distinct research fields, such as “Clinical Neurology” and “Neuroimaging” with the density and connections of nodes indicating the growth and interaction of these groups over the years. The timeline helps identify emerging trends and persistent collaborations within the research community.
Distribution of journals
In our assessment of DL applications in epilepsy research, we identified high-output, high-impact journals by a bibliometrics online analysis platform. The IF and journal citation report (JCR) quartiles are key indicators of a journal's influence. JCR partitioning ranks journals within a discipline by their prior-year IF, dividing them equally into four quartiles: Q1 (top 25%), Q2 (25%–50%), Q3 (50%–75%), and Q4 (bottom 25%). Over the past 20 years, there are 425 journals that have published related articles on this research topic. Among these, the top 10 journals each published at least 22 articles, and all were from the United States, the United Kingdom, the Netherlands, and Switzerland, as shown in Table 5. Notably, the journals with the highest representation are “Epilepsia,” “IEEE Journal of Biomedical and Health Informatics,” and “IEEE Transactions on Neural Systems and Rehabilitation Engineering,” with 27, 25, and 30 articles published, respectively. Among the top 10 journals, six are in Q1, three in Q2, and one in Q3. Five Q1 journals and one Q3 journal are from the USA, two Q2 journals are from Switzerland, one Q1 journal is from England, and one Q2 journal is from the Netherlands.
Top 10 journals with the most publications, along with their IF and JCR quartile.

Note: Impact factors and JCR quartiles reported in Table 5 were taken from the 2024 JCR release.
Figure 5 consists of four charts illustrating journal distribution. Figure 5(a) depicts Bradford's Law, showing that a minority of core journals publish a large number of articles on specific topics, while most journals only publish a few related articles. For instance, in computer science, a few journals like IEEE Transactions on Neural Networks and Neurocomputing publish many related articles. A dual-overlay journal graph refers to the dual-map overlay method proposed by Chen and Leydesdorff in 2014, which involves superimposing the journal cocitation network, including both citing and cited journals, onto two base maps, typically with citing journals on the left and cited journals on the right. 33 Figure 5(b), a dual overlay journal graph, reveals journal distribution across disciplines. In brain-science research, journals in neuroscience, engineering, and computer science intersect. Figure 5(c), a journal visualization network, displays connections between journals via nodes and links. Journal of Neural Engineering and IEEE Transactions on Biomedical Engineering are closely connected through citations. Figure 5(d), a journal co-occurrence visualization network, shows relationships via color and density. In biomedical research, NeuroImage and Epilepsia are often cited together in brain-disease studies. Overall, these charts analyze journal distribution from different angles, uncovering concentration, cross-disciplinary links, and co-occurrence patterns in academic journals.

The analysis of journals. (a) The plot of Broadford's law. (b) Dual graph overlay of journals. Note: Citing journals on the left and cited journals on the right. (c) Journal visualization network diagram. (d) The journals’ collaboration and citation network diagram.
Keyword analysis
The keyword analysis delves into research hots and trends in DL applications for epilepsy. As an overview of the core content of the study, keywords are utilized to analyze the research frontiers of DL and related technologies in epilepsy.
Table 6 presents the top 10 keywords ordered by frequency of occurrence. “Deep learning” ranked first with 515 occurrences and a total link strength of 3016, followed by “epilepsy” with 458 occurrences and a total link strength of 2764. “EEG” (315 occurrences, total link strength 1890) and “classification” (310 occurrences, total link strength 2125) also featured prominently, alongside “machine learning” (178 occurrences, total link strength 1177). Notably, “electroencephalography” (129 occurrences, total link strength 1052) is the full term for “EEG,” and its considerable frequency further underscores the importance of EEG-related research in this domain. These high-frequency keywords indicate that their corresponding fields are very trendy in the research context.
Top 10 keywords based on frequency of occurrence and associated total link strength.

Figure 6(a) illustrates a keyword co-occurrence network, with nodes symbolizing keywords and edges indicating their co-occurrence relationships. Prominent clusters include “seizure detection,” “seizure prediction,” “deep learning,” and “machine learning,” highlighting these as focal research areas. For example, “seizure detection” is closely linked with “EEG signal processing,” indicating a strong research focus on developing accurate detection algorithms using EEG data.

The analysis of keywords. (a) Keyword co-occurrence network. (b) Keyword cluster timeline view. (c) Keywords burst analysis. Note: (i). Burst strength = number of citations in peak year/average number of citations per year. (ii). The red bars indicate the years with the highest burst strength, while the blue bars indicate lower burst strength.
Figure 6(b) offers a timeline view of keyword clustering, illustrating how research themes have evolved over time. Early research concentrated on foundational aspects like “signal processing” and “neural networks.” Over time, the focus has shifted toward more specialized areas such as “CNNs” and “RNNs” for seizure prediction and detection. The temporal analysis reveals a growing interest in leveraging advanced DL techniques to enhance epilepsy diagnosis and management.
Figure 6(c) focuses on keyword burst analysis, which identifies periods of rapid growth in keyword usage. For instance, keywords like “neural networks” experienced significant bursts from 2018 to 2019, reflecting a surge in research interest in applying these advanced techniques to epilepsy during that period. Similarly, “dynamics” saw a burst from 2015 to 2020, highlighting growing attention to the dynamic aspects of epilepsy. In recent years, terms such as “explainable artificial intelligence” (from 2024 to 2025) and “patterns” (from 2017 to 2023) have experienced a surge in popularity, which suggests that these terms are becoming new trends in improving the interpretability of AI models and analyzing complex data patterns to enhance diagnostic accuracy and treatment outcomes. The shift from focusing solely on traditional EEG analysis to incorporating a broader range of techniques and data types shows researchers are increasingly exploring more sophisticated and integrated approaches to advance epilepsy diagnosis and management.
Overall, the keyword analysis offers precious insights into the ever-changing research landscape of DL in epilepsy, identifying both enduring research hotspots and emerging trends that are likely to shape future studies.
Highly cited reference analysis
The analysis of highly cited references is pivotal for identifying key contributions in DL for epilepsy research. Table 4 lists the top 10 references, most of which center on using DL models such as CNNs, LSTMs, and their variants for epileptic seizure prediction or detection. Among them, Acharya et al.'s 2018 paper in Computers in Biology and Medicine stands out with 159 citations for its work on deep CNNs for seizure detection and diagnosis 12 ; other notable works, such as Truong et al.'s research on CNNs for seizure prediction (114 citations) and Daoud et al.'s study on efficient seizure prediction using DL (101 citations), also demonstrate the significant impact of these publications on advancing methodologies in the field.16,34 Moreover, Khan et al., 2018, IEEE TBME (82 citations), shows that that a shallow CNN using only 10-s EEG segments can localize focal-onset seizures, setting a precedent for the application of DL in aiding epilepsy treatment 15 ; Abbasi et al. (2019), Epilepsia (63 citations), highlighted the urgent need for explainable DL applications in seizure detection. 17 Those might become future research hotspots.
Figure 7(a) highlights the top 19 references with the most significant citation bursts, indicating periods of intense research interest and influence. For instance, the reference by Kuhlmann et al. on seizure prediction exhibits a strong citation burst around 2018, reflecting its crucial role in shaping new research directions. Additionally, the analysis reveals that studies published between 2017 and 2019 have had a particularly major impact on the field, with several references experiencing citation bursts during the period. Figure 7(a) shows that the burst of publications centers around 2018, which provides strong evidence for Table 4.

Exploration of references regarding DL in epilepsy applications. (a) Top 19 references the most notable citation surges. (b) Cluster dependency analysis of references.
In Figure 7(b), there is a cluster dependency analysis displayed of references linked with the application of DL in epilepsy research. The visualization uses color-coded nodes to represent different clusters, with node size indicating the rate of occurrence and the lines showing connections and dependencies between clusters. Larger nodes like “EEG classification” and “deep learning” are central and connected to many other nodes, highlighting their importance in the field. The network shows how various research topics related to DL in epilepsy are interconnected. Some clusters focus on specific applications such as “automatic detection” and “epileptic seizure,” while others like “neuromodulation” and “individualized smart neuro modulation therapy” explore treatment aspects. The analysis helps to identify key research areas and their interdependencies in the application of DL to epilepsy.
Overall, the analysis of highly cited references, citation bursts, and cluster dependencies provides a comprehensive view of the intellectual framework of the field. It highlights the most influential works driving scientific progress in epilepsy research and helps map the dynamic landscape of research trends and collaborations.
Discussion
General distribution
Using CiteSpace, VOSviewer, and Bibliometrix R software, we carried out a penetrating analysis of the literature in the field of DL applications for epilepsy research. The analysis integrated data on country/region, institution, author, keyword, and references. The achievements of DL in epilepsy research partly owe to the heightened accuracy and advanced nature of algorithms in managing complex datasets, which mirror broader trends in DL advancement. As shown in Figure 1(a), the steady rise in article volume indicates increasing attention to the field. However, the downward trend in the mean IF factor might be owing to the rising number of individual articles being published. Specifically, the gradual diversification of research directions within the field of DL applications for epilepsy has contributed to the dilution of the average IF. As shown in Table 1, China has a much higher volume of papers than the United States, which ranks second, but its IF is lower than that of the United States. Figure 2, which visualizes international collaboration and exchange, shows that China lags behind the United Kingdom and Australia. This might be due to China's rapid expansion of research areas over the past few years, but there is still a long way to go to lead the development of the field. China needs to enhance the depth of research and strengthen international cooperation and exchange.
As shown in Table 2, the U.S. accounts for 56.8% of the total paper output from the top 10 institutions globally, with an average centrality of 0.082, demonstrating a dual superiority in research scale and network influence. For example, the University of California System has a centrality of 0.26, indicating broad coverage and strong hub connectivity. China ranks second with 26.5% of the paper output. However, its average centrality of 0.057 only slightly exceeds France's 0.050, revealing an imbalance of high output but low collaboration. Although the Chinese Academy of Sciences (centrality 0.09) matches the University of London (centrality 0.09), other Chinese institutions like Zhejiang University (centrality 0.01) significantly reduce the overall collaborative performance. The United States should maintain its multinode, high-impact collaborative network model. China, leveraging the bibliographic coupling network in Figure 3, should strategically collaborate with high-centrality institutions such as the University of California System and the University of London. Prioritizing data-sharing platforms and joint laboratories can help transform China's paper output advantage into a global collaborative influence.
As indicated in Table 3, among the top 10 authors evaluated by multiple factors, Chinese authors make up the majority and have a high total output of papers, with high-output Chinese authors such as Chen, X. serving as exemplars. 31 However, in terms of IF, the average IF of Chinese authors is significantly lower than that of the top four authors, represented by high-impact researchers such as Acharya, U. R. and Fookes, C.12,30 It might be because Chinese authors have not taken a leading role in the research direction of the field, or their research direction is not currently a hot spot. Figure 4(a) shows the current author collaboration network, and Figure 4(b) analyzes the clustering of the collaboration network over time. These help authors with low-IFs identify hot research directions and potential collaborators suitable for them, thereby strengthening cooperation and communication and enhancing research influence.
Our analysis also reveals that DL applications in epilepsy research are concentrated in a few high-impact journals. As shown in Figure 5(a) and Table 5, journals like “Biomedical Signal Processing and Control,” “IEEE Access,” and “Journal of Neural Engineering” publish many related articles and serve as key platforms for sharing findings. Figure 5(b) and (c) highlight cross-disciplinary collaboration, with journals from neuroscience, engineering, and computer science citing each other. For example, “Journal of Neural Engineering” and “IEEE Transactions on Neural Systems and Rehabilitation Engineering” have strong citation links. The collaboration drives the development of better DL-based epilepsy solutions.
As shown in Table 6, “machine learning” ranks fifth with 178 occurrences and a sum link strength of 1177, indicating its notable position among high-frequency keywords. Traditional ML has played a significant role in early epilepsy applications. Notably, “deep learning,” which tops the list, is a subset of ML and represents its more advanced stage.
Finally, as per Table 4, the 10 most impactful papers in the field were all published between 2018 and 2019, indicating that the period was the most active and popular for research in the area. Figure 7(a), which indicates the top 19 references with the most powerful citation bursts, further confirms it. The top 10 high-impact papers, related to the directions mentioned in Figure 7(b), cluster dependencies, have been guiding the field's development.
Hotspots and frontiers
As shown in Figures 2 and 3, international cooperation in the field is vibrant. Research institutions in developed nations like the United States, the United Kingdom, Japan, and Germany, and emerging economies like China, are pivotal in the global research network. Cross-continental collaboration is evident, with close ties within Europe, frequent Europe–North America exchanges, and strengthened China–Japan–South Korea cooperation in Asia. China also links with North America and Oceania. U.S. universities such as Harvard and the University of California have numerous global connections and collaborative projects, leading in international research cooperation, and there is significant cooperation between the United Kingdom and the United States, as well as between Canada and Australia.
Geographically, research is dominated by developed countries with dense top-tier institutions. However, emerging economies like China and India are rising rapidly in new research directions and international collaboration. Despite an uneven distribution of research power, academic exchanges are active. Europe, the United States, and Asia witness frequent personnel exchanges through visiting scholars and joint training. Developing countries like Brazil and South Africa are boosting research investment and collaborating with developed nations, illustrating the broad nature of global research.
The keywords in Figure 6(a) cover a broad spectrum of epilepsy research topics. In epilepsy monitoring and diagnosis, terms like “electroencephalography (EEG),” “EEG seizures,” “seizure detection,” “spike detection,” and “classification” indicate a focus on precise diagnosis using EEG technology and classification algorithms. In the treatment and intervention sphere, keywords such as “epilepsy surgery,” “deep brain stimulation,” “electrical stimulation,” and “hippocampus” highlight research into various therapies and key brain regions. Technologically, “deep learning,” “convolutional neural network,” “machine learning,” and “neural networks” underscore the importance of these advanced methods in processing epilepsy data. Data processing techniques like “signal processing,” “feature extraction,” and “wavelet transform” are also highlighted. 35 The trend toward “multimodal data integration” and “data fusion” is evident, alongside research into seizure prediction. Multimodal data integration indicates that data fusion methods are highly valued. Integrating EEG, magnetoencephalography (MEG), and other data with fMRI can offer more comprehensive and accurate information for epilepsy research. 36 Overall, these research themes are driving improvements in epilepsy diagnosis, treatment, and patient quality of life.
As shown by Figure 6(b), DL has become a key focus in epilepsy research, showing a trend toward diverse models. Deep neural networks lead the way in seizure prediction by mining EEG data features. CNNs enhance the accuracy of EEG/MEG signal classification and localization of epileptic foci due to their adeptness in spatial data processing.37,38 Graph neural networks (GNNs) offer a fresh perspective on epilepsy mechanism research by analyzing brain network connections. 39 Algorithm innovation focuses on multimodal fusion (EEG/fMRI/MEG), feature extraction (wavelet transform combined with DL), and predictive model optimization (such as LSTM and hybrid models), which have significantly improved diagnostic and predictive performance.36,40
As shown in Figure 6(c), keyword burst analysis, “seizure” has seen a citation burst of 4.73 since 2023, indicating rapid progress in seizure detection and prediction, with emerging algorithms and models poised to transform into real-time monitoring and early-warning systems for seizure prevention. “Explainable artificial intelligence” has had a citation burst of 3.09 since 2024, suggesting that future research will focus more on model interpretability to meet clinical decision-making needs and promote the broader application of AI in epilepsy diagnosis and treatment.
The keyword co-occurrence network in Figure 6(a) suggests significant challenges in data integration and feature extraction for epilepsy research. Keywords such as “signal processing,” “feature extraction,” and “wavelet transform” indicate that researchers may benefit from more effective methods to integrate diverse data sources (like EEG, MEG, and fMRI) and extract valuable features. For example, in studies on seizure prediction, it can be a challenge to extract characteristics that might accurately indicate impending seizures from extensive EEG data. 41 Additionally, keywords like “model,” “network,” and “connectivity” point to the issue of potentially insufficient model interpretability, which could restrict the clinical application of AI models. Doctors need to comprehend a model's decision-making process to develop trust and effectively utilize it. 42 To address these challenges, future research ought to center on strengthening the integration of AI and medicine. This could be accomplished through collaborative research projects and the creation of interdisciplinary research centers to train professionals who are well-versed in both medicine and AI. 43 It may also be crucial to develop more efficient preprocessing, feature selection, and dimensionality reduction techniques to handle complex datasets. Designing AI models with improved interpretability, such as rule-based models or models that provide evidence for their decisions, could enhance their adoption in clinical settings. 44 Finally, advancing multimodal data fusion technologies may be crucial for enhancing the accuracy of epilepsy diagnosis and prediction. 45
Limitations
The pioneering study leverages bibliometric visualization to analyze research on DL's application in epilepsy over the past two decades, while there are several limitations that should be considered: since the study only included literature from WoSCC, it might have excluded relevant data from other major databases 46 ; the study was restricted to English-language literature, which means that papers published in other languages were not included; owing to the dynamic and continuously updated nature of academic databases, it might result in some extent of incomplete and biased data. However, it should be noted that the Science Citation Index is designed to identify a key set of journals or publications that represent the most significant research in a field. 47 Journals included in the Science Citation Index Expanded within WoSCC are recognized as world-class because of their strict selection process. 46 Therefore, despite the limitations, WoSCC publications are typically regarded as representative of the research level in the field of DL applied to epilepsy.
Conclusion
Based on 1266 publications from WoSCC (2006–2025), this study uses CiteSpace, VOSviewer, and Bibliometrix to quantitatively and visually analyze indicators such as institutions, authors, citations, and keywords. It reveals three major research hotspots and frontiers in the application of DL in epilepsy: (i). EEG Multimodal Integration. Research is transitioning from single-modality EEG to multimodal data fusion involving EEG, MEG, and fMRI. CNNs, LSTMs, and GNNs are increasingly utilized for seizure detection, prediction, and epileptogenic focus localization, with a clear trend toward developing real-time, wearable early-warning systems. (ii). Explainable AI. The keyword “explainable artificial intelligence” exhibited a sharp citation burst in 2024 (3.09), indicating that future research must balance predictive accuracy with clinical interpretability to gain physician trust and facilitate real-world deployment. iii. Global Collaborative Networks. Collaboration maps covering 1957 institutions across 290 countries/regions show that China and the United States lead in research output. Traditional research powers and emerging economies are forging transcontinental, multicenter, and multidisciplinary partnerships.
Researchers could leverage these insights to launch targeted projects, such as enhancing seizure-prediction accuracy, developing robust multimodal-fusion pipelines, and creating clinically interpretable deep-learning models. This approach helps to ensure that research aligns with both individual expertise and pressing clinical needs.
Footnotes
Acknowledgments:
Our colleague, Li Wei, offered valuable assistance in conceptualizing the paper, creating figures, and submitting it to journals.
Ethical approval
This study did not involve human and/ or animal studies. Therefore, ethical approval does not apply to this study.
Author contributorship
Wu Yiman was responsible for the overall design, performed experiments, and authored the paper. Dr Wu Wenqi spent a great deal of time assessing the paper and made significant revisions.
Funding
The authors disclosed receipt of the following financial support for the research, authorship, and/or publication of this article: This work was supported by the Yancheng Health Commission 2024 General Medical Research Project (Grant No. YK2024183).
Declaration of conflicting interests
The authors declared no potential conflicts of interest with respect to the research, authorship, and/or publication of this article.
Data availability statement
The original contributions featured in the study are incorporated within the article or supplementary material, and any further inquiries ought to be directed to the corresponding author.