
Abstract
Objective
This study aims to reveal global advancements and trends in machine learning (ML) for chronic disease management through a comprehensive bibliometric analysis, identifying research priorities to guide deeper exploration in the future.
Methods
Relevant documents on ML and chronic disease management were retrieved from the core Web of Science database. Visual analyses of publication volume, research institutions, and countries were conducted using CiteSpace, VOSviewer, RStudio, and other software. An expert panel further analyzed the scale, trends, and potential connections between various ML algorithms and chronic diseases.
Results
A total of 1,242 documents were included in this study. The findings indicate a continuous rise in studies on ML in chronic disease management, with the United States (n = 303, 23.5%) and China (n = 259, 20.1%) as primary research contributors. Logistic regression (n = 459) remains the most widely used algorithm, while neural networks (n = 183) show promising potential. Research hotspots are concentrated in diabetes and cardiovascular disease, focusing mainly on risk prediction, disease diagnosis, and personalized treatment.
Conclusion
ML is rapidly integrating into personalized medicine, real-time monitoring, and multimodal data fusion. However, challenges such as limited collaboration, weak model generalization, and data privacy persist. Future efforts should prioritize algorithm optimization and multisource data integration to advance clinical applications.
Keywords
Introduction
The globally high incidence and mortality rates of chronic diseases, such as diabetes, cardiovascular disease (CVD), and chronic respiratory conditions, present significant public health challenges. 1 According to the World Health Organization, chronic diseases account for approximately 41 million deaths annually, representing 74% of all deaths worldwide. 2 Due to their prolonged duration, complex progression, and challenges in achieving a cure, chronic diseases often require long-term monitoring and personalized treatment, 3 placing substantial strain on healthcare resources and impacting patients’ quality of life. Traditional chronic disease management systems, however, are constrained by linear statistical models and reliance on empirical judgment, making them insufficient for processing vast amounts of multidimensional health data, particularly in meeting individualized treatment needs and enabling precision interventions. 4 Although substantial advances have been made in identifying new treatments and prevention strategies, the prevalence of chronic diseases not only remains a pressing issue but continues to rise. 2 Therefore, new technologies that both complement and go beyond current evidence-based medicine are urgently needed to reduce the impact of chronic diseases on modern society.
The rapid development of artificial intelligence (AI) technology offers a transformative perspective on chronic disease management. Machine learning (ML), a core technology within AI, has recently gained prominence, demonstrating revolutionary potential, particularly in chronic disease management. 5 ML can identify potential risk patterns within vast, complex, and heterogeneous medical data, facilitating personalized health intervention plans. For instance, by analyzing electronic health records (EHRs), genomic data, and lifestyle data, ML enables the accurate prediction of chronic disease progression, optimization of treatment plans, and dynamic patient monitoring. 6
Compared to traditional methods, ML's primary advantage lies in its ability to process multivariate, nonlinear data, achieving highly accurate predictions in complex medical scenarios. 7 This capability has positioned ML as a leading technology in chronic disease management. Over recent decades, a growing body of research has emerged exploring ML's applications in this field. Bibliometric research has systematically analyzed the development trajectory and focus areas in this field. Among them, Zhang et al. 8 elucidate the current research status, hot topics, and frontier areas in AI applications for autism treatment. Xiong et al. 9 summarize global trends in digital pathology research for lung cancer over the past 20 years, highlighting the role of AI algorithms in enhancing pathological classification, prognosis prediction, and treatment evaluation for lung cancer. In terms of applied research, Zhou et al. 10 propose an innovative diagnostic method for chronic diseases that integrates convolutional neural networks (CNNs) with ensemble learning, demonstrating significant improvements in diagnostic accuracy (ACC) and reductions in missed and incorrect diagnoses. Methodological reviews start from the challenges in model design and deployment. Tsang et al. 11 critically assess the safety, interpretability, and deployment readiness of models for remote asthma management in mobile health environments, proposing improvement suggestions. Alhassan and Zainon 12 systematically review the application of feature selection, dimensionality reduction techniques, and commonly used classifiers in improving diagnostic efficiency and ACC, providing important references for subsequent model optimization. Several systematic reviews and meta-analyses have quantified the value of ML from the clinical effectiveness perspective: Gudigar et al. 13 reviewed research on AI-based automatic hypertension detection and complication assessment, listing performance metrics, publicly available datasets, and model reproducibility evaluation results, providing empirical evidence for clinical deployment. Silva et al. 14 focused on community-level prediction models and performed a meta-analysis of the overall prediction performance of common algorithms. Delpino et al. 15 comprehensively summarized the application status and achievements of ML in chronic disease prediction by reviewing 42 studies retrieved from five databases.
Although numerous studies have investigated the specific applications of ML in chronic disease management, existing research predominantly centers on individual diseases (such as diabetes or CVD) or single ML algorithms (like logistic regression or neural networks). A systematic review and trend analysis covering the entire field remain absent. Specifically, no comprehensive research framework or trend analysis exists on the interconnections among ML algorithms, chronic disease types, and application scenarios, creating a gap that restricts the broader and more in-depth application of ML in chronic disease management. To address this gap, this study integrates bibliometric and content mining analyses to provide a comprehensive overview of key application areas, research collaboration networks, and emerging trends in the global use of ML for chronic disease management. Tools such as CiteSpace and VOSviewer are employed to analyze the global research collaboration network, keyword clustering, and trend evolution, offering new insights and data support for future research in this field. This systematic and visual analysis not only establishes a theoretical foundation for subsequent studies but also offers forward-looking insights to advance the application of ML in medical practice. Figure 1 presents a conceptual diagram illustrating ML in chronic disease management, showcasing how health management can be conducted in a data-driven manner.
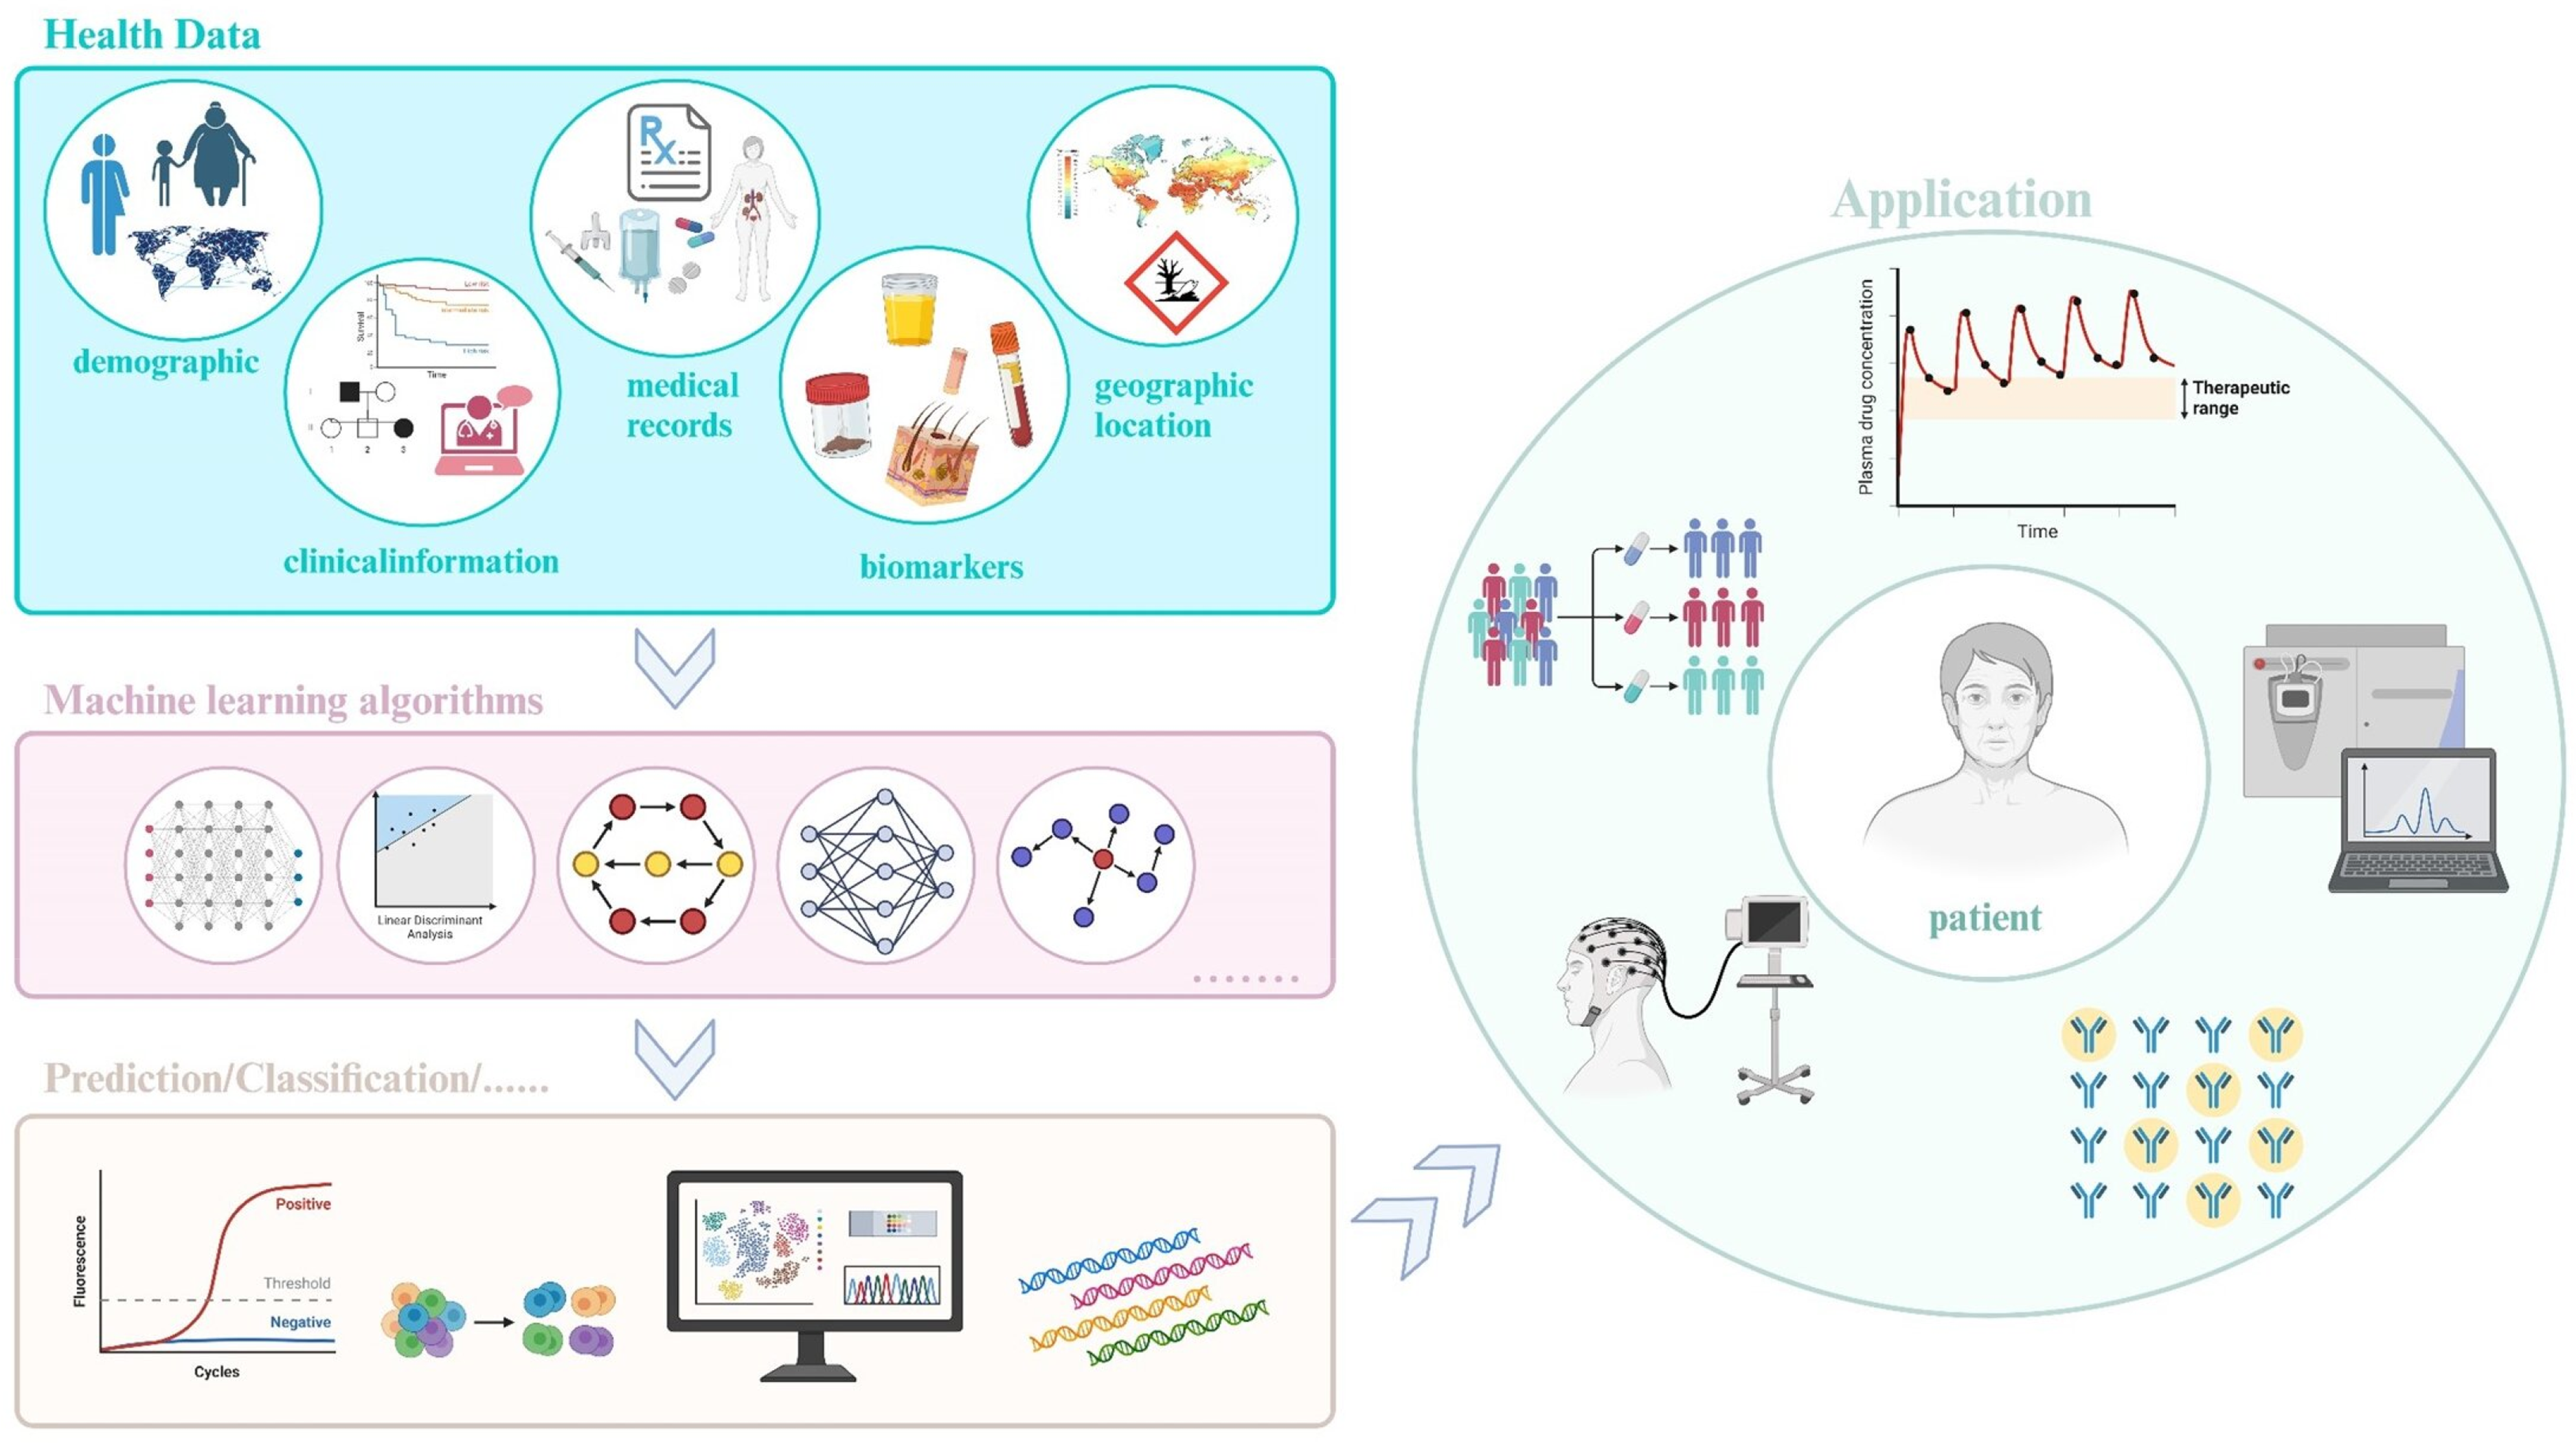
Conceptual diagram of machine learning in chronic disease management. The core of this framework centers on patient health data, including electronic health records, biomarkers, and other relevant metrics. After data collection, processing, and feature extraction, machine learning models are used to predict, classify, and screen for chronic diseases. The diagram further illustrates applications such as personalized treatment, disease progression prediction, and remote monitoring. Finally, a feedback mechanism continuously optimizes the management process, enhancing overall healthcare quality and patient health outcomes.
Method
Reasons for choosing bibliometrics
This study aims to grasp the global research landscape and evolving trends of ML in chronic disease management from a macroperspective. Although systematic reviews and meta-analyses offer invaluable depth in evaluating clinical evidence for specific models or algorithms, they typically rely on strict inclusion and exclusion criteria, limiting the scope to a few dozen high-quality studies and making it difficult to comprehensively cover the diversity of research in this field. 16 In contrast, bibliometric analysis enables the quantitative and visual processing of large-scale publications, using techniques such as cocitation networks, coword analysis, keyword emergence detection, and topic evolution tracking to reveal the dynamic changes in research hotspots, interdisciplinary collaboration, and international cooperation networks. For example, Xiong et al. 9 conducted an analysis in the field of digital pathology in lung cancer and showed that the concentration of highly cited articles (such as in 2018) was closely associated with changes in subsequent research directions, highlighting the potential role of bibliometrics in predicting research turning points. Zhang et al. 17 utilized bibliometric analysis to uncover the research trajectory of anti-inflammatory treatments for coronary heart disease. Therefore, the macroperspective of bibliometrics aligns closely with the “comprehensive and forward-looking” goals of this study.
Data sources and literature screening
This study uses data collected from the Web of Science Core Database, widely regarded as an authoritative source for interdisciplinary academic research and frequently validated in bibliometric studies.18,19 To ensure comprehensive coverage, we compared WoS with PubMed for key publications in our target field and observed a high overlap rate (>85%) in high-impact articles, confirming the robustness of WoS as the primary data source for this bibliometric analysis. Following the PRISMA Extension for Scoping Reviews 20 guidelines to ensure methodological rigor in our scoping review process, we mapped each step of literature identification, screening, and selection in Figure 2. To complement this with a systematic presentation of bibliometric indicators, we also completed the Bibliometric Reviews of the Biomedical Literature checklist 21 for reporting bibliometric reviews of the biomedical literature (see Appendix 1). The search expression was structured as follows: TS = (“machine learning” or “neural network” or “deep learning” or “decision tree” or bayesian or “naive bayes” or “random forest” or “logistic regression” or “k-nearest neighbor” or “k means clustering” or SVM or XGBoost or AdaBoost or Markov) AND TS = (“chronic disease” or “chronic illness” or “chronic non-infectious disease” or “chronic non-communicable diseases”).

Search and filter process diagram.
To minimize selection bias, a one-time search was conducted in the Web of Science database on 31 December 2024, covering the period from the database's inception through 31 December 2024. A total of 4,679 documents were retrieved, with “all records and cited references” exported in plain text format. The data were then imported into EndNote software for deduplication. To ensure comprehensiveness, specific inclusion and exclusion criteria were applied.
Inclusion criteria: Studies must address the application of ML technology in chronic disease management; only articles classified as “Article” or “Review Article” are included; publications must be peer-reviewed and published in academic journals. Exclusion criteria: meeting minutes, briefings, correspondence, and studies with incomplete or duplicate information are excluded.
Ultimately, 1,242 documents that met the inclusion criteria were selected for bibliometric and trend analyses. Using literature mining and content analysis, 22 we extracted the ML algorithms, chronic diseases, and their interrelationships involved in each article to lay the foundation for subsequent analysis. The detailed search and screening process are shown in Figure 2, and the data cleaning procedure (including the specific methods for synonym merging and standardization) is detailed in Appendix 2. These steps ensure consistency in the algorithms and disease classification, laying the foundation for subsequent analysis.
Data analysis methods
Currently, limitations persist in information extraction and content analysis when a single bibliometric tool is used.
23
To comprehensively analyze global research trends in ML for chronic disease management, this study employs multiple bibliometric tools to process and visualize bibliographic data, enhancing the scientific rigor and reliability of the results. Our analysis is guided by the science mapping framework proposed by Cobo et al.,
24
which structures bibliometric interpretation along three key dimensions: (1) theme dynamics (temporal evolution of research topics), (2) structural analysis (collaboration networks and knowledge clusters), and (3) evolutionary pathways (topic development trajectories). To ensure reproducibility, parameter selection (e.g., time slices and clustering thresholds) was validated through sensitivity (SEN) analyses and aligned with established bibliometric standards (Appendix 3). These settings were designed to balance noise reduction and trend detection in our analysis. A brief overview of the tools and their applications in this study is provided below.
CiteSpace (version 6.3.R1): a Java-based scientometric tool developed by Chen and CiteSpace
25
recognized for its ability to reveal research hotspots and the evolution of knowledge structures. We use this tool to conduct keyword cluster analysis, identifying core research topics within the field. The specific parameter settings are as follows: time slice set from 2006 to 2024, with a segment length of 1 year; node type selected as “Keyword” for co-occurrence analysis; the Pathfinder and Pruning sliced networks algorithms are chosen for network pruning; K value set to 20. VOSviewer (version 1.6.20): a free Java-based mapping software developed by the Centre for Science and Technology Studies at the Leiden University, Netherlands, designed to generate various visual networks.
26
This tool supports global research collaboration analysis, constructs collaboration networks among countries and institutions, and performs keyword co-occurrence analysis. Its visualizations clearly illustrate the intensity of research collaborations, making it ideal for academic network studies. We set the following parameters: (1) the co-occurrence analysis method is selected as full counting, (2) the similarity normalization uses the association strength algorithm, (3) the clustering resolution parameter is set to 1.0, and (4) the minimum keyword occurrence frequency is set to 5. Bibliometrix: an R-based bibliometric tool used for extracting and analyzing bibliographic data from the Web of Science database.
27
In this study, Bibliometrix generates topic maps and analyzes the evolution of research hotspots in ML for chronic disease management. This tool is selected for its strong performance in processing complex datasets and generating diverse visualizations. Scimago Graphica (version 1.0.16)
18
and Pajek (64-bit version) portable version (version 5.18).
28
In order to enhance the readability of the knowledge map, Scimago Graphica and Pajek (64-bit version) were used to generate a map of country cooperation, showing the research contributions and cooperation patterns of different countries in this field. We set the following parameters: (1) the Fruchterman-Reingold force-directed layout algorithm is used in the country cooperation network, (2) the edge weight threshold is set to at least five collaborations, (3) node size is proportional to the publication volume of the country, and (4) modularity analysis is used to identify cooperation clusters. Origin (version 2024): a professional data analysis and scientific mapping software developed by OriginLab, Inc., offering robust data import, analysis, mapping, and export capabilities. In this study, Origin is used to present annual publication trends and Sankey diagrams, revealing global research growth trends and shifts in research hotspots. RStudio (version: 4.1.0): an integrated development environment for the R language, designed to simplify programming, data analysis, and visualization processes with a user-friendly interface.
29
In this study, RStudio generates heat maps of high-frequency keywords, time-trend charts of frequently used algorithms, time evolution charts of high-frequency chronic disease types, and analyses of research focus on different chronic diseases across countries. In this study, we used several R packages, including reshape2, tidyverse, bibliometrix, plyr, scales, viridis, and ggplot2, to generate heat maps of high-frequency keywords, time-trend charts of commonly used algorithms, and time evolution charts of high-frequency chronic disease types. We also used tidyverse, readxl, and rnaturalearth packages to generate heat maps.
Result
Annual issuance volume and growth trend analysis
The first research article on ML and chronic diseases was published in 2006. Figure 3(a) presents the temporal distribution and annual citation volume of literature on ML and chronic diseases from 2006 to 2024. The results indicate a steady increase in research output over time, reflecting a significant growth trend. This study categorizes research from 2006 to 2024 into three distinct phases (Figure 3(b)): (1) germination period, 2006–2011: This initial phase marks the emergence of research in this field, with an average annual publication count of fewer than 20, reflecting a relatively slow research pace. A linear regression model (y = 2.5x−1243, R² = 0.845) illustrates the limited growth during this period. (2) Slow growth period, 2010–2018: This phase shows moderate growth, with the annual number of publications reaching 30. Research activity gradually expands, supported by a linear regression model (y = 4.8x−9682, R² = 0.978), indicating steady development. Rapid growth period, 2019–2024: This phase experiences a significant surge in publications, accounting for 74.96% of the total research output over 6 years. This surge highlights the expanding scope of ML applications in chronic disease research and the growing global interest in this topic, as supported by a linear regression model (y = 19.2x−38665.4, R² = 0.890).

Temporal trends in publications (2006–2024) and three-stage growth model. (a) Total publications and citations show a nonlinear increase (R²=0.9655), with a sharp surge post-2019. (b) Staged analysis reveals: germination period (GP, 2006–2011, y = 2.5x−1243, R²=0.845), slow growth period (SGP, 2012–2018, y = 4.8x−9682, R²=0.978), and rapid growth period (RGP, 2019–2024, y = 19.2x−38665.4, R²=0.890), reflecting accelerating interest in machine learning for chronic disease management.
Nonlinear regression analysis provides a well-fitting curve (y = −4191−4170.711x + 1.038×2, R² = 0.96552), capturing the overall research development trajectory in this field (Figure 3(a)).
Country analysis
Research on ML in chronic disease management has been conducted across 90 countries worldwide. The top 10 countries/regions by research output are listed in Table 1. The United States ranks highest in both the number of published articles and total citations in this field and also occupies a central position in the research network. China and India follow, ranking second and third in publication volume. The United States and China are the primary contributors to research on the application of ML in chronic disease management. Although China ranks just behind the United States in publication volume, a substantial difference exists in citation frequency between the two. This disparity may result from the United States’ longer history in this field, while China has experienced rapid development only in recent years. Notably, although Ireland has a relatively low publication count, it has the highest average citations per article, highlighting the significant impact of its publications. Table 1 presents the top 10 countries/regions by publication count in ML research applied to chronic disease management.
Top 10 countries in chronic disease management field output by machine learning.

Note. GCS: global citation score; PPC: per-paper citations.
Figure 4 comprehensively illustrates the global research landscape and evolutionary trends of ML in chronic disease management. Figure 4(a) reveals the distribution of research output across countries, where the size of the circles reflects the research contribution of each country. The United States and China lead significantly in publication volume, demonstrating their dominant positions in this field. Figure 4(b) presents the collaboration network among the top 30 countries by publication volume. The thickness and density of the chords represent the strength and extent of collaboration, showing that countries like the United States and China not only produce abundant research outputs but also occupy central positions in international collaborations. European countries also exhibit relatively tight collaboration networks. Figure 4(c) incorporates the time dimension, illustrating the temporal evolution of research across countries. The color of the nodes reflects the time when research in each country began, with darker colors indicating earlier research activity. The United States entered this field earlier, while China, India, and other countries gradually followed, with a significant increase in publication volume and collaboration intensity in recent years. These figures highlight the distribution of global research capacity, the network structure of international collaboration, and the dynamic temporal evolution of research development, reflecting the globalized research trends and cooperative development in the application of ML to chronic disease management.

Productivity and international collaboration in research on machine learning in chronic disease management. (a) Geographical distribution of research output by country: The United States and China dominate the landscape with bubble sizes representing publication volume (United States: 303 articles, 23.5%; China: 259 articles, 20.1%), visually underscoring their leadership in output. (b) Chord diagram of international collaboration among the top 30 countries: Thick chords indicate strong collaboration between the United States, China, and European nations (e.g., United Kingdom and Germany), reflecting dense coauthorship networks. (c) Temporal evolution of research in chronic disease management by country: The United States emerged as an early leader, while China and India showed rapid growth in publication volume.
Institutional analysis
A total of 1,102 institutions worldwide have participated in research on ML for chronic disease management. The top 10 research institutions by publication volume are listed in Table 2. Additionally, a collaboration map and clustering map for the top 78 research institutions, filtered by a minimum threshold of five publications per institution, are shown in Figure 4. The results indicate that U.S.-based institutions, particularly the University of Washington and Harvard University, are highly prominent in this field. The University of Washington ranks first in publication count, with 17 documents, highlighting its activity and contributions. Although the Harvard University has a relatively lower publication count (n = 13), its high citation and average citation rates underscore its substantial academic influence, suggesting that publication volume alone is not the only measure of impact; Harvard's contribution to high-quality research remains significant. Chinese institutions have also made considerable progress, with Shanghai Jiao Tong University and Capital Medical University emerging as key research forces, particularly in international collaborations. Analysis of institutional collaboration networks reveals that cooperation among most research institutions remains limited, with international partnerships needing further strengthening (see Figure 5). Enhancing global institutional collaboration in the future could not only improve research efficiency but also support the practical application of ML in chronic disease management.

Collaborative network of research institutions. Different colored areas represent distinct clusters. Lines between circles indicate cooperative relationships, with thicker lines signifying stronger collaborations. Circle size is positively correlated with the institution's publication volume.
Top 10 institutions in chronic disease management field output by machine learning.

Note. Univ: university; PPC: per-paper citations; Ctr dis control & prevent: Centers for Disease Control and Prevention; Capital Med Univ: Capital Medical University; Calif: California. aPPC: per-paper citations.
Analysis of the attention of various countries to chronic diseases
We selected the top eight chronic diseases by research frequency: diabetes (n = 301), CVD (n = 138), asthma (n = 72), cancer (n = 68), chronic kidney failure (n = 45), Chronic Obstructive Pulmonary Disease (COPD) (n = 41), Alzheimer's disease (n = 27), and obesity (n = 23). The corresponding author's country for each disease was recorded to illustrate varying levels of research focus across nations (see Figure 6). The results reveal substantial global differences in chronic disease research priorities. 1 These disparities can be attributed to a combination of epidemiological burden, healthcare system priorities, funding allocation mechanisms, and technological readiness across nations.

(a) Concern regarding diabetes across various countries. (b) Concern regarding cardiovascular disease across various countries. (c) Concern regarding asthma across various countries. (d) Concern regarding cancer across various countries. (e) Concern regarding chronic kidney disease across various countries. (f) Concern regarding COPD across various countries. (g) Concern regarding Alzheimer's disease across various countries. (h) Concern regarding obesity across various countries.
Diabetes is one of the most extensively studied chronic diseases in the field of ML, with research primarily concentrated in China, the United States, and India—three countries with a high disease burden. China's active research output may be attributed to its large patient base, rapid urbanization, and lifestyle changes.30,31 The United States benefits from significant private sector investments in digital health solutions, 32 while India's involvement is closely related to its rising diabetes burden and advancements in AI and information technology capabilities. 33 In contrast, European countries such as France and Germany contribute relatively less, possibly due to their healthcare priorities and stringent data privacy regulations. 34
CVD research is similarly led by China and the United States, aligning with the mortality patterns in these countries. In China, CVDs account for more than 40% of total annual deaths. 35 In the United States, disparities in cardiovascular health may stem from socioeconomic inequalities. 36 Asthma research is predominantly concentrated in the United States, reflecting the country's high asthma prevalence. 37
In cancer management, the United States remains at the forefront, partly due to substantial funding from the National Institutes of Health (NIH), which allocated $7.97 billion in 2023. 38 China has progressively increased its focus on cancer research, likely due to rising cancer incidence rates 39 and improvements in its national cancer registry system. 40
For chronic kidney failure and COPD research, the United States takes a dominant role, which is consistent with its high dialysis treatment prevalence 41 and the COPD incidence associated with smoking. 42 Australia's contributions to COPD research are also notable, possibly driven by unique environmental exposure risks in rural areas. 43
In Alzheimer's disease research, China has seen rapid growth, supported by its large patient population, government policy backing, and continued investment in scientific research. 44 Obesity research remains centered in the United States, likely due to its high prevalence, 45 robust research funding, 46 and innovative research ecosystem. 47
Overall, the differences in chronic disease research among countries not only reflect epidemiological burdens but also reveal distinct policy orientations and resource allocation strategies.
Keyword analysis
Keywords provide a high-level summary and distillation of an article's topic. By analyzing keyword frequency in a given field, research hotspots can be identified. After excluding unrelated keywords, the top three keywords by frequency are “diabetes,” “hypertension,” and “deep learning”. Using VOSviewer to map keywords as nodes, a keyword co-occurrence network is generated. Node size reflects keyword frequency in the literature, and lines between nodes represent the co-occurrence frequency or relationship of keywords within the same document (Figure 7(a)). Analyzing authors’ keywords in a specific field offers insight into research directions and trends. A heat map of the top 20 keywords by frequency is plotted, where blue indicates lower frequency in a given year and yellow indicates higher frequency (Figure 7(b)).
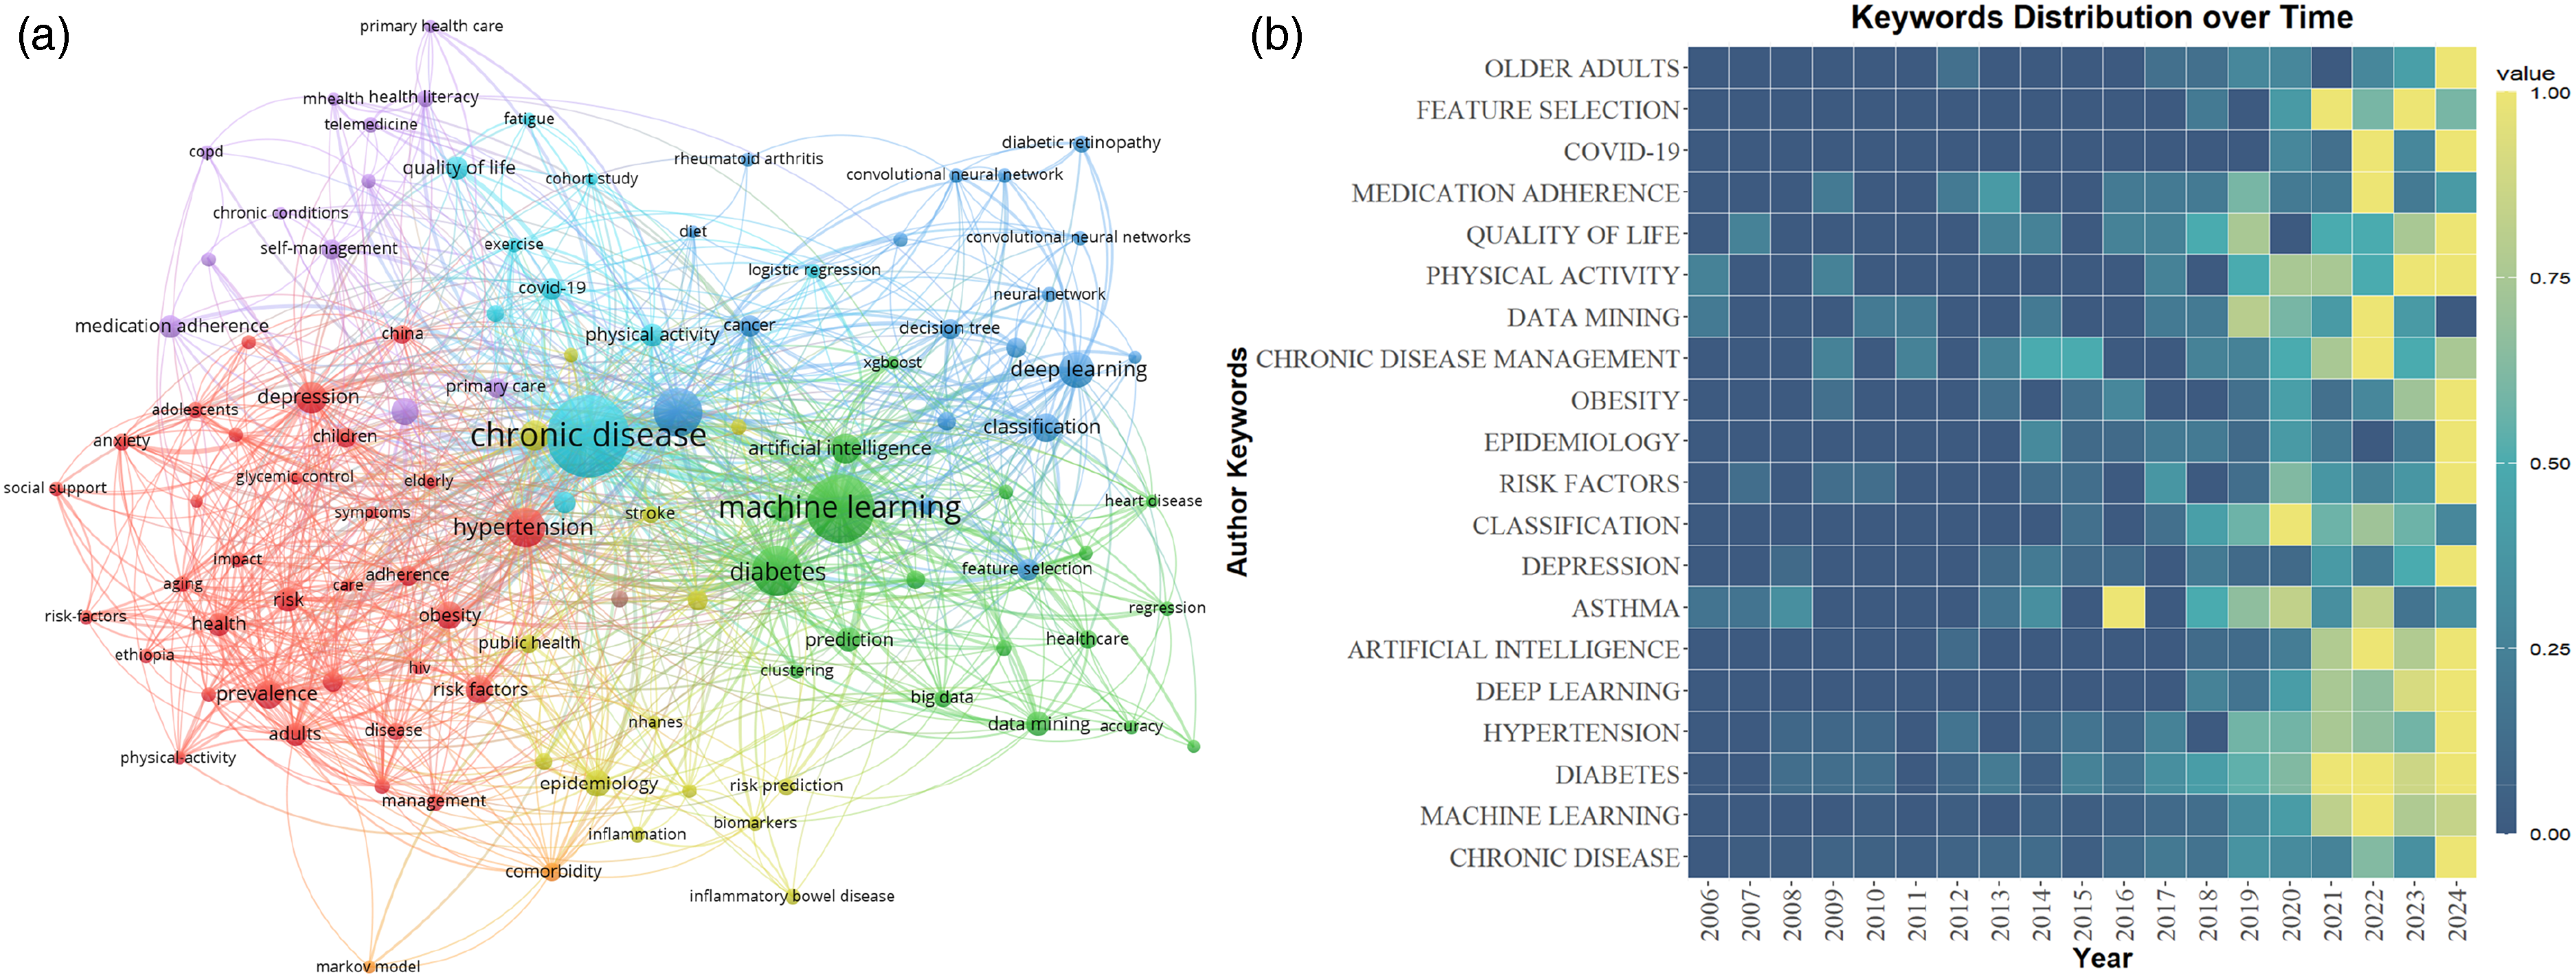
(a) Co-occurrence network of keywords related to machine learning in the field of chronic disease management. (b) Heatmap of high-frequency keywords.
Analysis of popular chronic diseases and commonly used algorithms in chronic disease management
Through the analysis of ML applications in chronic disease management, this study identifies several high-profile chronic diseases and commonly used ML algorithms. Figure 8(a) presents the temporal trends of the top 12 algorithms. Logistic regression stands out as the most widely used algorithm in chronic disease management (n = 459), maintaining its popularity since 2006. Notably, neural networks, despite only gaining popularity since 2019, have become the second most common algorithm (n = 183), underscoring their significance in chronic disease management. Prior to 2016, research in this field primarily focused on algorithms like logistic regression. However, after 2016, studies diversified, increasingly incorporating algorithms such as neural networks, random forests, and decision trees, with a proportional decline in the use of logistic regression. This shift suggests that as dataset size and complexity increase, more advanced algorithms (such as deep learning) are increasingly applied. For specific chronic disease management scenarios, algorithm selection now tends toward models with greater computational power and the ability to process complex, nonlinear data. Figure 8(b) illustrates the trends of the top 17 chronic diseases over time. As shown, diabetes and coronary heart disease remain primary research focuses. Additionally, as algorithms evolve, a growing number of chronic diseases are being included in research.
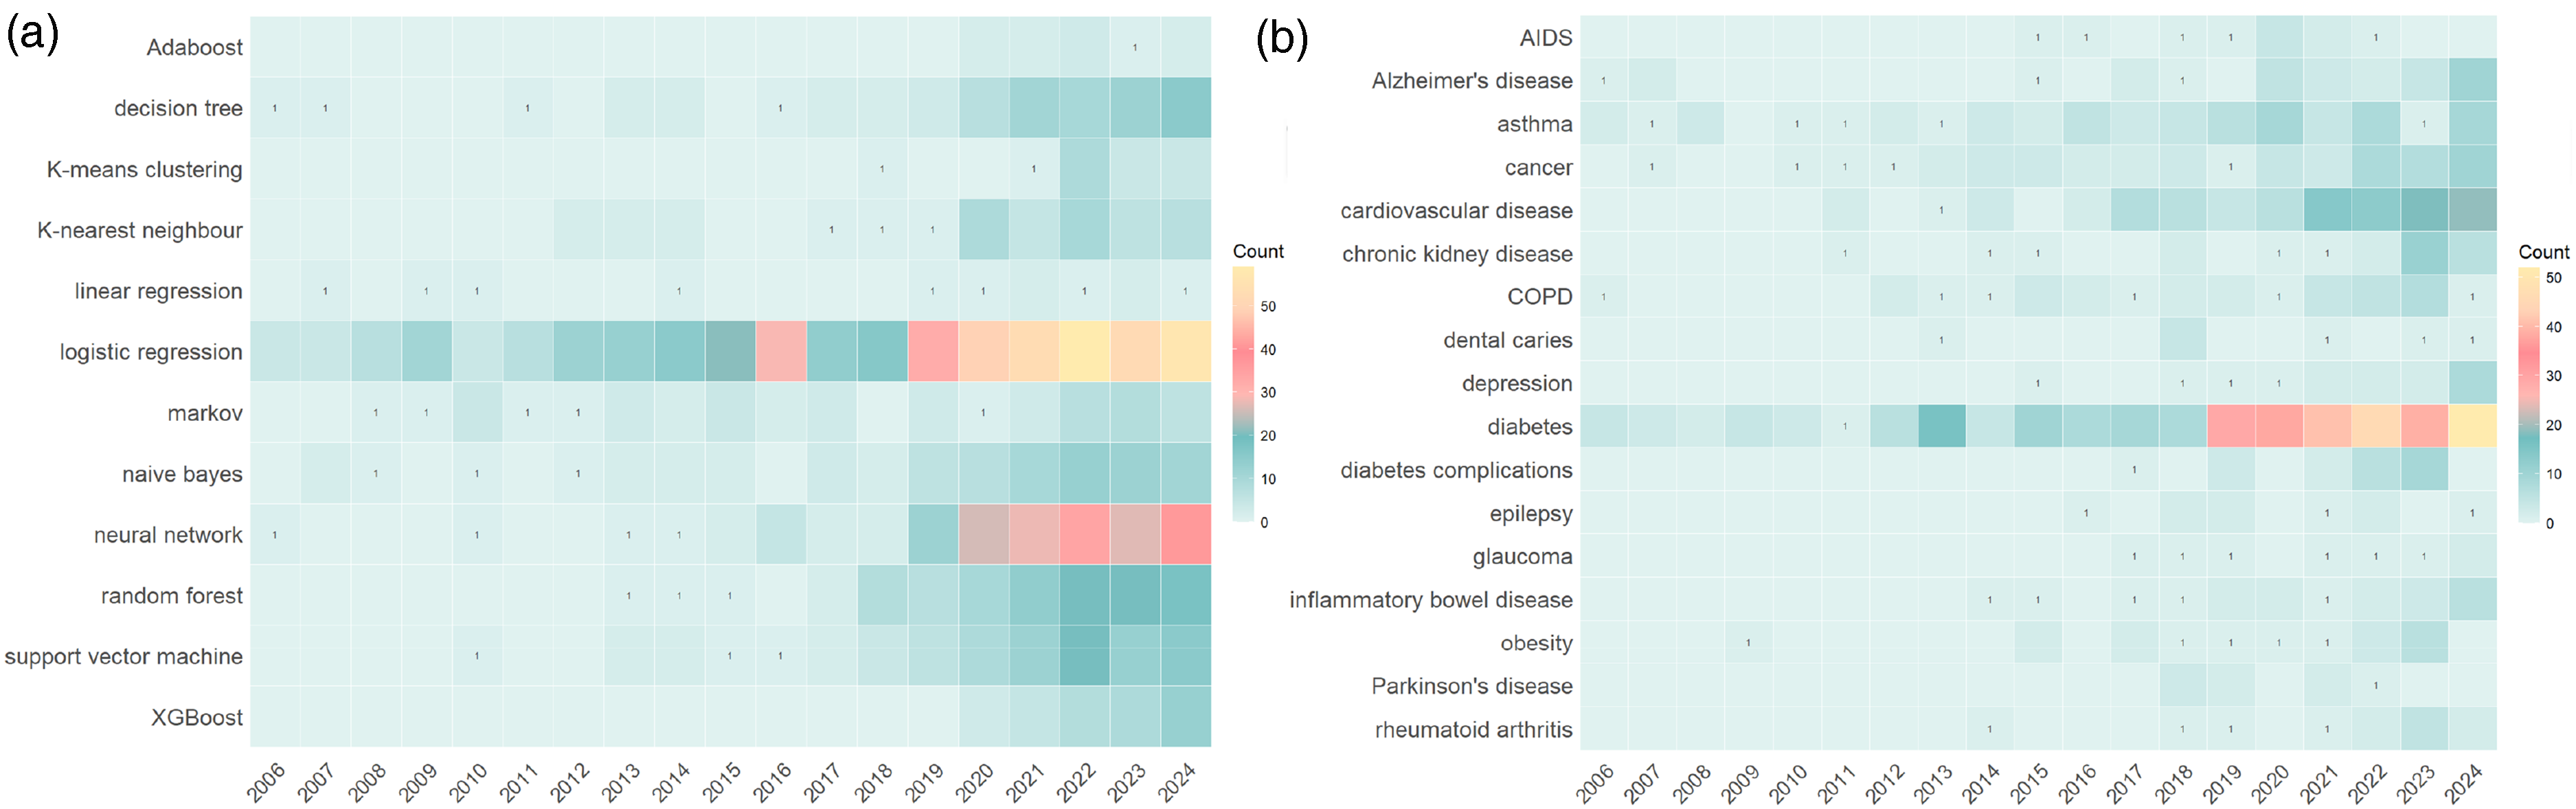
(a) Trend chart of machine learning algorithms over time, showing that neural networks gained prominence post-2019, while logistic regression remained consistently relevant, reflecting the methodological evolution from traditional to advanced ML techniques. (b) Trend chart of chronic diseases over time, showing diabetes and cardiovascular diseases as persistent hotspots, while Alzheimer's disease and chronic kidney failure gained traction after 2020, reflecting the field's expansion into complex, multifactorial diseases.
A Sankey diagram is a specific type of flowchart that consists of edges, flows, and nodes. In this diagram, nodes represent different categories, delineating various stages or partitions of energy flow, while edges connect nodes across different stages, representing the flow of energy or data. This visualization effectively displays trends in data flow. We extract the ML algorithms, purposes, and chronic diseases addressed in each of the retrieved documents and present the connections among these three elements in the form of a Sankey diagram (Figure 9). Given the large number of algorithms and chronic diseases included in the literature and to maintain focus within this study, we limit our analysis to the top 12 algorithms (n ≥ 8) and the top 18 chronic diseases (n ≥ 7).

Sankey diagram illustrating the relationship between machine learning algorithms, methods, and chronic diseases (analyzing top 12 algorithms [n ≥ 8] and top 18 diseases [n ≥ 7]; node size proportional to frequency, edge width to association strength).
As shown in the figure, logistic regression continues to dominate the prediction and classification tasks for diabetes and CVDs. This is likely due to its strong model interpretability and efficient computational performance, making it suitable for applications such as clinical risk scoring. In contrast, the multibranch connections of neural networks reflect their unique value in the management of complex chronic diseases. Of particular note is their significant association with “feature extraction,” indicating that researchers are increasingly leveraging the automatic feature extraction capabilities of neural networks to process multimodal medical data (e.g., text, images, and laboratory indicators integrated from EHRs). This provides a technical pathway for precision medicine that traditional algorithms are unable to achieve. Algorithms such as random forests, support vector machines (SVMs), and decision trees are primarily focused on classification tasks, likely due to their ensemble learning and noise resistance, making them more suitable for clinical data analysis. Additionally, some algorithms in the figure, such as Adaboost and K-means clustering, show sparse connections, suggesting that their applications in chronic disease management have not been fully explored. Future research could further assess their potential.
Analysis of optimal prediction models for diabetes
Due to the volume of literature, only the most studied diabetes cases are selected for the performance statistics of the best prediction models. A total of 57 studies involving these models are included. In terms of performance, the overall area under the curve (AUC) ranges from 0.661 to 0.999, with an average AUC of 0.9162. The ACC ranges from 0.77 to 1, with an average ACC of 0.9235. The SEN ranges from 0.734 to 1, with an average SEN of 0.9037. The specificity (SPE) ranges from 0.7323 to 1, with an average SPE of 0.9157, demonstrating the high efficiency and ACC of these models in diabetes management, as shown in Figure 10.

Box diagram of the best model performance of diabetes (box plot of AUC, ACC, SEN, and SPE from 57 studies).
Keyword clustering analysis
The Q value and S value are used to evaluate the effectiveness of the mapping by reflecting the homogeneity and consistency of the cluster nodes. A Q value greater than 0.3 is considered significant, while an S value greater than 0.5 indicates a reasonable cluster; a value of 0.7 is indicative of a convincing cluster. 25 The results of the keyword cluster analysis based on the log-likelihood ratio algorithm reveal that the 14 core cluster nodes encompass the primary research areas of ML in chronic disease management, including “diabetes” “risk factors” and “deep learning.” The cluster module value (Q = 0.717) and average silhouette value (S = 0.9404) for the keywords indicate that these clusters are both significant and reasonable. The analysis of these clusters clearly demonstrates the dominance of topics such as diabetes management and risk prediction in this field (see Figure 11).
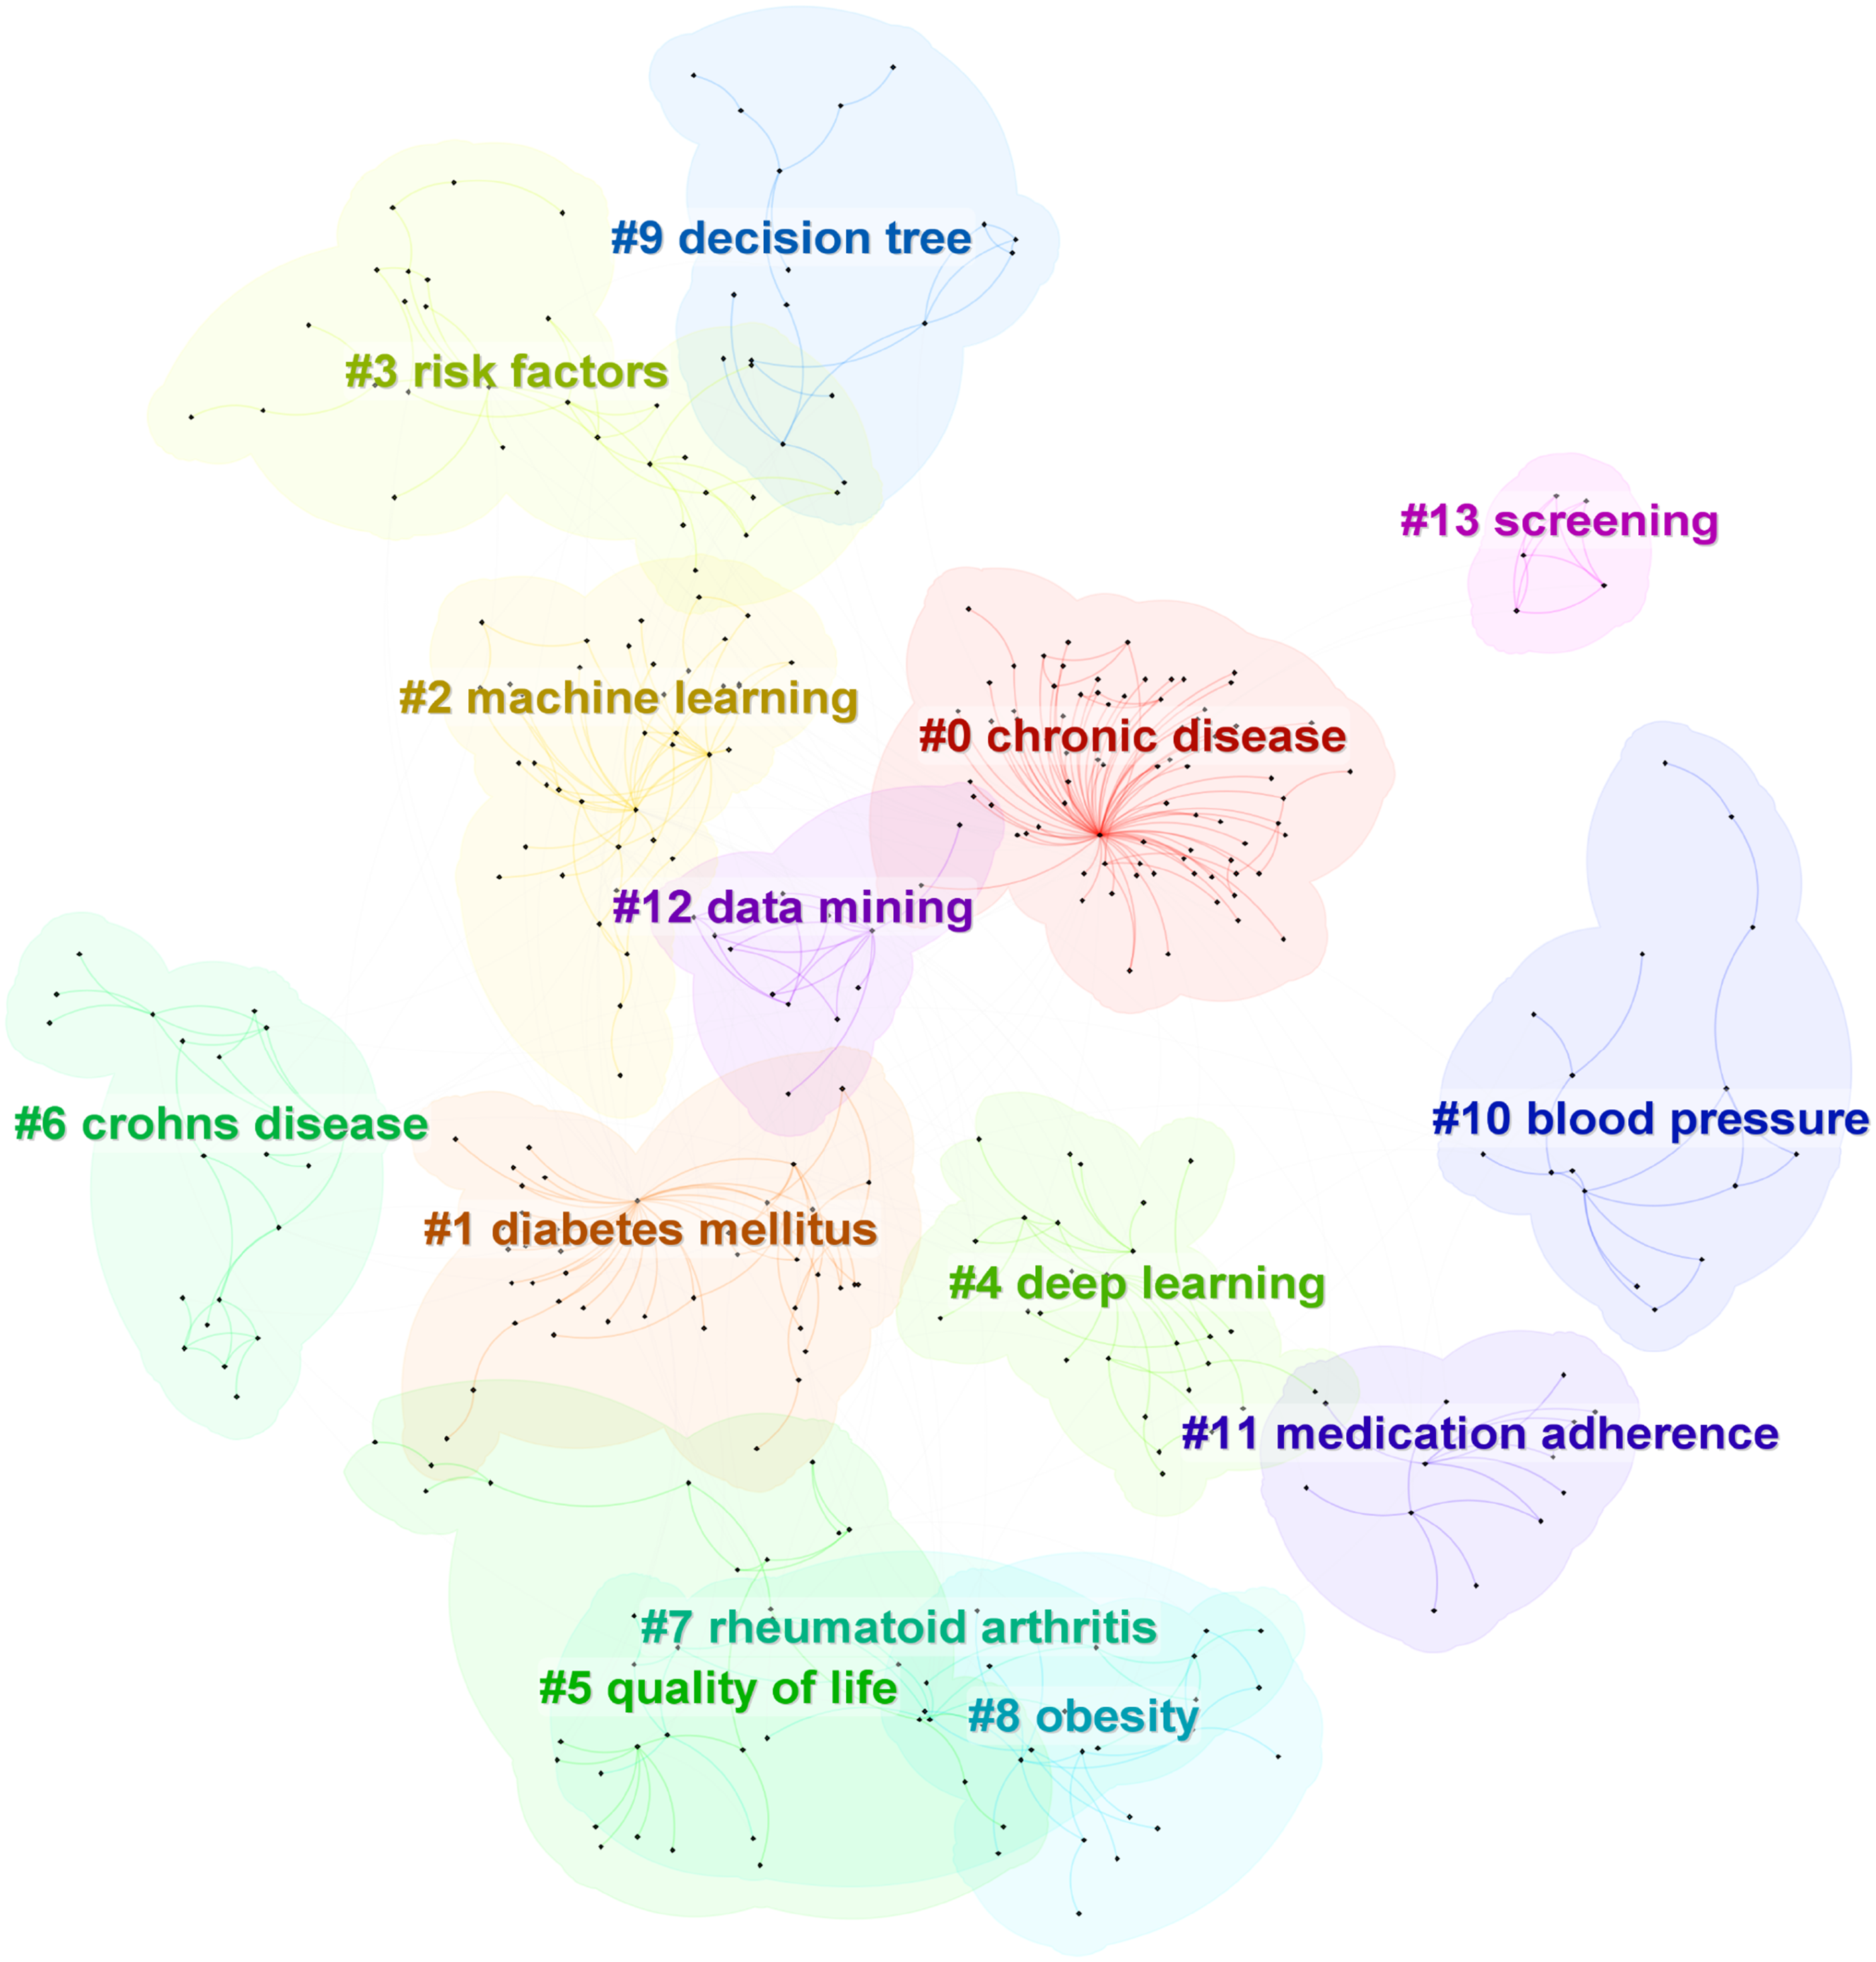
Clustering graph of keywords related to machine learning in the field of chronic disease management.
Trend of change in hot research topics
Thematic maps generated using Bibliometrix construct strategic coordinate maps of keywords in the field of chronic diseases, identifying future research hotspots. These maps are employed to explore the evolution of research topics and predict future research directions. The horizontal axis indicates centrality, while the vertical axis indicates density. A higher centrality value signifies a more central topic that is closely related to other topics, while a higher density value reflects a more mature topic. The map is divided into four quadrants: the first quadrant contains core topics with high maturity, the second quadrant includes niche topics that are highly specialized and gaining popularity, the third quadrant encompasses topics that are either undergoing new developments or nearing decline, and the fourth quadrant contains important topics that have not yet been fully developed (see Figure 12).

Strategic coordinate map of keywords related to machine learning in the field of chronic disease management.
As illustrated in the figure, ML applications for managing chronic diseases such as “deep neural network,” “risk assessment,” and “epilepsy” along with the use of ensemble learning methods and convolutional neural algorithms for risk prediction are identified as relatively mature and core research topics in this field. However, the application of ML in managing chronic diseases such as “diabetes” and “asthma” along with the development of related technologies such as ML-based “Markov decision process” remains underdeveloped and is expected to be a primary research direction in the future.
Discussion
Global research status and trend analysis
This study reveals the current research status and development trends of ML in chronic disease management through bibliometric analysis. The results indicate that, in recent years, there has been a significant growth trend in research worldwide, driven by the increasing demand for chronic disease management. Notably, after 2019, the number of research publications surged, signaling that this field is gradually gaining prominence in academia and the medical industry. This surge may be attributed to the synergistic effects of multiple factors. The continued maturation of deep learning techniques—for instance, the successful application of transformer architectures in clinical natural language processing—has significantly improved the analysis of medical texts. 48 At the same time, the open access to large-scale medical datasets, such as the UK Biobank, has provided essential data resources for algorithm training 49 ; equally important is the improvement in the regulatory environment: between 2018 and 2019, the U.S. Food and Drug Administration (FDA) approved 23 AI-based medical devices, offering institutional support for clinical deployment, 50 including the first autonomous AI diagnostic system for diabetic retinopathy, such as IDx-DR 51 ). These factors have collectively lowered the barriers to research and accelerated the application of ML in chronic disease management.
Additionally, countries worldwide exhibit distinct regional development models in chronic disease management. The United States leads in research output and international influence, dominating global research. This leadership is closely linked to its robust scientific resources and substantial medical expenditures. China, as an emerging scientific research power, has achieved notable research output in diabetes and CVD management in recent years. While a gap remains between China and the United States regarding citations and international collaboration, the capacity and contributions of Chinese scientific research institutions should not be underestimated.
An analysis of international collaborations reveals that while ML has begun to foster cross-border cooperation in chronic disease management, significant disparities remain in both geographic distribution and levels of participation. Specifically, countries such as China, the United States, India, Germany, and Brazil form the core of the collaboration network, with dense connections and thick links between them, indicating high frequencies and intensities of cooperation in areas such as publication, data sharing, and joint projects. In contrast, countries in the Middle East, Africa, and other regions are significantly positioned on the periphery of this network, with sparse collaborative nodes and limited participation in international exchanges and joint efforts. This imbalanced pattern of collaboration not only limits the diversity of global research perspectives but also reduces the efficiency of technology dissemination to resource-limited regions.
To bridge this gap, international conferences and specialized workshops should establish support programs targeting researchers from developing regions—such as the “Implementation Science e-Hub” launched by the Global Chronic Disease Research Alliance. This initiative helps low- and middle-income country teams enhance their capacity in implementation science through online training and case sharing. Simultaneously, governments and funding agencies should prioritize multinational and multicenter research projects. For example, the “UZIMA-DS” data science hub model by the NIH Fogarty International Center has strengthened data analysis and model development capabilities at local universities and research institutions in Kenya and Tanzania. 52 At the data level, building a unified global chronic disease database with clear access and privacy protection standards will provide researchers across countries with reliable, multisource clinical and epidemiological data, thereby accelerating the process of model development and validation. Additionally, regional research alliances in Asia, Latin America, and Africa should be established to develop tailored ML solutions based on local chronic disease prevalence and healthcare resource conditions, thus enabling the effective translation and promotion of technological innovations across different socioeconomic contexts.
The application of ML technology has become mainstream in areas such as diabetes, CVD, and cancer, demonstrating significant research advantages. Additionally, with the diversification of data acquisition channels and the individualization of patient needs, conditions such as inflammatory bowel disease and chronic kidney disease have emerged as new research directions in recent years. Keyword cluster analysis and heat maps indicate that topics such as risk prediction, personalized treatment, and multimodal data fusion are current research hotspots. Logistic regression, initially the most widely used algorithm, continues to hold an important position in chronic disease management. It is particularly prevalent for classifying patient groups and risk stratification due to its interpretability and simplicity. However, as data dimensions and complexity increase, neural networks and deep learning techniques are gradually becoming more powerful tools, especially in handling high-dimensional and nonlinear data, demonstrating higher prediction ACC.
Analysis of popular algorithms
In chronic disease management, ML algorithms are widely used for tasks such as disease risk prediction, diagnosis, classification, and the development of personalized treatment plans. Based on literature analysis results, this study provides a detailed comparison of the current application status, applicable scenarios, and advantages and disadvantages of two common algorithms to reveal the optimal application fields for each algorithm in different chronic disease management contexts.
Logistic regression
Logistic regression is one of the earliest ML algorithms applied to chronic disease management and is extensively used for risk prediction and classification tasks. This algorithm is commonly employed to build predictive models, particularly in medical data analysis, where it predicts the probability of disease occurrence, thereby improving diagnostic ACC. 53 By analyzing a patient's health data—such as weight, blood sugar, and blood pressure—the model can forecast the likelihood of future illness, enabling doctors to identify high-risk individuals early and develop preventive measures. 54
Additionally, logistic regression monitors changes in the condition of diagnosed patients, determining whether there is a risk of deterioration, allowing treatment plans to be adjusted in a timely manner to avoid serious complications. 55 In terms of patient management, logistic regression stratifies patients according to risk levels, allocating more medical resources to support high-risk groups while providing regular follow-ups and health guidance for low-risk groups. 56 This algorithm remains popular in the medical field due to its simplicity and the ease of interpreting results. 57 However, logistic regression assumes a linear relationship between variables and may not perform well when faced with complex nonlinear disease factors. 58 Fortunately, with the development of EHRs and big data technology, logistic regression is expected to be integrated with more complex ML algorithms (such as random forests or deep learning) to further improve prediction ACC and provide stronger support for the intelligent and personalized management of chronic diseases. 59
Neural networks
The application of neural network algorithms in chronic disease management is becoming increasingly widespread. Their unique learning capabilities and ability to process complex data have made them significant in the medical field, especially in chronic disease management. 60
First, neural networks can identify health patterns and potential risk factors by analyzing large volumes of EHR data. 61 For example, by modeling a patient's physiological indicators, medical history, and lifestyle data, a neural network can predict the risk of developing chronic diseases and provide data support for doctors, enabling early intervention. 62 Second, neural networks also demonstrate advantages in formulating personalized treatment plans. 63 By analyzing a patient's genomic data, imaging information, and treatment responses, neural networks can identify the most effective treatments for specific patients, thereby facilitating personalized medicine. 63 The implementation of precision medicine not only improves treatment outcomes but also reduces unnecessary medical expenditures, enhancing resource efficiency. 64 Additionally, neural networks play a critical role in the real-time monitoring and management of chronic diseases. 65 With the proliferation of wearable devices and mobile medical technology, patients’ health data can be collected in real time and uploaded to the cloud. Neural networks process this real-time data to provide instant feedback, helping patients adjust their lifestyles and manage their conditions. 66 For instance, by analyzing a patient's daily activity levels, eating habits, and physiological data, neural networks can issue alerts to warn patients of health risks and encourage adherence to medical recommendations. 67
Furthermore, neural networks are significant for the follow-up management of chronic disease patients. 68 By constructing comprehensive models, neural networks can help healthcare providers identify patient groups that require focused attention and optimize resource allocation. Healthcare institutions can use the prediction results to develop corresponding follow-up plans to ensure that high-risk patients receive timely medical support. 69 In the future, as data sources diversify (including genomics, metabolomics, and lifestyle data), the application prospects of neural networks will expand even further.
Analysis of trending diseases
ML has become a cornerstone in managing chronic diseases such as diabetes and CVD, which pose significant global health burdens due to their high prevalence and complex pathophysiology. This section examines ML applications in these two areas, highlighting key advances in prediction, early detection, and personalized intervention.
Application of ML in diabetes management
Diabetes is one of the most prevalent chronic diseases worldwide, 70 which poses unique challenges in glycemic control and complication prevention. ML models, particularly those using SVMs and neural networks, have demonstrated ACC in predicting glucose fluctuations.71,72 For example, the FDA-approved DreaMed Advisor Pro system improved glycemic control and reduced severe hypoglycemia in adolescents with type 1 diabetes (NCT03003806). 73 A 2023 systematic review of 46 studies showed neural networks outperformed traditional methods in glucose prediction, achieving root mean square errors of 18.88 mg/dL for 15-min forecasts and 21.40 mg/dL for 30-min forecasts. 74
In complication screening, CNNs automate retinal image analysis to detect early signs of diabetic retinopathy, enhancing diagnostic SEN and SPE while reducing clinician workload. 75 Our data indicate existing diabetes risk models achieve a mean AUC of 0.9162, with SEN/SPE of 0.9037/0.9157, aligning with recent reviews on AI-driven retinopathy screening. 76
Future directions
The integration of internet of things (IoT) and wearable devices will drive real-time monitoring ecosystems for diabetes. Continuous glucose monitors transmit live data to ML models, enabling automated insulin dose adjustment and personalized recommendations.77,78 This closed-loop system not only improves management precision but also mitigates acute complication risks. 79
Application of ML in CVD management
CVD, a leading global cause of death, demands early risk stratification and sudden event prediction. 80 Cardiovascular events, such as myocardial infarction and stroke, often occur suddenly. Traditional screening methods lack real-time monitoring capabilities, whereas ML algorithms (e.g., SVMs, decision trees, and neural networks) address this gap. 81 CNNs excel in electrocardiogram analysis, automatically detecting arrhythmias and atrial fibrillation with high ACC. 82 The FDA-cleared AliveCor KardiaMobile device, combining smartphone technology and ML, increased atrial fibrillation detection by 3.9-fold compared to standard care in the Remote Heart Rhythm Sampling Early Atrial Fibrillation Study trial. 83
Wearable heart rate monitors paired with ML models enable real-time anomaly alerts, facilitating timely intervention for acute events. 84 Risk prediction systems using decision trees and random forests integrate multisource data (e.g., medical history, biomarkers, and lifestyle) to stratify patients into risk tiers, enabling personalized prevention strategies for high-risk individuals. 85
Future directions
ML in CVD management will rely on real-time data ecosystems from smartwatches and monitors. Future research should prioritize developing embedded intelligent systems for daily health guidance. 86 Additionally, integrating genomic data with ML will advance precision therapy by predicting individual drug responses, optimizing treatment plans, and minimizing adverse effects. 87
Hot applications of ML in chronic disease management
Disease risk prediction
The keyword clusters #3 “risk factors,” #6 “decision tree,” and #12 “data mining” indicate that risk prediction based on ML technology is one of the research hotspots in this field. In chronic disease risk prediction, ML plays a central role. It not only overcomes the limitations of traditional prediction models but also provides personalized prediction and intervention methods by deeply mining complex multidimensional medical data. 87 In addition, chronic diseases are typically caused by the long-term effects of multiple factors, with slow progression and often subtle early symptoms. 88 This complexity and uncertainty make it challenging for traditional risk prediction methods to accurately assess an individual's disease risk. 89 ML can identify potential risk patterns hidden in large amounts of data such as EHRs, genomic data, lifestyle habits, medication use, environmental exposure, and so on. 6
One major advantage of ML in chronic disease risk prediction is its ability to model complex nonlinear relationships by combining multiple variables, thereby improving the ACC of predictions. 7 For example, through time series data analysis, the model can track dynamic changes in a patient's health status and adjust risk predictions in real time. 90 Compared to traditional models based on fixed variables, the dynamic learning capability of ML enables it to provide more real-time and personalized risk assessments. 91 This capability is particularly critical in managing long-term chronic diseases, as patients’ lifestyles, treatment responses, and environmental factors change over time. Furthermore, ML can automatically extract the most predictive features and help identify hidden risk factors that traditional medicine may overlook. 92 For instance, ML models based on genomic and metabolomic data can reveal individual genetic risks, providing a basis for early screening of high-risk populations. 93 Additionally, ML models can stratify patients and optimize the allocation of medical resources using techniques such as cluster analysis and association rule mining. 94
Disease diagnosis and personalized treatment
High-frequency keywords such as “data mining,” “feature selection,” and keyword clusters #4 “deep learning,” #12 “data mining,” and #13 “screening” suggest that chronic disease diagnosis and individualized treatment based on ML technology are prominent research hotspots in this field. In recent years, ML has demonstrated extensive potential for application in the diagnosis and personalized treatment of chronic diseases.
First, in terms of data processing and feature extraction, ML assists doctors in gaining a more comprehensive understanding of patient conditions by analyzing multimodal data, including electronic medical records, genomic data, and medical images, to extract key features related to chronic diseases. 7 Second, regarding personalized diagnosis and treatment plan recommendations, ML can develop individualized treatment plans based on a patient's genetic characteristics, medical history, and treatment response. For example, genomic data from cancer patients can be used to predict their response to specific drugs, aiding doctors in selecting the most appropriate treatment plans. 89 Gong and Liu 95 develop a three-stage Partially Observable Collaborative Mode model to estimate individual models of chronic disease progression using population data and treatment experiments. This framework is expected to model chronic disease progression and develop personalized adaptive treatment plans for patients within heterogeneous populations. Through dynamic monitoring, ML can track a patient's physiological data in real time, detect changes in condition promptly, and adjust treatment strategies, such as automatically optimizing insulin dosage for diabetes patients to improve treatment outcomes. 90
Moreover, clinical decision support systems powered by ML can help doctors quickly process multisource data in complex cases, providing diagnostic and treatment recommendations that enhance diagnostic efficiency and ACC. 96 For example, in screening for diabetic retinopathy, a ML-based image recognition system can automatically analyze patients’ fundus images and identify the presence of lesions. 97 Currently, these automated screening systems are implemented in clinical settings, significantly improving screening efficiency and ACC. 98
Medication management
High-frequency keywords such as “medication adherence” and keyword clusters like #12 “data mining” and #11 “medication adherence” indicate that medication management for chronic diseases based on ML technology is one of the research hotspots in this field. Chronic diseases are primarily treated with medication, and patients often require long-term or even lifelong medication. According to the World Health Organization, medication adherence refers to the consistency of a patient's actions with the recommendations of a healthcare provider, particularly regarding medication intake. 99 Effective medication management and the achievement of clinical goals depend on this adherence. However, medication nonadherence, including behaviors such as taking less than 80% of prescribed doses or overdosing, is a common problem in chronic disease care. 100
ML can quickly and accurately monitor patients’ medication use and corresponding efficacy indicators by analyzing large clinical datasets such as EHRs and administrative data, thereby exploring ways to improve medication adherence. 101 For example, Salgado et al. 102 describe the use of ML to predict the need for vasopressor administration using 24 clinical variables commonly recorded in intensive care settings, achieving reasonable success by employing unsupervised learning to extract features for modeling and applying them to individual cases.
Similarly, the recommendation system introduced by Morales et al. 103 can suggest suitable drugs for diabetic patients. The system takes user metadata into account to alleviate the cold-start problem associated with new users, employs clustering techniques to identify groups of patients with similar characteristics, and subsequently recommends medications for patients within the same group. A similar system, “IBM Watson for Oncology” (now used in over 230 hospitals), recommends personalized cancer regimens, although challenges related to clinician adoption persist. 104
In addition, ML plays a crucial role in target identification 105 and verification, 106 new drug screening, 107 and optimization, 108 as well as predictive modeling in drug design, 109 thereby fostering innovation and breakthroughs in the field of drug research and development.
Challenges and future directions
With the increasing application of ML in managing chronic diseases such as CVD and diabetes, significant progress is observed in current research, particularly in the development of risk prediction, personalized treatment, and real-time monitoring systems. However, despite the initial verification of these technologies’ potential, many challenges remain that must be addressed to promote their large-scale clinical application. The following discusses the key challenges facing this field and proposes possible future directions for development.
Data privacy and security issues
With the widespread use of the IoT and wearable devices, real-time health data from patients are continuously collected and transmitted to ML models in the cloud for processing. 110 However, such large-scale data transmission inevitably raises concerns regarding data privacy and security. 111 Protecting patients’ sensitive personal health information and ensuring data processing and analysis while maintaining privacy are critical challenges that need to be resolved in the future. Researchers have proposed techniques such as federated learning, which allows learning from distributed data without uploading it, effectively safeguarding data privacy.86,112 For example, Sheller et al. 113 demonstrate how federated learning can be applied to predict multicenter CVD, addressing privacy concerns related to data sharing across institutions while enhancing model ACC.
Beyond technical solutions, the implementation of ML in healthcare must comply with stringent regulatory frameworks such as the General Data Protection Regulation 114 in the EU and the Health Insurance Portability and Accountability Act 115 in the United States. These regulations impose requirements on data anonymization, patient consent, and cross-border data transfer, which may limit the scope of data available for model training. For example, Health Insurance Portability and Accountability Act’s “minimum necessary” rule restricts data sharing to only what is essential for a specific purpose, potentially hindering the aggregation of large-scale datasets. 116 Future research should explore regulatory-compliant ML architectures (e.g., differential privacy-enhanced federated learning) to align technical advancements with legal constraints.
Model interpretability and clinical application
Despite demonstrating robust predictive performance in disease management, complex ML models face significant barriers to clinical adoption, primarily stemming from their inherent “blackbox” nature.94,117 Clinicians frequently exhibit skepticism toward model predictions that lack transparent justification, particularly when these outputs conflict with professional judgment—a phenomenon well documented by studies showing elevated rejection rates of AI systems when explanatory support is absent.118–120 This distrust is further compounded by medicolegal concerns, as opaque decision-making processes complicate error attribution in clinical settings.121,122
Implementation challenges at the institutional level present additional limitations. Substantial infrastructure investments and ongoing maintenance costs (including model updates and EHR integration) create financial barriers to adoption. 123 Furthermore, most existing clinical workflows lack standardized data input procedures required by AI models, necessitating additional manual operations that generate user resistance. 124 Additionally, representational biases in training data may compromise model generalizability across diverse populations, raising concerns about reliability. 125
Multiple strategies are being developed to overcome these challenges. Technical innovations such as explainable AI methods (e.g., SHapley Additive exPlanations 126 and Local Interpretable Model-agnostic Explanations 127 ) provide decision pathway visualizations, with Miller 128 demonstrating improved trust through model-agnostic interpretability frameworks. System-level interventions include Fast Healthcare Interoperability Resources-compliant interfaces that seamlessly embed predictive outputs with explanatory elements into EHR dashboards, minimizing workflow disruption. 129 Meanwhile, some scholars argue that rigorous model validation (encompassing internal/external performance assessments and clinical utility trials) may ensure safe deployment even without universal interpretability methods. 130 Regulatory initiatives like the FDA's software as a medical device program further facilitate implementation through standardized evaluation benchmarks. 131 Nevertheless, persistent limitations—particularly heterogeneous hospital Information Technology infrastructures 132 and inconsistent interpretability standards 133 —continue to constrain widespread clinical implementation.
Overfitting and generalization challenges
Despite many chronic disease management models demonstrating high ACC and SEN in internal validation, their performance often significantly declines when applied to external independent cohorts or real-world clinical settings. 134 On one hand, when the feature dimension approaches or exceeds the sample size, complex models tend to “memorize” the noise in the training data rather than capturing underlying pathological patterns. 135 On the other hand, single-center or small-scale cohorts, which lack diversity in terms of populations, equipment, and clinical workflows, fail to encompass regional and temporal differences in clinical practices. 136 More complicating is the occurrence of concept drift (i.e., changes in the data generation process) as clinical standards are updated, monitoring devices are iterated, and patient behaviors and environmental factors change, further accelerating model degradation. 137 Additionally, the introduction of multisource heterogeneous data, such as genomics, metabolomics, and imaging, although enriching disease characterization, brings new risks of overfitting. Variability across data sources in terms of collection frequency, storage formats, and quality standards leads to the accumulation of redundant information and noise. Simple concatenation or fusion of these data is not only ineffective in eliminating systematic bias but also exacerbates overfitting in the feature space, thereby impeding the model's ability to generalize to new cohorts or real-world scenarios.7,138
To enhance the robustness and generalizability of models, future research should rigorously employ nested cross-validation, temporal stratified splits (e.g., forward validation), and external hold-out test sets combined with L1/L2 regularization, early stopping, and domain-specific data augmentation techniques. Additionally, exploring domain adaptation and transfer learning methods can help address distributional differences across institutions or populations. Finally, adherence to the Transparent Reporting of a Multivariable Prediction Model for Individual Prognosis Or Diagnosis framework for transparent reporting and the use of the PROBAST tool to assess bias risk are essential to ensuring the safety of clinical model implementation. 139
Data bias and model fairness
The application of ML models in chronic disease management has revealed inherent structural limitations within the current data ecosystem, particularly in terms of data sources, representation, and fairness.
A comprehensive review of over 7,000 clinical AI articles indicates a significant regional imbalance in data sources: 40.8% of datasets originate from the United States, 13.7% from China, and nearly all top-10 databases and authors’ nationalities are concentrated in high-income countries. 140 This imbalance in data representation directly contributes to performance disparities in clinical applications. For instance, the Framingham Risk Score and the Revised Pooled Cohort Equations, developed using data from Western high-income countries, show notable predictive biases when applied to Asian populations. In a multiethnic population in Malaysia, cardiovascular risk for males was overestimated by 298%–733%, and for females, the risk was overestimated by 146%–1430%. 141 This bias, arising from insufficient regional representation in training data, not only highlights fairness issues in ML models across different populations but also has the potential to exacerbate inequalities in healthcare, particularly in underrepresented groups.
Furthermore, current ML methods often overlook critical social determinants of health, such as environmental exposures, disparities in healthcare access, and the impact of cultural influences on health behaviors. These factors significantly affect the progression of chronic diseases. 142 For example, socioeconomic status and racial background may have different impacts on disease development across various populations. However, many existing models fail to incorporate these factors, leading to misjudgments for certai-n groups. The U.S. FDA's guidance on algorithmic bias emphasizes how omitted variable bias (such as the exclusion of socioeconomic indicators) in training data can result in clinically significant predictive errors in marginalized populations. 143
This issue is further complicated by inherent sampling biases in digital health technologies. For example, due to significant differences in the adoption rates of wearable devices across populations, activity data systematically underrepresents older adults and low-income groups, distorting group health inferences based on such data.144,145
To address these challenges, regulatory bodies have begun to update policy frameworks. The EU's Artificial Intelligence Act mandates rigorous fairness evaluations for high-risk medical algorithms, requiring developers to demonstrate that their systems do not exhibit discriminatory biases across different populations. 146 The NIH's “All of Us” research program aims to build inclusive health datasets by focusing on historically underrepresented groups. 147 These policy developments align closely with emerging technological solutions. For instance, causal modeling methods can explicitly adjust for socioeconomic confounders (e.g., income and race) that impact algorithmic fairness 148 ; and federated learning frameworks support model optimization across populations without the need for centralized data sharing, thereby preserving privacy. 149
Looking forward, there is a need for a deeper understanding of model generalization, taking into account both technical and sociotechnical factors. Longitudinal studies should be conducted to assess model performance across different healthcare environments, and standardized bias detection frameworks (such as the AI system bias evaluation methods outlined in ISO/IEC TR 24027:2021) should be adopted. 150 Additionally, algorithm developers must collaborate with clinical experts to redesign predictive goals, focusing on “health needs” rather than “medical costs,” and incorporating multidimensional health indicators (e.g., chronic disease burden, biomarker severity) to eliminate racial bias caused by cost disparities. 125
Advantages and limitations
To the best of our knowledge, this study is the first to comprehensively analyze ML in the field of chronic disease management using bibliometrics. The strategy of integrating multiple tools not only improves the ACC of the analysis but also expands the dimensions of the comprehensive analysis. The current state of the field and research hotspots are introduced from multiple perspectives, and, for the first time, text mining methods are employed to quantify the size of chronic disease types and algorithms and the connections between them.
However, this study has limitations. While using only the Web of Science Core Collection helped maintain methodological consistency and reduce potential human error in database management, this approach carries inherent limitations. Most notably, it may introduce selection bias by excluding relevant studies indexed exclusively in other databases like Scopus or PubMed. Comparative analyses suggest WoS covers approximately 80%–90% of high-impact literature in this field, but important regional publications or recent preprints might be underrepresented. Future studies could benefit from a multidatabase approach to enhance comprehensiveness while developing standardized protocols to mitigate integration challenges. The study is limited to journal articles written in English, as articles in other languages may provide additional insights. Future studies should expand the database using programming languages such as Python or R. Additionally, the quality and bias of the included studies were not assessed, which may have affected the described trends due to low-quality and biased studies. Future efforts should incorporate a detailed quality assessment of the studies. Although bibliometric methods are powerful in visualizing research trends, they are also subject to inherent biases, such as cocitation and coword analysis, which may overemphasize highly influential or frequently cited studies while potentially overlooking niche or emerging topics. Furthermore, reliance on quantitative metrics, such as citation counts, may not fully capture the qualitative impact of research, as citation frequency does not distinguish between positive and critical citations. To address these limitations and provide a more nuanced understanding of research trends, future research could adopt a mixed-methods approach, combining bibliometrics with qualitative analysis.
Conclusion
This study comprehensively explores global research trends and cutting-edge developments in ML for chronic disease management through systematic bibliometric analysis, revealing the significant potential of this technology in healthcare. The results concludes that ML shows significant potential for chronic disease management, especially in disease risk prediction, personalized treatment plans, and multimodal data integration. The increasing use of complex algorithms like deep learning emphasizes ML's central role in personalized medicine. However, challenges remain, including the need for model interpretability and data privacy protections, particularly with the rise of IoT applications. Cross-national collaborations are essential to standardize medical data globally, improving model generalizability across diverse populations. Future research should focus on developing efficient, real-time ML models to support personalized, intelligent medical interventions and enhance chronic disease management outcomes. As technology advances, ML is poised to transform chronic disease management and drive a new era in healthcare personalization.
Supplemental Material
sj-docx-1-dhj-10.1177_20552076251361614 - Supplemental material for Mapping the landscape of machine learning in chronic disease management: A comprehensive bibliometric study
Supplemental material, sj-docx-1-dhj-10.1177_20552076251361614 for Mapping the landscape of machine learning in chronic disease management: A comprehensive bibliometric study by Shiying Shen, Wenhao Qi, Sixie Li, Jianwen Zeng, Xin Liu, Xiaohong Zhu, Chaoqun Dong, BinWang, Qian Xu and Shihua Cao in DIGITAL HEALTH
Supplemental Material
sj-docx-2-dhj-10.1177_20552076251361614 - Supplemental material for Mapping the landscape of machine learning in chronic disease management: A comprehensive bibliometric study
Supplemental material, sj-docx-2-dhj-10.1177_20552076251361614 for Mapping the landscape of machine learning in chronic disease management: A comprehensive bibliometric study by Shiying Shen, Wenhao Qi, Sixie Li, Jianwen Zeng, Xin Liu, Xiaohong Zhu, Chaoqun Dong, BinWang, Qian Xu and Shihua Cao in DIGITAL HEALTH
Supplemental Material
sj-pdf-3-dhj-10.1177_20552076251361614 - Supplemental material for Mapping the landscape of machine learning in chronic disease management: A comprehensive bibliometric study
Supplemental material, sj-pdf-3-dhj-10.1177_20552076251361614 for Mapping the landscape of machine learning in chronic disease management: A comprehensive bibliometric study by Shiying Shen, Wenhao Qi, Sixie Li, Jianwen Zeng, Xin Liu, Xiaohong Zhu, Chaoqun Dong, BinWang, Qian Xu and Shihua Cao in DIGITAL HEALTH
Footnotes
ORCID iDs
Contributorship
SS conceptualized the study, set the research methodology, performed data visualization, and edited the article. WQ conceptualized the study and revised the article. XL, JW, and SL organized the data and set the research methodology. SC conceptualized the study, reviewed and edited the article, acquired funding, managed the project, and performed formal analysis. XZ, BW, QX, and CD conducted formal analysis and supervision.
Funding
The authors disclosed receipt of the following financial support for the research, authorship, and/or publication of this article: This study was supported by the Zhejiang Province Traditional Chinese Medicine Science and Technology Project (2023ZF134), Higher Education Research Project of Zhejiang Higher Education Society (KT2025040), and the Engineering Research Center of Mobile Health Management System, Ministry of Education (2024-3-9).
Declaration of conflicting interests
The authors declared no potential conflicts of interest with respect to the research, authorship, and/or publication of this article.
Data availability
The data sets generated and analyzed during this study are available from the corresponding author on reasonable request.
Guarantor
All claims expressed in this article are solely those of the authors and do not necessarily represent those of their affiliated organizations, or those of the publisher, the editors, and the reviewers. Any product that may be evaluated in this article, or claim that may be made by its manufacturer, is not guaranteed or endorsed by the publisher.
Supplementary material
Supplemental material for this article is available online.
References
Supplementary Material
Please find the following supplemental material available below.
For Open Access articles published under a Creative Commons License, all supplemental material carries the same license as the article it is associated with.
For non-Open Access articles published, all supplemental material carries a non-exclusive license, and permission requests for re-use of supplemental material or any part of supplemental material shall be sent directly to the copyright owner as specified in the copyright notice associated with the article.