
Abstract
Objectives
Medication wastage is a critical issue impacting the sustainability of subsidised healthcare systems in Southeast Asia due to financial and resource constraints. This study aimed to develop a machine learning (ML) model to predict medication wastage by analysing patient demographics, health conditions and beliefs about medicines, using Malaysia as a case study.
Methods
A cross-sectional survey was conducted involving 734 patients across six public healthcare facilities in Malaysia. Data on demographics, medication history and beliefs about medicines were collected using validated questionnaires. Multiple ML regression models were evaluated to predict medication wastage, with performance assessed based on root mean squared error (RMSE).
Results
The XGBoost model achieved the best performance with the lowest RMSE of 4.67, outperforming other models (RMSE range:4.68–5.10). It also performed best using only seven features selected by sequential backward elimination method using LR, making it practical for clinical implementation. Key predictors of medication wastage included beliefs about medicines, age, ethnicity, region and monthly income.
Conclusion
This study is the first to apply ML to address medication wastage in a Southeast Asian context, filling a critical research gap. The proposed model provides a foundation for developing targeted interventions to reduce medication wastage and supports policymakers and healthcare providers in optimising the allocation of subsidised medications. The insights are broadly applicable to other countries with similar healthcare resource challenges.
Keywords
Introduction
Healthcare systems across Southeast Asia, including Malaysia, Thailand, Indonesia and Singapore, are largely supported by the government, providing essential services and medications through a combination of subsidisation, public funding, national insurance schemes and social safety nets. In recent years, governments in these countries have increased healthcare budgets to ensure the availability of critical medical supplies and services.1–4 For instance, Malaysia allocates 82% of public healthcare expenditure to public health services, 5 while Thailand's Universal Coverage Scheme 6 is largely government-subsidised, providing affordable care through public funding. Indonesia's Jaminan Kesehatan Nasional 7 is partially subsidised, with the government covering premiums for low-income groups, while others contribute based on income. While in Singapore, MediShield is partially subsidised and Medifund provides additional aid for those in need, while Medisave is not subsidised, as individuals are required to save for their own healthcare. 8 Programmes aimed at reducing medication wastage, such as Malaysia's ‘Return Your Medicines’ initiative, highlight the region's focus on minimising healthcare resource depletion. Cardiovascular and endocrine medications, such as those for hypertension, heart failure, diabetes and thyroid disorders were among the most commonly returned medications leading to significant costs. 9 In Malaysia alone, RM2 million was spent between 2014 and 2016 to destroy returned pharmaceuticals, illustrating the financial and health implications of medication wastage. 10
Medication wastage – defined as the improper disposal of unused, expired, or contaminated pharmaceutical products – is a growing concern in these subsidised healthcare systems. 11 Factors contributing to wastage include financial barriers, demographic characteristics and doubts about the efficacy of prescribed medications.12–14 Financial limitations often prevent consistent prescription refills, while scepticism about medication effectiveness leads to non-adherence and the accumulation of unused drugs. Tools such as the Beliefs about Medicines Questionnaire (BMQ) provide valuable insights into patients’ belief towards their medications.15,16
Despite its importance, research on the relationship between patients’ beliefs and medication wastage in Southeast Asia remains scarce. Conventional studies, such as West et al., 17 have used traditional statistical methods to analyse healthcare beliefs and medication, identifying health locus of control as a significant predictor of adherence and wastage. Similarly, Mouloudj et al. 18 emphasised the importance of environmental awareness and ethical commitment in reducing drug wastage. However, these studies have not explored the potential of advanced data analytics to predict medication wastage based on demographic and attitudinal factors.
The advent of artificial intelligence (AI) and machine learning (ML) has opened new avenues for addressing complex healthcare challenges, including medication wastage. Studies like Golbaz et al. 19 have demonstrated the efficacy of ML models, such as Kernel-based and Neuron-based models, in predicting hospital solid waste. Similarly, Go 20 applied Random forest (RF) models to predict rheumatoid arthritis medication wastage, achieving moderate levels of sensitivity and specificity. Despite the growing use of ML in healthcare, no studies have focused on predicting medication wastage in Southeast Asia such as Malaysia, Thailand, Indonesia, or Singapore by incorporating patients’ beliefs and demographic variables.
This research is the first to apply ML models to predict medication wastage by combining patient beliefs and demographic factors, addressing a gap in Southeast Asian healthcare research. By leveraging predictive modelling, this research aims to uncover key factors contributing to the wastage of subsidised medications, particularly in Malaysia, but with implications for the broader Southeast Asian region. Identifying high-risk groups will enable healthcare providers and policymakers to develop targeted interventions that minimise wastage, optimise resource utilisation and improve patient outcomes. 21 This research contributes not only to the sustainability of healthcare systems in Malaysia but also to improving healthcare efficiency across other countries with subsidised medication programmes, such as Thailand, Indonesia and Singapore. 22
Methods
Study participants
This study involved 750 patients in all. The inclusion criteria for this study were patients aged 18 years and above who were proficient in both Malay and English, receiving subsidised medications from Ministry of Health hospitals or health clinics and diagnosed with at least one of the following chronic conditions: hypertension, diabetes mellitus, or dyslipidaemia. On the other hand, the exclusion criteria for this study were as follows: patients who had received subsidised medications but had missed appointments and medication refills for over a year were excluded. Additionally, incomplete survey responses were omitted, as missing answers – particularly to key questions – could compromise data quality and lead to inaccurate conclusions.
Study design and location
This cross-sectional survey was conducted at public healthcare facilities involving six different locations in Malaysia: northern, central, southern and east of Peninsular Malaysia including Sabah and Sarawak. These sites were randomly selected and approached by the researcher for consent to participate in the study and to represent the overall region in Malaysia.
Sample size
The sample size was calculated using the following formula:
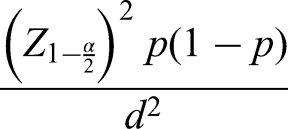
Since the population of patients receiving subsidised drugs is unknown, this formula is used assuming a standard normal deviation at a 95% confidence level, a response rate at 50% and a confidence interval at 0.05.
Z = standard normal deviation at a 95% confidence level;
p = percentage of respondents who selected an option or provided feedback;
c = confidence interval.
In this study, the sample size was calculated using the standard formula for estimating proportions in cross-sectional studies, which is appropriate when employing simple random sampling and when the total population size is unknown or difficult to determine precisely. This formula, as recommended by Pourhoseingholi et al., 23 is suitable for prevalence studies and allows researchers to estimate the minimum number of respondents required to achieve statistically reliable results. Given that the exact number of patients receiving subsidised medications nationwide was not available, a conservative prevalence estimate of 50% (p = .5) was chosen, which maximises the required sample size and ensures adequate power for detecting population-level patterns. The confidence level was set at 95% (Z = 1.96) with a margin of error of 5% (d = .05), resulting in a calculated minimum sample size of 385 participants. To account for potential non-responses or incomplete data, this figure was doubled to 770, ensuring that the final sample size would remain sufficient for meaningful analysis even with potential data loss. This approach aligns with best practices in survey-based medical research and supports the robustness of findings derived from simple random sampling across a diverse national setting.
Study instrument
The survey consists of three sections. Section A consists of respondent's demographic characteristics including their age, gender, ethnicity, marital status, education, region of residence and monthly income. The data can reveal respondents’ traits and variety and how they may affect medicine use and waste. The respondents’ medication consumption duration in years can reveal their treatment length and familiarity with their drugs. This part collects patient data on chronic diseases with their total number of ailments.
Section B assesses patient medication beliefs using the Belief about Medicines (BMQ). 15 BMQ uses two criteria to assess patients’ general and specific beliefs about subsidised medications, which are further categorised into BMQ Specific Necessity, BMQ Specific Concerns, BMQ General Harm and BMQ General Overuse. Five items addressed BMQ Specific Necessity, five addressed BMQ Specific Concerns, four addressed BMQ General Harm and four addressed BMQ General Overuse beliefs. Section items were rated on a 5-point Likert scale from 1 to 5. Higher scores in BMQ Specific Concern indicate greater concerns about the medication, including side effects and long-term impacts, while higher scores in BMQ Specific Necessity indicate a strong conviction in its relevance. A higher score for BMQ General Overuse suggests that the person believes medications have been abused overall, while a higher score for BMQ General Harm implies that medicines are generally harmful.
The study's output variable, patients’ attitudes and practices on medication wastage using the validated Return and Disposal of Unneeded Medications (ReDiUM) questionnaire in Malaysia, is found in Section C of the survey. 24 This instrument measures the likelihood of patients receiving subsidised medications going to waste, consisting of two sections – one on attitude and one on practice-each containing 10 items. The items were statements that the respondents had to rate on a 5-point Likert-type scale, indicating their level of agreement or disagreement. The scale ranged from 1, meaning ‘strongly disagree’, to 5, meaning ‘strongly agree’. The scores for each item were added up to obtain a total score for each section, reflecting the respondent's attitude and practice towards returning and disposing of unused medications. The total score of the questions from ReDiUM range from 7 to 35. Score 7 indicates that the patients’ most likely waste their medications and score 35 indicates the least likely. The overall questionnaire used for this study can be found in the Supplemental Material.
Data collection
This study has obtained approval for ethics from the Universiti Kebangsaan Malaysia Centre for Research and Instrumentation Management under the permission code UKM PPI/111/8/JEP-2021-842 and Medical Research & Ethics Committee under the Ministry of Health Malaysia, NMRR ID NMRR-21-1747-61023 (IIR). Potential respondents at the outpatient pharmacy at the above settings were invited to participate in this study. The researcher approached the patients or the caregiver at the outpatient pharmacy and provided an explanation of the study purpose based on the patient information leaflet. If the patient agrees to participate, they will be requested to sign the informed consent document. Patients aged 18 years above, receiving subsidised medications for chronic disease and able to read and answer the questions were included in this study. The survey, which took place from 1 February 2022 to 20 October 2022, was conducted during this period.
Data pre-processing
The data pre-processing involved removing missing values, filtering out non-sensical ‘zero’ inputs and grouping patient monthly income, resulting in 734 samples (<3% removed). The data was split into 75% training and 25% testing before pre-processing to prevent data leakage as seen in Figure 1 below. A 10-fold cross-validation was used for hyperparameter tuning to improve model accuracy, generalisation and reduce overfitting risks (see Supplemental Table S1). Continuous variables, such as age, duration of medication intake, BMQ General Harm, BMQ General Overuse, BMQ Specific Necessity and BMQ Specific Concern were normalised to ensure consistent value ranges across the dataset.
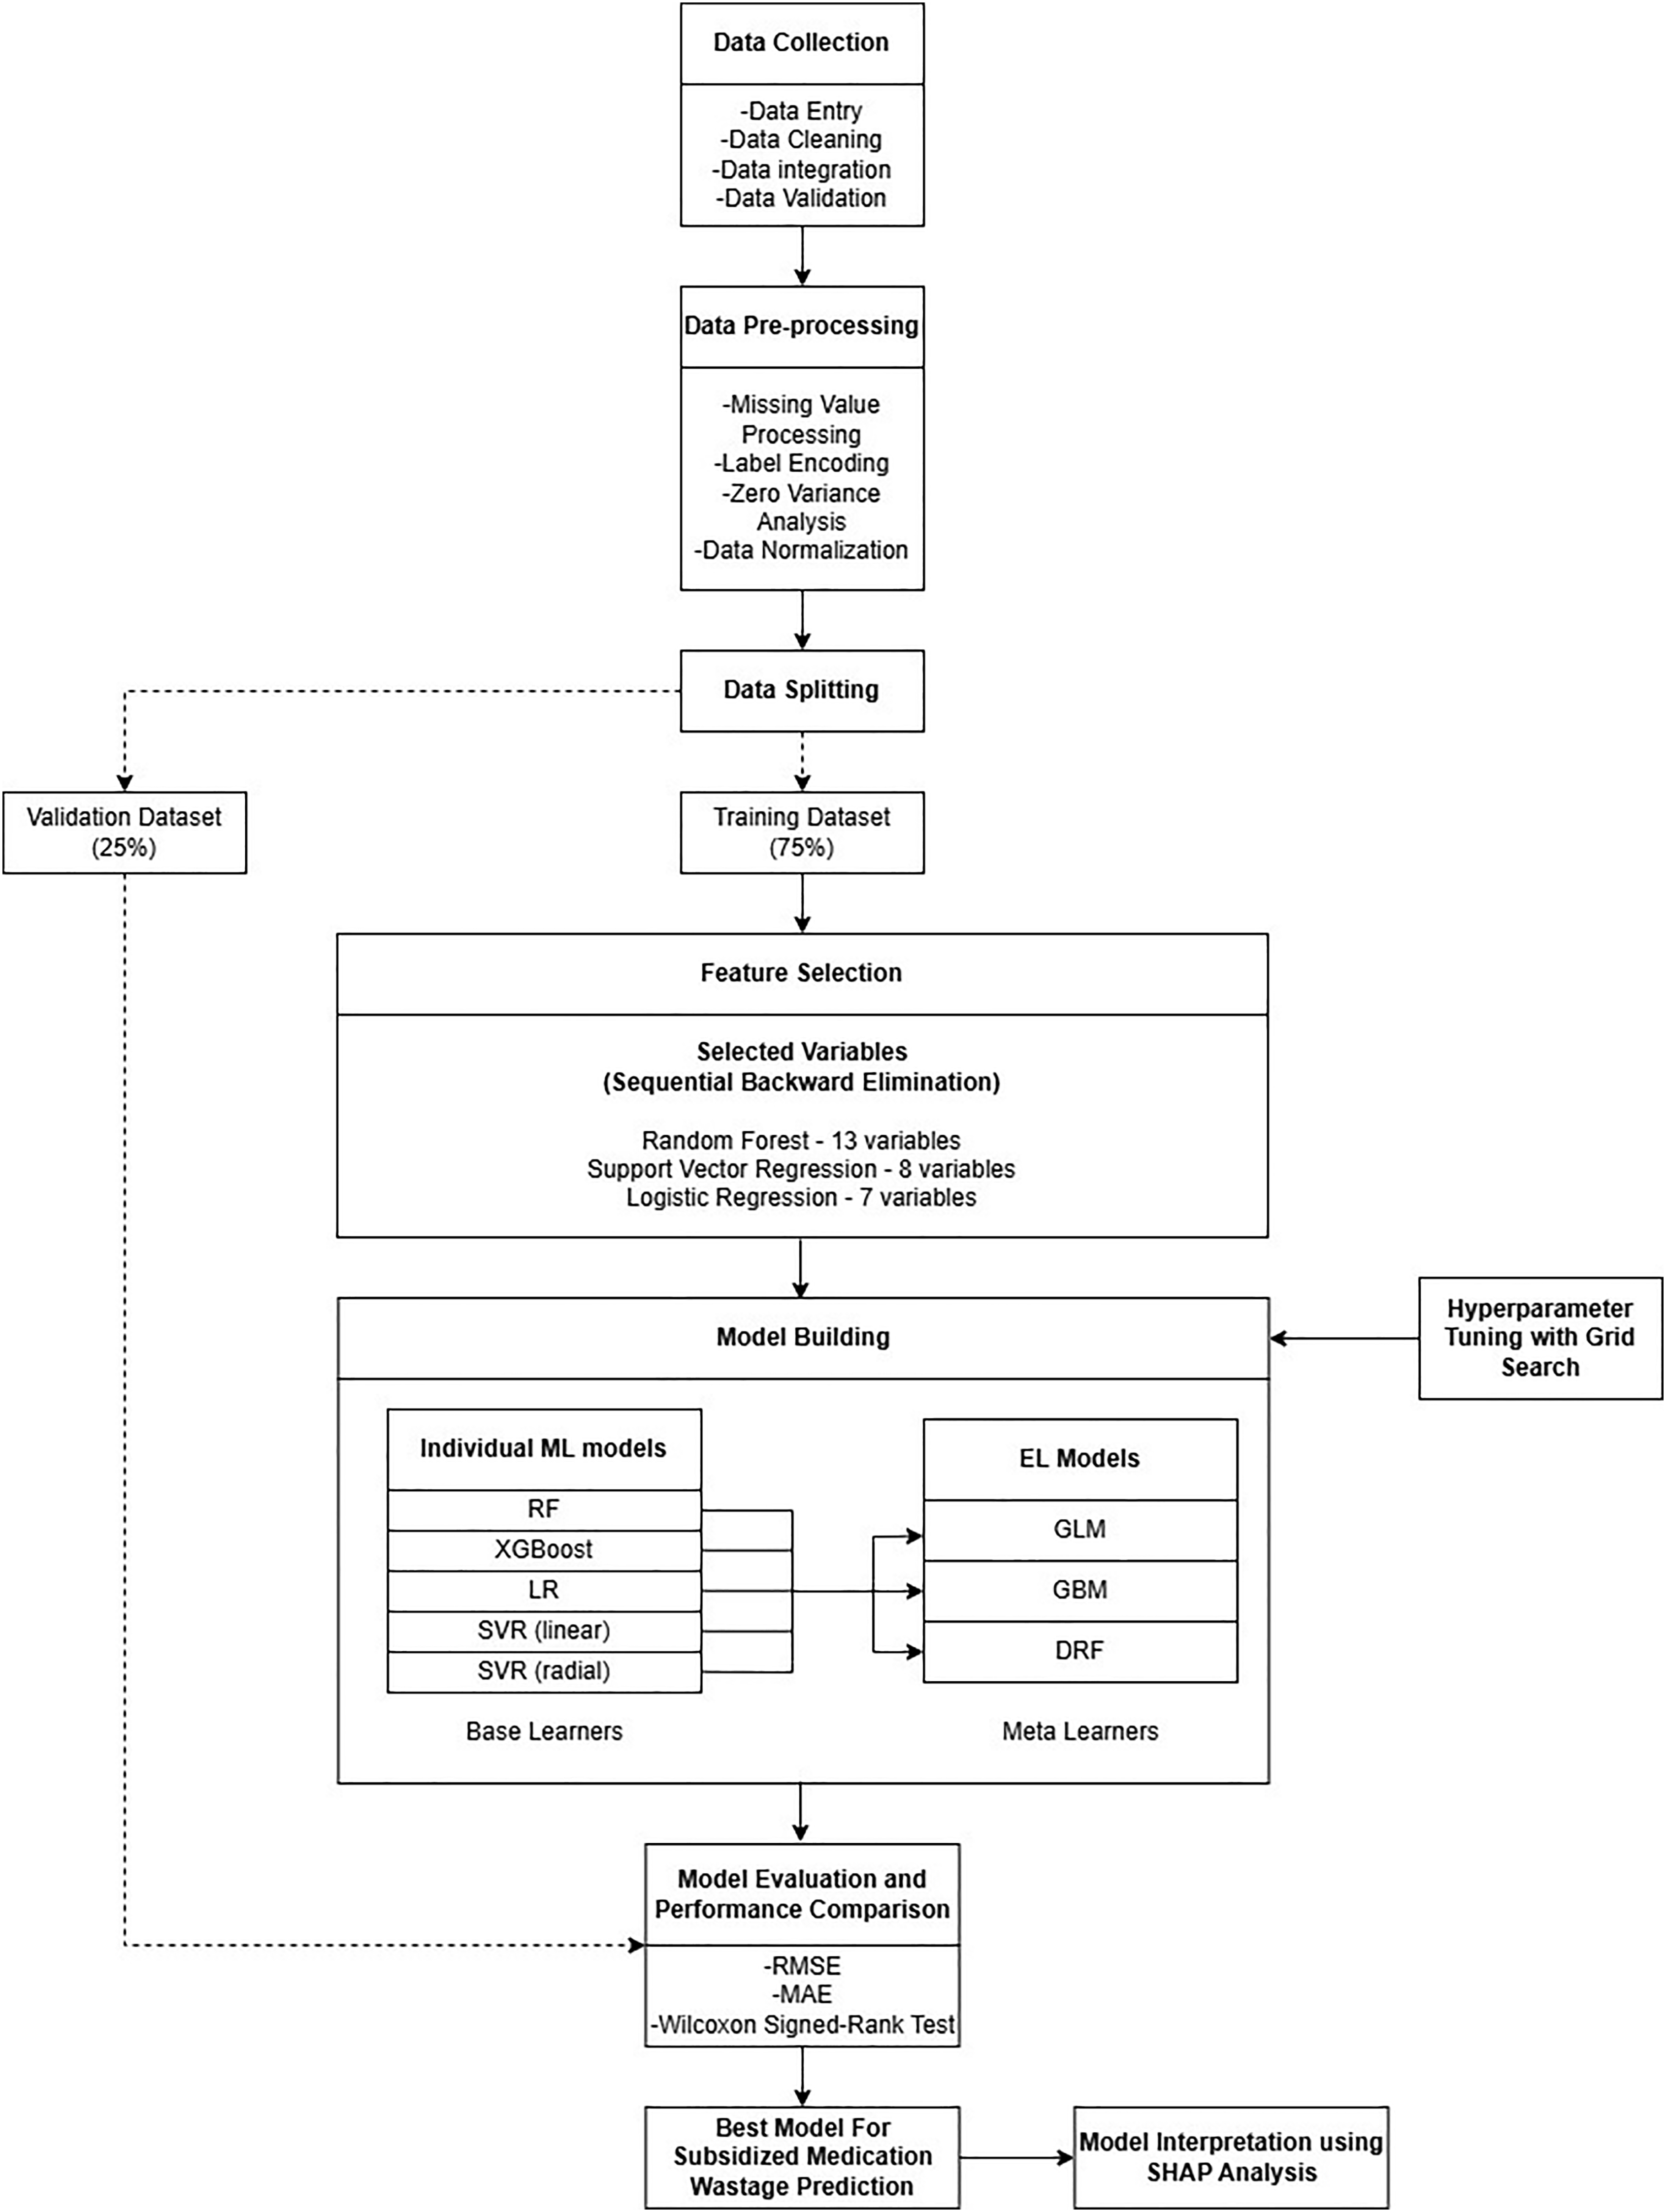
The overall flowchart of the predictive model development.
Feature selection
Feature selection reduces data dimensionality and complexity, improving model performance and interpretability. Its benefits include fewer variables, improved accuracy, reduced overfitting, easier model interpretation and lower storage needs. 25 In this study, sequential backward elimination method was used, which starts with all variables and sequentially removes those that do not significantly impact the model performance and repeating this process until no further features can be deleted without affecting the model fit. 26 From 17 initial variables, this method helps remove irrelevant or redundant features, enhancing model efficiency.
The algorithms used for sequential backward elimination in this study were RF, linear regression (LR) and support vector regression (SVR). First step is to train the models on the data with all the variables and obtain the feature importance scores. Then, the variables were ranked according to their importance scores. The variable with the highest RMSE value was eliminated. After elimination, the training process was repeated with only the remaining variables and the performance was evaluated using RMSE. This process was continued until there is no significant improvement in the performance compared to the previous iteration. Then, the remaining variables were considered as the best features among all the features. The final selected features were also be used for model interpretation.
Model building
The ML and stacked ensemble learning models were developed using variables selected through sequential backward elimination. The ReDiUM score, a continuous measure from 7 to 35 indicating potential drug wastage, was analysed via regression. Supervised ML regression algorithms were used to build a prediction model with 17 input variables and the ReDiUM score as the target. To avoid overfitting during the model development process on the training set, 10-fold cross validation technique was implemented.
Machine learning models
The training process involved the utilisation of various ML regression methods, such as RF, 27 LR, 28 SVR of two types (linear and radial Kernel), 29 and XGBoost 30 in the R programming language. Algorithms employ numerous techniques to acquire knowledge about the association between the input variables and output variables.
RF is an ensemble regression method that constructs multiple decision trees and aggregates their outputs to improve predictive accuracy and robustness. 27 At each node of a tree, a random subset of predictor variables (denoted as mtry) is selected to determine the best split, introducing diversity among the trees. In regression tasks, RF predicts by averaging the outputs of all individual trees. The quality of the model is evaluated using the root mean square error (RMSE) and an internal validation method called Out-of-Bag (OOB) error provides an unbiased estimate of model performance. The OOB error is computed by predicting each observation using only the trees that did not include it in their bootstrap sample. In this study, the RF algorithm was implemented following Breiman, 27 with optimisation of key parameters such as the number of trees (ntree) and the number of predictors at each split (mtry) to achieve the best regression performance.
SVR is a non-parametric ML technique adapted from support vector machines (SVMs) but tailored for continuous (numerical) outcome variables instead of categorical ones. Like its classification counterpart, SVR formulates the learning task as a convex optimisation problem that aims to find a function with minimal complexity (flatness), while allowing a certain margin of tolerance (v) for prediction errors. SVR seeks a regression function f(x) that deviates from the actual target values y by no more than ε for all training data and penalises deviations beyond this threshold using a regularisation (cost) parameter C. This helps balance the trade-off between model complexity and prediction accuracy, preventing overfitting. In this study, the cost parameter was set to C = 1.

where
In this study, two types of kernel functions were applied:
Linear kernel:

Suitable when the relationship between input and output is approximately linear. It is simple, fast and interpretable.
Radial kernel:

This kernel maps input data into a higher-dimensional space and can capture non-linear relationships, making it more flexible and powerful for complex datasets.
Both kernel types were implemented to compare performance. The SVR with RBF kernel was particularly emphasised due to its ability to model non-linear patterns in the data. Key hyperparameters, including C, ε and the kernel-specific parameter γ, were tuned to optimise model performance. Model evaluation was conducted using standard regression metrics, particularly the RMSE. This dual-kernel approach allowed the study to investigate how kernel choice influences the prediction accuracy and generalisability of SVR in modelling numerical outcomes.
XGBoost is a powerful and efficient ensemble learning algorithm based on gradient boosting, widely used for both classification and regression tasks. For regression, XGBoost builds an additive model by combining multiple weak learners (usually decision trees), where each new tree is trained to predict the residuals (errors) of the previous trees. The model is optimised using a regularised objective function that balances training loss and model complexity to prevent overfitting. The objective function for XGBoost regression is:

where l is the loss function [typically squared error (y‒ŷ)2],
LR is a fundamental and widely used supervised learning algorithm for regression tasks, where the target variable is continuous and numerical. It models the linear relationship between one dependent variable and one or more independent variables by fitting a straight line (or hyperplane in multivariate cases) through the data. The core assumption of LR is that the relationship between the predictors and the response is linear. The model aims to find the best-fitting line that minimises the difference between the actual and predicted values, using least squares minimisation.
The general form of a LR model is:

Ensemble learning models
Ensemble learning (EL) was introduced with the aim to outperform the traditional ML to obtain a stronger model that its constituents. EL improves results by combining multiple models to reduce variance, bias and overfitting. Its success depends on factors like how baseline models are trained and combined. 31 Baseline models should be diverse and accurate, making different errors with low overall error rates. The combination method must fit the problem, such as using majority voting for classification or averaging for regression. The base model may use any of the ML algorithms. Common EL methods include bagging, boosting and stacking.
In this study, stacking was used as an ensemble method to integrate predictions from multiple baseline models into a meta-model. 32 Unlike bagging in RF or boosting in XGBoost, stacking can combine different algorithms to enhance generalisation accuracy. In this study, the five previously employed ML algorithms served as base learners and their predictions were aggregated to form the meta-model. The outputs of the base models became inputs for the meta-model, which can be probabilities or class labels. 31 Three meta-learners were used: generalised linear model (GLM), 33 gradient boosting machine (GBM) 34 and distributed random forest (DRF). 27
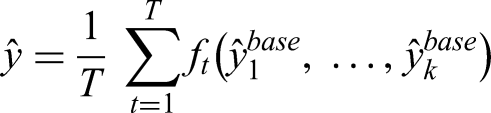
In the first stacking ensemble model, a GLM was used as the meta-learner to combine the predictions of the five base models. GLM extends traditional LR by allowing the response variable to have a non-normal distribution and by linking the predictors to the response through a suitable link function. For regression tasks, the identity link is commonly used. The meta-model in this stacking framework learns to optimally weight the predictions from the base learners, reducing individual biases and variances. The final prediction ŷ can be represented as:

The second stacking model used a GBM as the meta-learner. GBM is an advanced boosting algorithm that builds a sequence of decision trees where each successive tree is trained to correct the residuals of the previous trees. When applied as a meta-model in stacking, GBM effectively captures complex, non-linear relationships between the base learners’ predictions and the true outcome. The training objective includes a loss function (typically squared error for regression) and a regularisation term to prevent overfitting. The output prediction of the GBM stacking ensemble is:

The third ensemble applied DRF as the meta-learner. DRF is a parallelised and scalable version of RF, ideal for handling large datasets and producing robust predictions. As a meta-model in the stacking framework, DRF ingests the outputs from the five diverse base models and learns an ensemble of decision trees to aggregate them effectively. It combines bootstrap aggregation and random feature selection to reduce overfitting and variance. The final prediction is obtained by averaging the predictions of all trees in the forest, each trained on the meta-feature space formed by the base models’ outputs. Mathematically, the prediction can be expressed as:
Performance evaluation
The ML models were validated using mean absolute error (MAE), RMSE and the Wilcoxon signed-rank test.
The MAE measures the average absolute difference between predicted and actual values, with lower values indicating a better fit. It is widely used as a performance metric in ML model evaluation due to its simplicity and interpretability.
35
The MAE provides a clear indication of the average magnitude of errors in a set of predictions, making it especially useful when all individual prediction errors are to be treated equally. The equation for MAE is:

On the other hand, RMSE is a widely used metric to measure the average magnitude of the error between predicted and observed values. It calculates the square root of the average of squared differences (residuals) between predictions and actual outcomes. This means that RMSE not only captures the average error but also gives greater weight to larger errors, making it more sensitive to outliers than the MAE. Because of this sensitivity, RMSE is particularly useful when large errors are especially undesirable or impactful and thus is often considered more informative than MAE in evaluating model performance when the goal is to penalise large deviations more severely.
35
A lower RMSE indicates a better fit of the model to the data, implying more accurate and reliable predictions. The formula for RMSE is:

The Wilcoxon Signed-Rank test is a non-parametric statistical method used to determine whether there is a significant difference between paired or matched samples. It is often preferred over the paired t-test when the assumption of normality in the distribution of differences is not met. This test evaluates the differences between paired observations by ranking the absolute values of these differences (assigning average ranks in case of ties) and then comparing the sums of the ranks for the positive and negative differences.
36
The formula for the Wilcoxon signed-rank test is as follows:

Model interpretation
Complex and opaque, ML models are termed ‘black boxes’ because they are hard to understand. This study used SHapley Additive exPlanations (SHAP) to comprehend how the model predicts and how each variable affects them instead of trying to understand its logic. SHAP values each variable according on its contribution to prediction, considering interactions with other variables. 37 The study employed summary and feature importance SHAP graphs. SHAP feature importance measures how much each variable contributes to ML model prediction based on its SHAP values. Variables were ranked by relevance and displayed as horizontal bars in decreasing order. Like a beeswarm plot, the SHAP summary plot combines feature importance and consequences. It is a vital tool for visualising how each variable affects model output across dataset observations. The graph shows SHAP values for each characteristic along the horizontal axis and ranks variables by relevance along the vertical. SHAP values measure each variable's positive or negative prediction impact. A positive SHAP number increases prediction, while a negative one decreases it. In contrast, a zero SHAP score indicates forecast insignificance. Dot colour indicates original variable values, with blue representing lower values and pink higher ones.
Statistical analysis
The results were expressed as mean and SD for continuous variables and as frequencies for categorical variables as shown in Table 1 for the statistical analysis of the data. For the comparison between the actual and predicted values of each of the model, the Wilcoxon signed-rank test was adopted.
Statistical analysis of variables.

The Wilcoxon signed-rank test 36 is a non-parametric alternative to the t-test. It compares two paired samples by ranking the absolute differences, then calculating the sum of the ranks for positive and negative differences. The Wilcoxon signed-rank test is suitable for this regression prediction model in ML as it assesses whether there is a significant difference between predicted and actual values without assuming a normal distribution, making it ideal for non-parametric data.
Additionally, a scatter plot was carried out to find the correlation of the best model, to find the correlation between the predicted values and the actual observed values. This visualisation helps assess the model's accuracy by showing how closely the predicted values align with the true values, indicating the model's ability to capture the underlying patterns in the data.
Also, the RMSE value of the best model were compared to the baseline RMSE values derived from the mean and median predictors. The purpose of these simple baseline models is to provide a benchmark. If the best model performs significantly better than these baselines, it suggests that the ML model is indeed identifying patterns in the data and offering value beyond the simplest predictions. 35 The difference in RMSE values provides evidence that the model's predictions are more accurate than just guessing the mean or median.
All the analysis from data pre-processing, feature selection, model building, statistical analysis and model explanation has been done in R Studio software.
Results
Table 1 presents summary statistics for the categorical and continuous variables used in this study. The measured variables were obtained from the questionnaire and divided into three categories: demographic characteristics of the patient, history of medication and disease and beliefs towards medications (BMQ).
Data are expressed as count (percentage), or mean ± standard deviation, as appropriate.
The data shown in Table 1 above indicates that a significant proportion of the participants are female, accounting for 58.86% of the overall sample. Additionally, it is noteworthy that the prevailing ethnic group among the participants is Malay, constituting 65.53% of the questioned populace. Furthermore, a substantial proportion of the participants are in a marital relationship, accounting for 66.35% of the total sample. Regarding the health state, it is evident that the participants generally indicate the presence of one or two separate illnesses (0.9). The majority of respondents report a medication intake period of up to seven years, as indicated above (SD = 7.1).
From Table 1, the participants exhibited an average score of 18.9 on the BMQ Specific Necessity scale, suggesting a moderate to high level of conviction regarding the necessity of the drug for their health condition. The participants in the study exhibited an average score of 15.4 on the BMQ Specific Concern scale, indicating a level of concern ranging from low to moderate regarding the potential adverse effects associated with the medicine. The participants exhibited a mean score of 12 on the BMQ General Overuse scale, indicating a diminished perception of doctors’ propensity for excessive medicine prescriptions. The participants obtained an average score of 9.7 on the BMQ General Harm scale, indicating a significantly low level of belief regarding the potential harm of medication in general.
Feature selection
Prior the building of the model, the process of feature selection was conducted using the sequential backward elimination method in order to discover variables that were deemed significant in relation to drug wastage. The construction of the eight ML models involved the utilisation of the variables chosen through the feature selection technique, along with all input variables for the purpose of comparison. The three feature selection methods used in this study are RF, LR and SVR. The variables selected by each feature selection method is displayed in Table 2 below. The three feature importance algorithms, which are methods to identify the most relevant variables for a predictive model, have some common variables that appear frequently in their results which are BMQ Specific Concern, BMQ General Overuse and BMQ General Harm.
List of variables selected for each algorithm.

Note. The highlighted (bolded) variables are the common variables selected across all feature selection method.
Model performance
In this study, the RMSE of each prediction model was compared for performance evaluation. As previously mentioned, the lower the RMSE, the better the model performance. The RMSE for the baseline of XGBoost reported the lowest value of 4.674 (Table 5) when employing LR-selected variables among the three feature importance algorithms and other ML and EL models. Among the EL models, the one utilising a GLM meta-learner exhibited the lowest RMSE values when applying variables selected by RF feature selection method (4.836) (see Table 3). The MAE measures a model’s predictive accuracy, with a smaller MAE indicating better performance. Among various models, XGBoost attained the smallest MAE of 3.709 when employing variables selected by SVR. Between the EL models, GLM meta-learner exhibited the lowest MSE values when applying variables selected by LR feature selection method with the value of 3.902. The performance of each of the models are summarised in Tables 3‒5 (also the 10-fold cross validation values of the RMSE and MAE are tabulated in Supplemental Tables S2 and S3, respectively). Additionally, the graphical representations of the models’ RMSE and MAE are presented in Supplemental Figures S1‒S3. To ensure the reliability of the findings, validation was conducted using the Wilcoxon signed-rank test p-value. All models exhibited p-values greater than .05, indicating there is no significant difference between actual and predicted values. Hence, for this study, the best performing model is XGBoost using the LR selected variables as it has the lowest value of RMSE and the fewest number of variables in predicting medication wastage.
Summary of model performance for each model using RF selected variables.

Summary of model performance for each model using SVR selected variables.

Summary of model performance for each model using LR selected variables.

A correlation analysis was conducted to evaluate the relationship between the predicted values generated by the XGBoost model and the actual observed values in the testing dataset. As illustrated in Supplemental Figure S4, the scatter plot shows a moderate positive linear relationship between the predicted and actual values. The Pearson correlation coefficient was r = .51, indicating that the model captures some degree of linear association between the predicted and true values, although there remains considerable variability. The fitted regression line (in blue) provides a visual indication of the model's general prediction trend, while the spread of points around the line reflects the prediction error. Although a perfect correlation (r = 1) was not achieved, the result demonstrates that the model has learned meaningful patterns from the data.
The baseline models, using the mean and median predictors, both yielded an RMSE of 5.35. In contrast, the best-performing model, XGBoost with variables selected through LR, achieved a significantly lower RMSE of 4.67, demonstrating the model's ability to capture relevant patterns in the data and outperform the simple baseline predictors. This improvement highlights the effectiveness of the ML approach in providing more accurate predictions and underscores the value of feature selection in enhancing model performance.
Model interpretation
The bar plot in Figure 2 shows displays the variables ranked by their importance, determined by the mean absolute SHAP values assigned to each variable. The significant variables used for this study are the ones determined by sequential backward elimination using LR. This method was preferred since it resulted in the least number of variables while still achieving the best performance in the ML and EL models mentioned in Table 5. According to the plot, BMQ General Harm exhibits the greatest influence on the model's output, followed by BMQ General Overuse, BMQ Specific Concern, ethnicity, age, region of residence, finally monthly income, which has the least impact among the seven variabless. Notably, the mean SHAP value for BMQ General Harm exceeds one, indicating its significant effect on the model output.
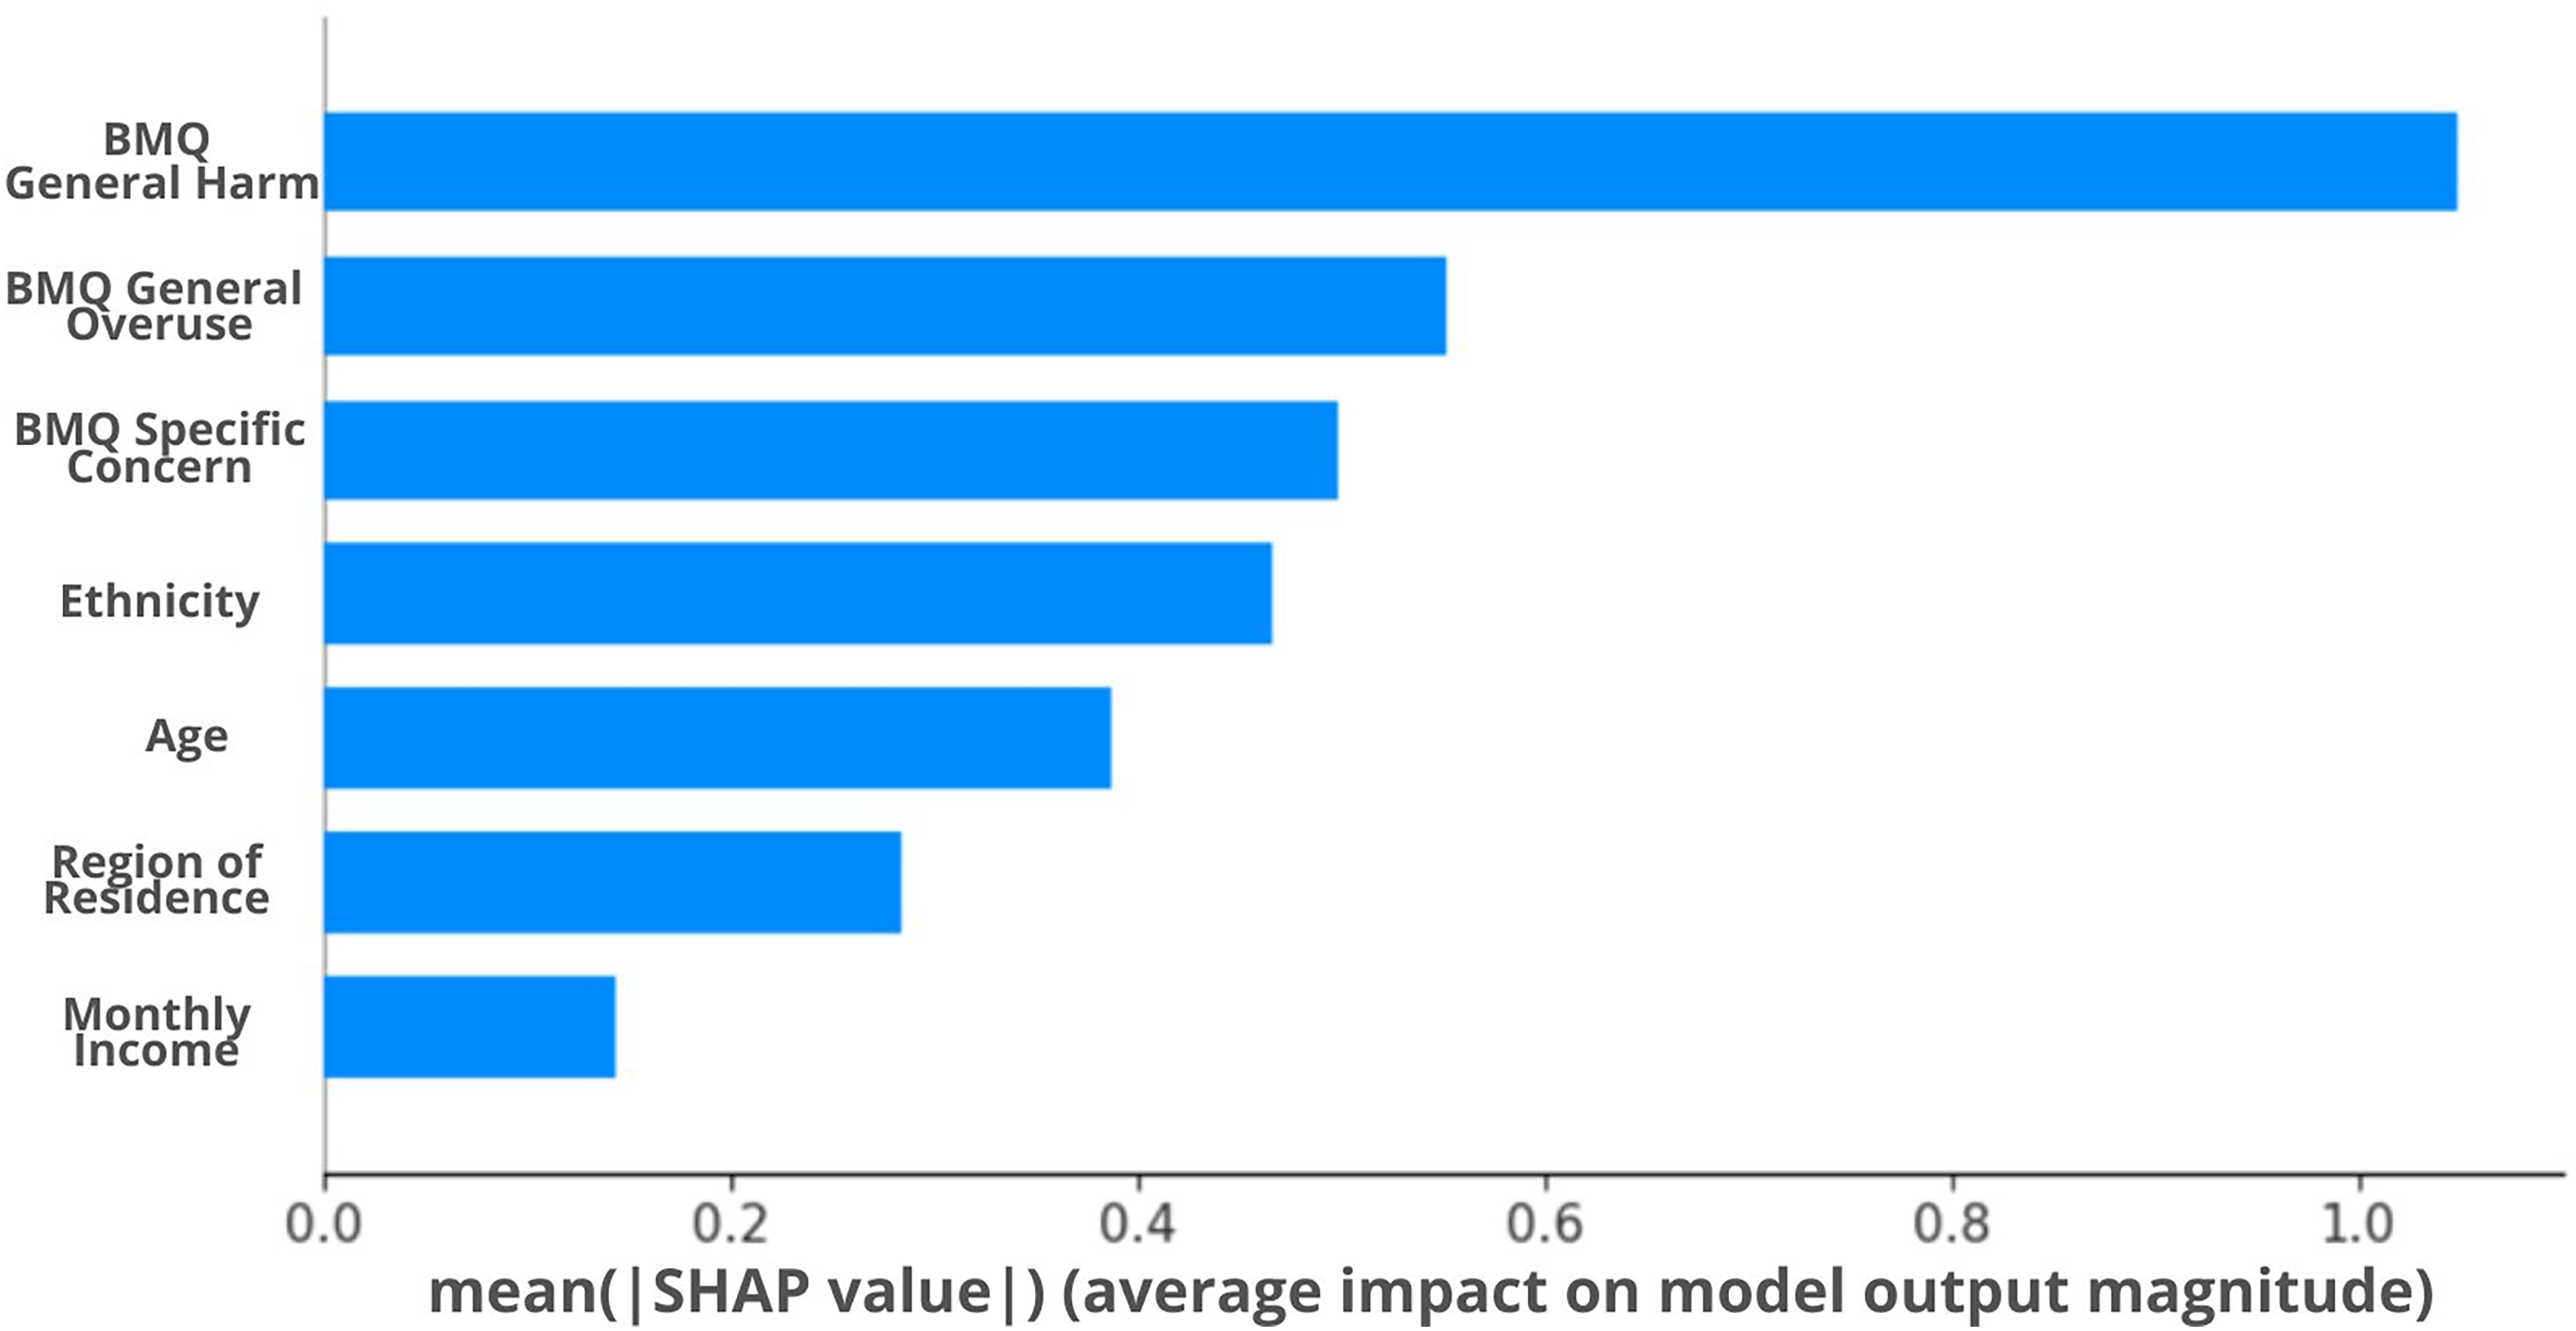
SHAP feature importance plot.
The x-axis in Figure 3 represents the SHAP value, while the gradient colour indicates the beginning value of the variable. The bar's direction (left or right) for each attribute indicates whether the effect is advantageous or disadvantageous. The right side of the graph represents a positive impact, indicating a higher ReDiUM value. This suggests that patients have improved medication management and are less likely to waste their prescriptions. Based on Figure 3, BMQ General Harm is the most significant variable in influencing the model's ability to predict the likelihood of patients wasting their prescription. Higher values, shown by the red dots, consistently demonstrate an association with reduced medication wastage. This suggests that patients who perceive pharmaceuticals as potentially hazardous are less likely to discard the prescribed medications. A similar trend is observed for both BMQ General Overuse and BMQ Specific Concern. Despite patients perceiving that they are being over-prescribed and expressing concerns about the adverse effects of medications, there is still a low probability of them wasting their medications. The SHAP analysis also shows that indigenous people (higher values with the red dots-referring to Figure 3), have poor medication management as compared to other ethnicities. The relationship between age and medication wastage is ambiguous due to significant overlap between the red and blue data points. However, the majority of the blue dots are located on the right side, suggesting that younger patients have a lower propensity to waste their medications as compared to the elderly. Ultimately, patients with higher monthly income demonstrate a favourable influence on their likelihood to adhere to their medications and avoid unnecessary medication waste.

SHAP summary plot.
Discussion
This study is the first to pioneer the development and evaluation of ML and EL algorithms to predict subsidised medication waste, focusing on how patient factors, such as beliefs, contribute to this critical healthcare resource management issue. The study's use of ML and EL methods in an Asian population to examine medication wastage from the patient's perspective is novel. This study showed that medication wastage may be predicted using a wide range of characteristics, including medication belief domain (BMQ Specific Harm, BMQ General Overuse, BMQ General Concern), ethnicity, age, region of residence and monthly income. XGBoost outperformed other EL models. It performed best in this task with the lowest value of RMSE. Another advantage of this study's approach is the use of SHAP values for feature selection and model interpretation. SHAP interprets ML models’ black-box nature, showing how each variable affects prediction outputs. This study proves ML can predict medication wastage.
In this study, the decision to utilise questionnaires is informed by their established effectiveness in capturing self-reported data related towards treatment. By providing valuable insights into patient beliefs, as demonstrated in previous research, 38 questionnaires offer a reliable means of collecting subjective data that reflects real-life experiences. Additionally, their non-invasive nature, which minimises disruption to daily routines, 39 encourages more candid responses compared to other methods like electronic monitoring. 40 This makes questionnaires particularly well suited for evaluating medication wastage from the patient's perspective.
Early studies used traditional statistical methods to predict medication wastage. Descriptive statistics analysed medicine returns in Barcelona 41 and explored demographic and economic factors influencing wastage. 42 Mouloudj et al. (2023) later integrated variables into the Theory of Planned Behaviour to examine waste reduction. 18 While conventional methods laid the groundwork, recent growth ML applications have advanced prediction models across healthcare, including medication wastage. Go 20 used RF with electronic health records of rheumatoid arthritis patients to predict wastage, but no studies have employed multiple ML or EL methods, making our study a novel use of Southeast Asian data.
The lowest RMSE of 4.67 was achieved by XGBoost, using variables selected through recursive feature elimination with LR, outperforming other ML and EL methods. This study chose RMSE over MAE as a performance statistic for numerous reasons. In this study, greater errors are especially undesirable and must be minimised aggressively, therefore RMSE is more sensitive to them because it squares each error before averaging. 43 Large prediction errors can lead to unfavourable results, such as failing to foresee medication wastage. RMSE improves prediction accuracy slightly, which helps fine-tune models as done in this study. 44 This study also shows that most models perform equally in the MAE. The use of RMSE is better since it highlights greater errors more clearly, while the MAE is only useful when all errors are equally important. 44 Even minimal prediction model improvements are crucial in pharmaceuticals. 45 Thus, RMSE was used in this study for its ability to penalise larger errors, improve prediction of medication wastage and highlight finer differences in regression model performance, making it a pioneering approach with Southeast Asian data.
The best-performing model in this study, XGBoost with variables selected using LR, achieved an RMSE of 4.67, which is significantly lower than the baseline RMSE values derived from the mean predictor (5.35) and median predictor (5.35). This significant enhancement over the simplistic baselines indicates that the ML model identifies relevant patterns in the data and offers a reliable framework for predicting medication wastage. While the mean and median predictors represent simple benchmarks with no use of input variables, the XGBoost model leverages selected variables to reduce prediction errors effectively. The difference of approximately 0.68 between the best model's RMSE and the mean/median baselines is a strong indicator of the model's utility and predictive power. 44 This improvement is particularly important in the context of medication wastage, where minimising large prediction errors is critical to ensure accurate forecasting and efficient resource allocation. By achieving a lower RMSE, the XGBoost model underscores the importance of feature selection and advanced ML techniques in enhancing prediction accuracy. This result also highlights the value of employing RMSE as a performance metric, as it effectively penalises larger errors and enables finer discrimination between model performances. 43 Consequently, the model provides a reliable and data-driven foundation for addressing medication wastage in healthcare settings.
Since no studies have specifically applied ML or EL to medication wastage and patients’ beliefs, as this area closely aligns with our research focus, exploring research on medication adherence prediction offers valuable insights and a basis for comparison. Wang et al. employed SVM and LR to predict medication non-adherence in Chinese Crohn's disease patients. 46 SVM had the highest accuracy with an F1 score of 0.86. SVM outperformed LR, RF, XGB and ANN in predicting cardiovascular disease and asthma attacks, with AUCs of 0.78 and 0.75, respectively, according to Sun et al. and Budiarto et al.47,48 EL outperformed SVM in predicting type-2 diabetes adherence in China with an F1 score of 0.77. 49 Instead of studying specific diseases, Koesmahargyo et al. showed that XGBoost predicts medication adherence across different disorders. 50 In addition, just one multi-ethnic Asian study, like ours, predicted hypertension drug adherence. ANN outperformed SVR, LR, RF and ANN with an RMSE of 1.42. 51 The literature on medication adherence across diseases is pertinent to our study, which comprises individuals with multiple disorders, bolstering our methodology’ broader application and utilisation of Southeast Asian data.
Based on the studies mentioned, which demonstrated the reliability of ML and EL in predicting medication adherence, this study applied similar methods to predict medication wastage. ML algorithms handle complex, high-dimensional datasets better than traditional methods by accommodating non-linear relationships and interactions. 51 Techniques like RF and XGBoost enhance predictive performance by integrating multiple decision trees, reducing overfitting and improving generalisability. 30 Additionally, ML models continuously improve with new data, offering greater accuracy and adaptability compared to static conventional models. 52 These benefits highlight ML's potential to advance predictive analytics in healthcare.
This study reveals that XGBoost outperforms other models like SVR, RF, LR and EL methods in predicting medication wastage. XGBoost's advantages include a regularisation term that prevents overfitting, which is a common issue with SVM and RF models. 53 It also excels in modelling non-linear relationships, capturing complex patterns that linear models may miss. 54 Compared to other EL methods, XGBoost benefits from superior scalability, parallel processing and faster training, making it more efficient for large datasets. 30
However, based on the previous studies on ML for predicting medication adherence, a closely related topic to medication wastage, only Aziz et al. employed a regression model instead of a classification model. 51 Using a regression approach is crucial for measuring adherence levels on a continuous scale rather than a binary one, allowing for finer differentiation between patients. 55 This granularity helps tailor interventions by detecting minor deviations from prescribed regimens that a binary system might miss. 56 Regression models offer precise estimates and handle continuous variables, enhancing predictive performance and actionable insights. 57 Due to its viability for use in adherence prediction studies, this study adopted the regression approach to build a predictive model for medication wastage based on patients’ belief analysis. Their flexibility in incorporating diverse variables and metrics like MSE and R2 makes them valuable for clinical decision-making and improving health outcomes. 58
In this study, sequential backward elimination was used for feature selection with LR, SVR and RF. Notably, LR selected the fewest variables and achieved the lowest RMSE of 4.67 when building a prediction model for medication wastage with XGBoost. Fewer variables generally lead to more interpretable models with reduced processing needs and more reliable predictions. 59 Key variables identified include age, monthly income, ethnicity, region of residence, BMQ General Harm, BMQ General Overuse and BMQ Specific Concern. While Mouloudj et al. identified significant variables like moral obligations and perceived risks in predicting medication waste reduction using conventional methods, ML feature selection methods have yet been used to find significant variables for medication wastage prediction. 18 However, recent studies have used ML for feature selection in medication adherence prediction (closest topic related to medication wastage). For instance, age has been a significant variable in various conditions, including hypertension,60,61 cardiovascular diseases, 62 statin adherence, 63 and kidney failure. 64 Ethnicity has been studied by Li et al. 61 and Zullig et al., 65 while monthly income's importance has been highlighted in studies on hypertension and opioid use disorder.51,66 Aziz et al. also noted the significance of BMQ General Harm perceptions and BMQ Specific Concerns in hypertensive patients, 51 similar to findings by Kim et al. and Wang et al. on nicotine replacement therapy 67 and Crohn's disease, 46 respectively. These studies collectively emphasise the complexity of medication adherence, with many variables also found significant in our medication wastage prediction research as well.
Sequential backward elimination has been identified as the optimal feature selection technique in this study, enhancing model performance by removing irrelevant or redundant variables. This method simplifies the model, reduces overfitting and improves the computational efficiency. 68 It iteratively removes the least significant variables based on criteria like p-values in LR, making models more accurate and interpretable. 69 While RF and SVR effectively handle non-linear relationships, they lack the straightforward interpretability of LR, where backward elimination directly correlates feature significance with model performance. 70
The optimal model in our study, which used XGBoost with variables selected through LR sequential backward elimination, was analysed with SHAP to clarify individual variable contributions. 71 SHAP values were chosen for their superior accuracy and consistency over methods like Local Interpretable Model-agnostic Explanations (LIME). 72 The SHAP analysis (Figure 3) revealed that BMQ General Harm was the most important variable, followed by BMQ General Overuse, BMQ Specific Concern, ethnicity, age, region of residence and monthly income. BMQ General Harm, BMQ General Overuse, BMQ Specific Concern and monthly income positively affected ReDiUM scores, indicating a lower likelihood of medication wastage, while ethnicity and age had the opposite effect.
The BMQ factors – general harm, general overuse and specific concern – significantly impact medication wastage. BMQ General Harm addresses concerns about potential negative effects of drugs, BMQ General Overuse relates to worries about excessive usage and BMQ Specific Concern pertains to apprehensions about particular medications. 15 Higher scores in these dimensions, indicating increased concerns, are associated with high ReDiUM values and reduced medicine wastage, as shown in the SHAP analysis. This suggests that individuals with significant worries about drug safety, overuse, or specific medications are more cautious and intentional in their medication management. 73 They are likely to adhere more strictly to dosages, avoid unnecessary purchases and engage more with healthcare providers, thereby reducing medication waste. This correlation underscores how attitudes and concerns influence medication use and wastage.
Malaysia's diverse ethnic landscape provides a unique setting for studying factors influencing medication wastage. In the SHAP analysis, indigenous peoples, represented by red dots (Figure 3), show a higher likelihood of medication wastage. This trend is linked to socio-economic disparities, limited healthcare access and cultural differences in pharmaceutical use. Beliefs in natural remedies and cultural influences often reduce adherence to conventional therapies among indigenous patients. 74 Poor doctor-patient communication further exacerbates this issue, leading to misunderstandings and diminished trust in healthcare providers. 75 A study on medical students serving indigenous communities highlights the need for cultural competence to enhance healthcare delivery and relationships, which may help reduce wastage in these populations. 76
In Figure 3, the red dots representing older patients demonstrate a dual inclination: they might either have a high propensity for medicine wastage. This heterogeneity may arise from various sources. Elderly individuals may inadvertently squander medication as a result of memory lapses, 77 intricate medication schedules, 78 or physical challenges in handling medications. 79 On the other hand, they may manage their medications more effectively, avoiding waste due to more frequent interactions with healthcare practitioners, established daily routines, support from strong social networks like family members, or superior health literacy. 80 In contrast, younger patients, shown by blue dots, regularly exhibit a greater inclination to not waste their medicine. This phenomenon could be ascribed to an increased level of familiarity with organised schedules, electronic prompts, a proactive attitude towards health, or enhanced general physical and cognitive capacity to efficiently handle their prescription regimen. 81
Based on the SHAP analysis above, it is also evident that patients with lower monthly income (blue dots) tend to waste their medication. There are several reasons for this trend. Patients with lower income encounter difficulties in adhering to their pharmaceutical regimen. A study conducted in Malaysia found a significant correlation between low income and incorrect storage of medication as well as a lack of administration regimens among psychiatric patients. 82 Furthermore, research conducted on individuals with chronic illnesses in Malaysia revealed that patients who were compliant with their pharmaceutical regimen had a considerably reduced number of medications, suggesting a possible financial obstacle to adherence. 83 Within a wider Asian framework, an examination of individuals with hypertension revealed a widespread lack of adherence to antihypertensive treatment, particularly in poor and lower middle-income nations as opposed to upper-middle and high-income countries. 84 Finally, although subsidised medication is advantageous, it can occasionally create a perception of reduced worth, resulting in patients being less conscientious in their adherence. 85 These data indicate that patients who have lower monthly income levels are more likely to not follow their prescribed medication regimen. This emphasises the importance of implementing specific interventions to enhance medication adherence in these groups.
This study has several limitations. Firstly, the research is confined to only 6 healthcare facilities, which, while covering different zones, limits the generalisability of the findings across the broader healthcare system. Additionally, the study employed a cross-sectional survey design, capturing data at a single point in time. This limits the ability to observe trends over time, providing only a snapshot rather than a comprehensive view of how variables may evolve. Further studies that track longitudinal data could provide more robust insights.
For future research, incorporating data specific to various diseases prevalent in Malaysia and Southeast Asia could enhance the model's predictive accuracy, ensuring a more tailored approach to medication distribution. ML models based on data representativeness rather than medical competence may have biases and need continual validation with real-world data, which electronic health records might help with. Additionally, integrating insights from healthcare professionals can further refine the model and improve its reliability.
Conclusion
The study has developed a ML model that provides pharmacists with a reliable tool to predict the wastage of subsidised medication, demonstrating the effectiveness of both base and ensemble ML models, when combined with feature selection, in addressing subsidised medication wastage in Malaysia. This model facilitates precise inventory management and helps in minimising avoidable expenses. The findings highlight the potential for combining these advanced ML models with conventional risk-scoring approaches as an aid to the pharmacist in patient intervention on medication intake and wastage. Moreover, this approach has significant potential for the Malaysian government, specifically the Ministries of Health and Finance, as it can optimise resource allocation and reduce financial losses related to wasted medications. By incorporating this approach into hospital systems, pharmacists would be able to actively interact with patients, guaranteeing prompt interventions and improved medication use. However, integration of such measures might ultimately enhance patient outcomes and lead to a more sustainable healthcare system in Malaysia. On a larger scale, this model's framework and findings could indirectly support broader healthcare improvements across Southeast Asia, contributing to the region's pursuit of more efficient, patient-centred healthcare systems.
Supplemental Material
sj-docx-1-dhj-10.1177_20552076251355127 - Supplemental material for Predicting medication wastage using machine learning based on patient beliefs
Supplemental material, sj-docx-1-dhj-10.1177_20552076251355127 for Predicting medication wastage using machine learning based on patient beliefs by Firdaus Aziz, Sorayya Malek, Shubathira Sooriamoorthy, Ilham Asyilah Mahamood, Chong Wei Wen, Sharifah M. Syed Ahmad, Putri Nur Fatin Amir Rudin and Adliah Mhd Ali in DIGITAL HEALTH
Supplemental Material
sj-tif-2-dhj-10.1177_20552076251355127 - Supplemental material for Predicting medication wastage using machine learning based on patient beliefs
Supplemental material, sj-tif-2-dhj-10.1177_20552076251355127 for Predicting medication wastage using machine learning based on patient beliefs by Firdaus Aziz, Sorayya Malek, Shubathira Sooriamoorthy, Ilham Asyilah Mahamood, Chong Wei Wen, Sharifah M. Syed Ahmad, Putri Nur Fatin Amir Rudin and Adliah Mhd Ali in DIGITAL HEALTH
Supplemental Material
sj-tif-3-dhj-10.1177_20552076251355127 - Supplemental material for Predicting medication wastage using machine learning based on patient beliefs
Supplemental material, sj-tif-3-dhj-10.1177_20552076251355127 for Predicting medication wastage using machine learning based on patient beliefs by Firdaus Aziz, Sorayya Malek, Shubathira Sooriamoorthy, Ilham Asyilah Mahamood, Chong Wei Wen, Sharifah M. Syed Ahmad, Putri Nur Fatin Amir Rudin and Adliah Mhd Ali in DIGITAL HEALTH
Supplemental Material
sj-tif-4-dhj-10.1177_20552076251355127 - Supplemental material for Predicting medication wastage using machine learning based on patient beliefs
Supplemental material, sj-tif-4-dhj-10.1177_20552076251355127 for Predicting medication wastage using machine learning based on patient beliefs by Firdaus Aziz, Sorayya Malek, Shubathira Sooriamoorthy, Ilham Asyilah Mahamood, Chong Wei Wen, Sharifah M. Syed Ahmad, Putri Nur Fatin Amir Rudin and Adliah Mhd Ali in DIGITAL HEALTH
Supplemental Material
sj-tif-5-dhj-10.1177_20552076251355127 - Supplemental material for Predicting medication wastage using machine learning based on patient beliefs
Supplemental material, sj-tif-5-dhj-10.1177_20552076251355127 for Predicting medication wastage using machine learning based on patient beliefs by Firdaus Aziz, Sorayya Malek, Shubathira Sooriamoorthy, Ilham Asyilah Mahamood, Chong Wei Wen, Sharifah M. Syed Ahmad, Putri Nur Fatin Amir Rudin and Adliah Mhd Ali in DIGITAL HEALTH
Supplemental Material
sj-docx-6-dhj-10.1177_20552076251355127 - Supplemental material for Predicting medication wastage using machine learning based on patient beliefs
Supplemental material, sj-docx-6-dhj-10.1177_20552076251355127 for Predicting medication wastage using machine learning based on patient beliefs by Firdaus Aziz, Sorayya Malek, Shubathira Sooriamoorthy, Ilham Asyilah Mahamood, Chong Wei Wen, Sharifah M. Syed Ahmad, Putri Nur Fatin Amir Rudin and Adliah Mhd Ali in DIGITAL HEALTH
Supplemental Material
sj-docx-7-dhj-10.1177_20552076251355127 - Supplemental material for Predicting medication wastage using machine learning based on patient beliefs
Supplemental material, sj-docx-7-dhj-10.1177_20552076251355127 for Predicting medication wastage using machine learning based on patient beliefs by Firdaus Aziz, Sorayya Malek, Shubathira Sooriamoorthy, Ilham Asyilah Mahamood, Chong Wei Wen, Sharifah M. Syed Ahmad, Putri Nur Fatin Amir Rudin and Adliah Mhd Ali in DIGITAL HEALTH
Supplemental Material
sj-docx-8-dhj-10.1177_20552076251355127 - Supplemental material for Predicting medication wastage using machine learning based on patient beliefs
Supplemental material, sj-docx-8-dhj-10.1177_20552076251355127 for Predicting medication wastage using machine learning based on patient beliefs by Firdaus Aziz, Sorayya Malek, Shubathira Sooriamoorthy, Ilham Asyilah Mahamood, Chong Wei Wen, Sharifah M. Syed Ahmad, Putri Nur Fatin Amir Rudin and Adliah Mhd Ali in DIGITAL HEALTH
Supplemental Material
sj-docx-9-dhj-10.1177_20552076251355127 - Supplemental material for Predicting medication wastage using machine learning based on patient beliefs
Supplemental material, sj-docx-9-dhj-10.1177_20552076251355127 for Predicting medication wastage using machine learning based on patient beliefs by Firdaus Aziz, Sorayya Malek, Shubathira Sooriamoorthy, Ilham Asyilah Mahamood, Chong Wei Wen, Sharifah M. Syed Ahmad, Putri Nur Fatin Amir Rudin and Adliah Mhd Ali in DIGITAL HEALTH
Footnotes
Acknowledgements
We gratefully acknowledge Universiti Kebangsaan Malaysia for funding this study under Geran Galakan Penyelidik Muda (GGPM) (Grant number: GGPM-2023-058), making this research possible. We would also like to express our deepest gratitude to the dedicated staff at the outpatient pharmacies of each of the six tertiary hospital sites where this study was conducted, for their invaluable support in data collection. Their dedication and encouragement were indispensable to the successful conclusion of this investigation.
Ethical considerations
This study has obtained approval for ethics from the Universiti Kebangsaan Malaysia Centre for Research and Instrumentation Management under the permission code UKM PPI/111/8/JEP-2021-842 and Medical Research & Ethics Committee under the Ministry of Health Malaysia, NMRR ID NMRR-21-1747-61023 (IIR).
Author contributions
FA contributed to data curation, funding acquisition, formal analysis, investigation, methodology, software, validation, visualisation and writing the original draft and editing the final version of the manuscript. SM contributed to conceptualisation, data curation, formal analysis, funding acquisition, investigation, methodology, project administration, resources, software, supervision, validation, visualisation writing the draft and reviewing and editing the final manuscript. SS contributed to data curation, formal analysis, methodology, validation and writing the original draft. IAM contributed to data curation, formal analysis, investigation, software and writing of the original draft of the manuscript. CWW contributed to conceptualisation, funding acquisition and reviewing the final version of the manuscript. SMSA contributed to conceptualisation, funding acquisition and reviewing the final version of the manuscript. PNFAR contributed to data curation, formal analysis, investigation, software and writing of the original draft of the manuscript. AMA contributed to conceptualisation, data curation, formal analysis, funding acquisition, investigation, methodology, project administration, resources, software, supervision, validation, visualisation writing the draft and also reviewing and editing the final manuscript. All authors read and approved the final manuscript.
Funding
The authors disclosed receipt of the following financial support for the research, authorship and/or publication of this article: This work was supported by Universiti Kebangsaan Malaysia (Grant number: GGPM-2023-058).
Declaration of conflicting interests
The authors declared no potential conflicts of interest with respect to the research, authorship and/or publication of this article.
Data availability statement
The datasets utilised and analysed in this study are available from the corresponding author upon reasonable request.
Informed consent
Potential respondents at the outpatient pharmacy at the above settings were invited to participate in this study. The researcher approached the patients or the caregiver at the outpatient pharmacy and provided an explanation of the study purpose based on the patient information leaflet. If the patient agrees to participate, they will be requested to sign the informed consent. Patients aged 18 years above, receiving subsidised medications for chronic disease and able to read and answer the questions were included in this study. The survey, which took place from 1 February 2022 to 20 October 2022, was conducted during this period.
Guarantor
AMA.
Supplemental material
Supplemental material for this article is available online.
References
Supplementary Material
Please find the following supplemental material available below.
For Open Access articles published under a Creative Commons License, all supplemental material carries the same license as the article it is associated with.
For non-Open Access articles published, all supplemental material carries a non-exclusive license, and permission requests for re-use of supplemental material or any part of supplemental material shall be sent directly to the copyright owner as specified in the copyright notice associated with the article.