
Abstract
Objective
This study aims to develop a customized severity adjustment tool for hospital deaths in pneumonia patients considering characteristics of Korean discharged patients using representative data from the Korea Disease Control and Prevention Agency's Korea National Hospital Discharge In-Depth Injury Survey (KNHDIS).
Methods
We analyzed 46,286 cases of pneumonia hospitalization among KNHDIS data from 2013 to 2022 and developed a model after adjusting for the severity of comorbidities using SAS and Python programs.
Results
Analysis results showed that among three complication adjustment tools, including the existing complication index K-CCI (Korean-Charlson Comorbidity Index) and newly developed m-K-CCI (modified-Korean-Charlson Comorbidity Index) and m-K-CCS (modified-Korean-Clinical Classification Software), m-K-CCS was the best. For model development and evaluation, least absolute shrinkage and selection operator (LASSO), logistic regression, classification and regression tree (CART), random forests, gradient-boosted model (GBM), and artificial neural network (ANN) analyses were performed. Analysis of the validation dataset showed that GBM's m-K-CCS had the highest AUC value of 0.910.
Conclusion
These results suggest that further research is needed on models that adjust for the severity of comorbidities for each diagnosis to more accurately predict health outcomes.
Introduction
Approximately 60% of deaths in the United States occur in hospitals. While most deaths are unavoidable, reducing unnecessary deaths is an important goal of health care service. 1 Hospital mortality rate is a representative outcome indicator that evaluates the quality of medical services provided by medical institutions. 2 To accurately measure and evaluate hospital mortality, it is necessary to adjust for the severity of various patient risk factors that can affect death. 3 Severity adjustment is a process of controlling for factors that affect the outcome of interest. Comorbidities are known to be an important factor. 4 Although comorbidities are not the primary diagnosis that leads to a patient's hospitalization, they are important severity adjustment variables in that they can increase complications, death, length of stay, and medical costs.5,6
A representative tool for adjusting the severity of comorbidities is the Charlson comorbidity index (CCI). CCI has been used not only in Korea, but also in the US, UK, Canada, and Australia to adjust the severity of hospitalized patients to develop mortality models and evaluate hospital mortality rates.2,7–10 CCI is a method that can adjust the severity of a patient's condition by giving weight to comorbidities that are highly associated with death. Charlson et al. have selected 19 diseases that are highly predictive of death based on medical records of 604 patients admitted to a New York hospital over a period of one month in 1984. They then assigned weights based on the relative risk of each disease. The sum of these weights became the CCI.4,11 Since then, CCI has been applied to various diseases and surgeries. Its validity has been proven. Studies have been conducted on how to apply CCI and determine weights.12–15 Romano et al. have recommended using weights re-estimated from a study population rather than using CCI weights. 16 Quan et al. have suggested the need to update weights developed 30 years ago due to improvements in chronic disease management, treatment, and medical technology. They have updated CCI weights for predicting mortality using data of patients discharged from six countries, including Canada and Australia. 10
Although CCI is a representative severity correction tool used in previous studies, it has several limitations. First, although there are differences in factors affecting a patient's severity depending on the primary diagnosis, the CCI adjusts the patient's severity by giving equal weight to all primary diagnoses. 17 Second, although the CCI developed in 1986 is a widely used tool, it has been pointed out that it has limitations in that it does not reflect many advances or changes in medical technology since its development long time ago. 18 Third, the CCI only reflects 17 comorbidities that can affect mortality. There are cases where comorbidities shown to affect health outcomes in previous studies are excluded. 19 In the United Kingdom, a study was conducted to develop a severity adjustment tool based on hospital discharge data in order to reflect characteristics of discharged patients and improve weighting of comorbidities that could affect mortality over time. 20
In Korea, the pneumonia mortality rate was 44.4 per 100,000 people in 2021. Pneumonia was the third leading cause of death. The number of pneumonia patients and medical expenses are expected to gradually increase due to rapid aging. 21 Pneumonia is a disease for which empirical diagnosis and treatment are important. The Infectious Diseases Society of America (IDSA) has reported that the mortality rate can be reduced by applying management guidelines for community-acquired pneumonia. 22 In addition, since there are research results showing that compliance with management guidelines has a positive effect by reducing mortality and length of hospital stay, it is necessary to accurately calculate mortality results that adjust for the severity of pneumonia patients. 23 Recently, research on mortality prediction and model development based on machine learning using big data has been actively conducted.17,18,24–26 However, there is almost no research on a severity-adjusted mortality model for pneumonia. Therefore, this study aimed to develop a customized severity adjustment tool for hospital deaths in pneumonia patients considering characteristics of Korean discharged patients using representative data from the Korea Disease Control and Prevention Agency's Korea National Hospital Discharge In-Depth Injury Survey (KNHDIS).
Method
This was a cross-sectional study that utilized big data collected from medical institutions at the national level to develop a severity adjustment tool for accurate health outcome measurement of pneumonia patients.
Study design and data
This study used 1,803,611 cases of Korea National Hospital Discharge In-Depth Injury Survey data from 2013 to 2022 from the Korea Centers for Disease Control and Prevention (KDCA). KNHDIS, a national survey, has been conducted annually since 2005 in Korea. Its data are nationally approved statistical data (Statistics Korea, approval No. 117060) on patients discharged from general hospitals with 100 or more beds. 27 To extract subjects with a primary diagnosis of pneumonia, the Agency for Healthcare Research and Quality (AHRQ) Clinical Classification System (CCS) criteria were utilized. CCS is a tool that classifies diagnoses or procedures into clinically meaningful categories. It can be used to integrate various forms of statistical reporting.28–30 Each classification group of CCS is mapped to a list of international standard terminology codes such as ICD-10 (Table 1). A total of 49,387 subjects with a primary diagnosis of pneumonia were extracted. After excluding those who were discharged such as those who were transferred to another hospital, escaped, others, and 3111 cases who were admitted and discharged on the same day, 46,286 cases were the final analysis subjects. To verify the comorbidity severity adjustment model, we analyzed 24,008 data from 2013, 2015, 2017, 2019, and 2021 for training purposes and 22,278 data from 2014, 2016, 2018, 2020, and 2022 for verification purposes by referring to previous studies. Data for verification purposes was not used as training data for model tuning, but was simply used as validation data for testing (Figure 1).17,18

Study design and data.
Definition of pneumonia according to CCS criteria
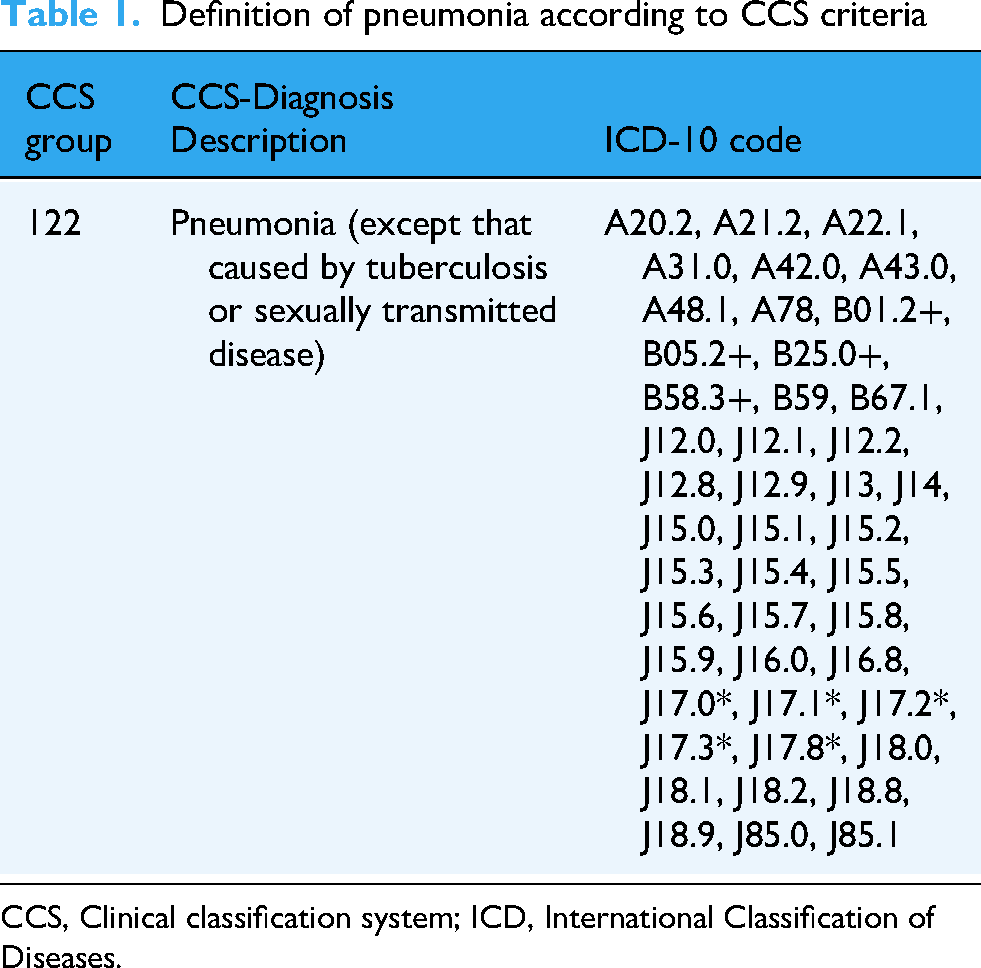
CCS, Clinical classification system; ICD, International Classification of Diseases.
Variables
The dependent variable was defined as whether a patient admitted with a primary diagnosis of pneumonia died from any cause during their hospital stay, i.e., overall mortality among patients admitted with pneumonia. Independent variables were gender, age, insurance type, whether surgery was performed, whether emergency hospitalization was performed, and comorbidity, referring to previous studies.13,18,31 Insurance types were categorized into health insurance, medical aid, and others. CCI and CCS tools were used to calculate comorbidity index variables, including the Korean-Charlson Comorbidity Index (K-CCI) composed of weights of 12 diseases updated through previous studies,4,10 the modified-Korean-Charlson Comorbidity Index (m-K-CCI) calculated by readjusting the existing 17 CCI comorbidity indices, and the modified-Korean-Clinical Classification Software (m-K-CCS), a comorbidity index calculated using the CCS tool.
Statistical analysis
To derive new comorbidity weights, we used the Cox regression analysis method, a survival analysis method, by referring to previous studies.31–33 To calculate the CCI weight (m-K-CCI), we used hazard ratio (HR) and 95% confidence interval (CI) considering sex, age, insurance type, surgery, emergency hospitalization, and 17 CCI comorbidities. The final CCI weight, m-K-CCI, was calculated by dividing the HR of statistically significant (p < 0.05) comorbidities by the HR of the lowest disease. To calculate CCS comorbidity weight (m-K-CCS), we used HR and 95% CI considering sex, age, insurance type, surgery, emergency hospitalization, and 260 CCS diseases. In order to solve the problem of multiple hypothesis testing for more than 260 predictor variables including 260 CCS, the Bonferroni Correction suggested in a previous study was applied to set the adjusted significance level. 34 The adjusted significance level calculated according to the Bonferroni Correction formula was 0.0002. The final CCS comorbidity weight, m-K-CCS, was calculated by dividing the HR of statistically significant (p < 0.0002) comorbidities by the HR of the lowest disease.
To develop a mortality prediction model adjusted for the severity of comorbidities, logistic regression analysis, least absolute shrinkage and selection operator (LASSO) regression, classification and regression tree (CART), random forest, gradient-boosted model (GBM), and artificial neural network (ANN) analysis techniques were used. Logistic Regression is a traditional statistical model that serves as a baseline for binary classification tasks. It is widely used in clinical research for its interpretability. LASSO Regression is a regularized linear regression method that performs both variable selection and shrinkage, which is particularly useful when dealing with high-dimensional comorbidity data. CART is a decision tree algorithm that allows for easy interpretation and captures nonlinear relationships and interactions between variables. Random forest is an ensemble method that builds multiple decision trees and aggregates their predictions, improving accuracy and reducing overfitting. GBM is a boosting algorithm that builds trees sequentially to minimize prediction error, often showing strong predictive performance in medical data contexts. ANN is a deep learning model capable of capturing complex, non-linear patterns in data. It was included to compare traditional models with more advanced, data-driven approaches. 24 These models were selected to provide a comprehensive comparison across linear, regularized, tree-based, and neural network approaches in terms of their predictive power for mortality. The predictive power for model fit evaluation and selection was evaluated using the area under the curve of receiver operating characteristic (ROC) (AUC) value. AUC has a value between 0.5 and 1. When AUC has a value of 0.5, it means that there is no predictive power. When AUC is over 0.8, it means that there is good predictive power. 18 SAS 9.4 for Windows software and Python for Windows software 3.10.0 were used for all statistical analyses.
Results
General characteristics
The total number of subjects in this study was 46,286. Data of 24,008 subjects were used as training data and data of 22,278 subjects were used as validation data. There were slightly more males (56.2%) than females (43.8%). Their average age was 34 years. Surgery was performed in 0.9% of cases. Hospitalization through the emergency room (55.8%) was higher than that through ambulatory care (44.2%) (Table 2).
General characteristics of study subjects

SD, standard deviation.
CCI and CCS modification using survival analysis
Cox regression analysis was used to recalibrate the comorbidity index to predict mortality in patients with pneumonia. Table 3 shows hazard ratios and adjusted weights of each comorbidity. Myocardial infarction, chronic pulmonary disease, liver disease, diabetes with end organ damage, diabetes, hemiplegia, renal disease, any tumor, and metastatic solid tumor were significantly associated with mortality (all p < 0.05). Compared with weights in the K-CCI, updated weights for myocardial infarction, diabetes, moderate or severe renal disease, and any tumor increased, while congestive heart failure, dementia, connective tissue disease, hemiplegia, moderate or severe liver disease, metastatic solid tumor, and AIDS decreased in the m-K-CCI. However, chronic pulmonary disease, mild liver disease, and diabetes with end organ damage did not show significant difference between the two (K-CCI vs. m-K-CCI) (Table 3).
Results of CCI modification using Cox regression analysis (n = 46,286)

m-K-CCI, modified-Korean Charlson Comorbidity Index; K-CCI, Korean-Charlson Comorbidity Index; AIDS, Acquired immunodeficiency syndrome. Adjusted for gender, age, insurance type, operation, admission route, and all comorbidities. For CCI comorbidities with p-values less than 0.05, the comorbidity index was readjusted using hazard ratio.
Cox regression analysis results for predicting severity-adjusted mortality in patients with pneumonia showed that hazard ratios of 15 diseases were significant (p < 0.0002) among 260 comorbidities. The significance level was set to the adjusted significance level (0.0002) by applying the Bonferroni Correction suggested in a previous study to solve the problem of multiple hypothesis testing. 34 The HR (hazard ratio) value of other diseases of bladder and urethra was the lowest at 0.347, while that of cardiac arrest and ventricular fibrillation was the highest at 3.207, followed by shock at 2.698, septicemia at 2.164, and leukemia at 1.947. The new weighted score of comorbidities (m-K-CCS) calculated by dividing by the lowest HR value was 1–9 (Table 4).
Results of calculating the CCS comorbidity index using Cox regression analysis (n = 46,286)

This model reflects all 260 CCS (Clinical classification software) comorbidities, including gender, age, insurance type, surgery, admission route, and more. For 15 CCS comorbidities with p-values less than 0.0002, the comorbidity index was readjusted using hazard ratio.
Validation of a severity-adjusted comorbidity model using survival analysis and machine learning
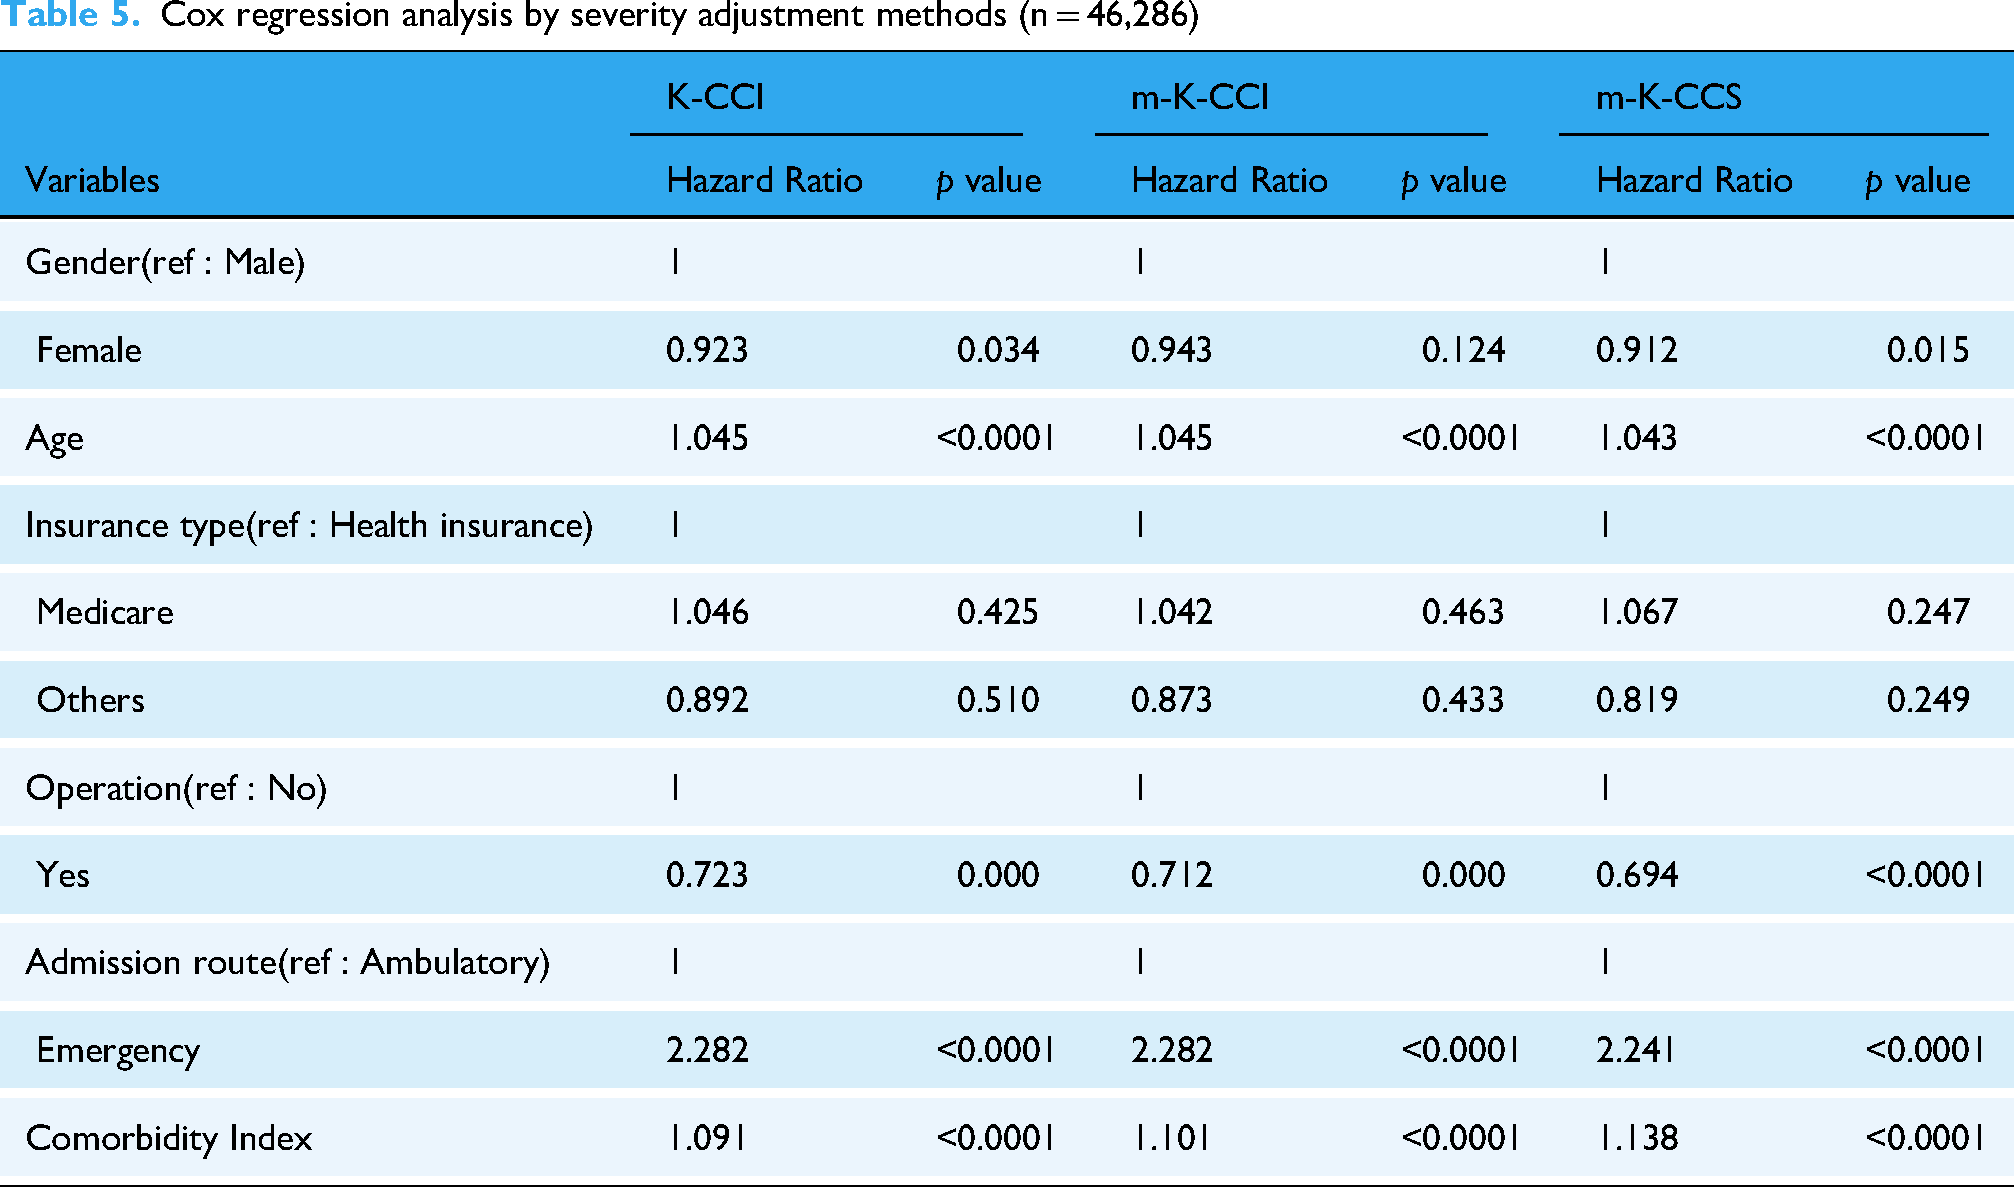
Cox regression analysis by severity adjustment methods showed that all severity indices (K-CCI, m-K-CCI, m-K-CCS) had a statistically significant effect on the risk of death (p < 0.0001). When the comorbidity index increased by 1 point, the risk of death increased by 9.1%, 10.1%, and 13.8%, respectively. m-K-CCS showed the highest sensitivity and the strongest severity adjustment effect (Table 5). Machine learning techniques were used to evaluate the comorbidity severity adjustment model by referring to prior studies. 26 For model development and evaluation, Least absolute shrinkage and selection operator (LASSO), logistic regression, classification and regression tree (CART), random forests, gradient-boosted model (GBM), and artificial neural network (ANN) analyses were performed. In the training dataset (n = 24,008), there were 1472 death cases, resulting in a mortality rate of 6.1%. In the validation dataset (n = 22,278), 1623 deaths were recorded, with a mortality rate of 7.3%. Both datasets exhibited class imbalance, with the number of death cases being relatively small compared to survival cases. Analysis using the validation dataset showed that GBM's m-K-CCS had the highest AUC value of 0.910, followed by logistic regression and ANN. Among the six modeling approaches, the comorbidity index-adjusted m-K-CCS consistently provided the highest AUC value among the five approaches except CART (Figure 2). In addition, most AUC values were higher than 0.7, confirming the performance and stability of the prediction model. Although Random Forest had a slightly lower AUC (0.857), it achieved relatively higher recall and F1 scores (Table 6).

Receiver of operating characteristic (ROC) curves for various machine learning techniques.
Cox regression analysis by severity adjustment methods (n = 46,286)
Comparison of models in predicting outcomes of patients with pneumonia using machine learning

AUC, area under the curve; K-CCI, Korean-Charlson comorbidity index; m-K-CCI, modified-Korean Charlson Comorbidity Index; m-K-CCS, modified-Korean Clinical classification software; LASSO, least absolute shrinkage and selection operator; CART, classification and regression tree; GBM, gradient-boosted model; ANN, artificial neural network.
Discussion
This study was conducted to more accurately predict and evaluate comorbidities affecting mortality by adjusting for disease severity using a nationwide database. Risk-adjusted mortality rates, which measure health outcomes and quality of care, are critical to health policy but difficult to measure accurately. 35 It is known that the influence of a patient's comorbidities is very important in calculating risk-adjusted mortality rates. However, severity-adjusted comorbidities are not customized for each disease. Although CCI has been widely used in the past, applying it to all diseases has limitations.4,18,31
Therefore, in this study, we developed and verified a comorbidity adjustment model that applied new weights suited to characteristics of pneumonia patients by utilizing the existing known comorbidity index CCI and CCS diagnostic group criteria. As a result of Cox regression analysis of 46,286 pneumonia patients, m-K-CCI was developed by applying new weights to 11 diseases in the existing Korean comorbidity index K-CCI model. Out of 260 CCS groups, 15 disease groups were statistically significant (p < 0.0002) and m-K-CCS model with new weights was developed. To verify the comorbidity index model, six machine learning techniques, including logistic regression analysis, least absolute shrinkage and selection operator (LASSO), classification and regression tree (CART), random forest, gradient-boosted model (GBM), and artificial neural network (ANN) analysis referring to previous studies,24,26 were used. Verification results showed that the m-K-CCS model had the highest AUC among all five machine learning techniques except the CART technique. This was consistent with results of a previous study that developed a comorbidity model by applying new weights to specific diseases such as liver disease, chronic pulmonary disease, diabetes, and renal disease, in which the C statistic of the new weighted model was higher than that of the existing comorbidity model. 31 The AUC of the m-K-CCS model of the GBM technique was the highest at 0.910, consistent with results of a previous study that developed and verified a mortality prediction model for heart failure patients, in which the C statistic of GBM was the highest. 24 The AUC of m-K-CCS of logistic regression analysis and the AUC of m-K-CCS of ANN were 0.906, 0.905 each and the AUC of LASSO was 0.889. Gradient-Boosted model (GBM) is a supervised learning algorithm that sequentially fits a new model. It complements the weaknesses of a previous model using gradients (or residuals) and then linearly combines them to create the resulting model. 24 It is one of the models in the machine learning series that has good performance. However, it has the disadvantage of being slow. In this study, the validation results showed that the machine learning models achieved high AUC, recall, and F1 scores, indicating overall good performance in predicting mortality. However, the precision values were relatively low across models, suggesting limitations in accurately identifying actual death cases. This discrepancy is likely due to class imbalance, as the number of death cases was substantially smaller than non-death cases. Therefore, future studies should consider applying oversampling techniques or other methods to balance the dataset and improve precision in mortality prediction.
These study results suggest the need for developing a customized severity adjustment tool with better predictive power that matches characteristics of the disease. It is necessary to clearly present comorbidities that affect mortality so that clinicians can utilize them in diagnosis and patient management. However, the existing severity adjustment tool was applied uniformly to all diseases without considering the characteristics of each disease. In the hospital standardized mortality rate evaluation conducted to evaluate the quality level of Korean medical institutions, the AUC of the pneumonia patient death model was 0.870, which is lower than the AUC of this study. 36 This is the result of adjusting the severity using the CCI method, which does not reflect the characteristics of Korean pneumonia death patients and equally applies the weights of 17 comorbidities to deaths of all diseases. In the era of artificial intelligence, it is necessary to collect big data necessary for problem solving, manage high-quality data to enable artificial intelligence learning, and utilize it for decision-making to solve problems. Many countries including Korea are developing a severity adjustment model to calculate severity adjustment deaths and making them public to the entire population.37–39 Therefore, calculating an accurate severity adjustment ratio based on a highly predictive comorbidity adjustment model will provide very important basic data for national health and medical policies.
This study has several limitations. First, because it utilized chart-based administrative data of hospitalized patients, several test results including biochemical tests related to the severity of the disease were not reflected in the variables. Second, due to limitations in the number of analysis subjects, more artificial intelligence techniques such as deep learning could not be applied. Third, although a model was developed by deriving new weights for each comorbidity through statistical analysis, a consensus among clinical experts was not reached. Thus, follow-up studies that complement these limitations are needed in the future. Future follow-up studies will be needed that include more diverse clinical data predicting variables that may affect the mortality of pneumonia patients. Despite these limitations, this study is significant in that results of this study can be used as basic data that can contribute to health care policies. This study also developed a comorbidity risk adjustment model suitable for each disease by recalibrating existing comorbidity tools using representative big data followed by a verification process using machine learning techniques.
Conclusions
The objective of this study was to develop a comorbidity-adjusted tool that could estimate the severity-adjusted mortality rate of hospitalized pneumonia patients using representative big data. Among the three comorbidity adjustment tools, including the existing comorbidity index K-CCI and the newly developed m-K-CCI and m-K-CCS, m-K-CCS was found to be the best. Model evaluation results using logistic regression analysis, LASSO regression analysis, CART, random forest, GBM, and artificial neural network analysis techniques confirmed that the GBM version method showed the best explanatory power. These study results suggest the need for developing models that adjust for the severity of comorbidities each principal diagnosis and continuing follow-up research on models that can more accurately predict health outcomes.
Footnotes
Ethical approval
This study was conducted in accordance with the Declaration of Helsinki. Ethical review and approval were waived for this study because it used anonymous public open indicator data, not an individual's personal data.
Author contributions
JL and JP conceptualized and designed the study. JP obtained funding. JP data collection and data analysis. JL wrote the first draft of the manuscript.
Funding
This work was supported by the National Research Foundation of Korea (NRF) grant funded by the Korea government (MSIT) (No. RS-2023-00212182).
Informed consent
No patient consent was required for this study. All data used in this study were obtained from a public open database and data that complete anonymity guaranteed.
Declaration of conflicting interests
The authors declared no potential conflicts of interest with respect to the research, authorship, and/or publication of this article.