
Abstract
Objective
The purpose of this study was to determine if patients with hypertension could better self-manage their disease by using automated mHealth including health coaching.
Background
A mobile health (mHealth) coaching app called HyperCoach was developed to help patients self-manage their hypertension.
Method
Participants with hypertension were provided a blood pressure monitor and weight scale that communicated with an mHealth app via Bluetooth to deliver health coaching for hypertension. The first 30 days of the study involved a health awareness phase that informed the participants of the daily status of their hypertension. The second 30-day phase initiated an automated health coaching plan developed in collaboration with the American Heart Association. Blood pressure, heart rate, weight, health-related quality of life and health literacy were measured.
Results
Thirty-four participants completed the study. Results showed no significant improvements in outcomes during the health awareness phase; however, during the health coaching phase there was a significant reduction of systolic blood pressure from 136.3 to 130.8 mmHg as well as diastolic blood pressure from 85.1 to 81.2 mmHg. Participants’ quality of life score significantly increased from 68.4 to 74.6, and hypertension health literacy score increased from 74.7% to 85.2%.
Conclusion
Our study found that providing health coaching information in conjunction with daily blood pressure values may encourage individuals with hypertension to change their health-related behaviors. Despite the potential positive impact of digital coaching on global hypertension management, more work is warranted to account for varied cultural and demographic variables.
Application
mHealth apps may assist patients with hypertension in self-managing their disease.
Introduction
Hypertension is a chronic disease affecting more than 100 million adults in the United States. 1 Uncontrolled hypertension can lead to the development of other chronic health conditions including heart disease, stroke, kidney disease, complications in pregnancy, and cognitive decline later in life. 2 Total annual medical costs associated with hypertension in the United States have been projected to exceed $220 billion annually by 2035. 2 In addition, healthcare services were estimated to cost approximately $2500 more per year for people with hypertension compared to those without hypertension. 2
Hypertension can be attributed partly to unhealthy lifestyle choices, such as a poor diet and sedentary lifestyle, and health conditions such as diabetes and obesity. 3 Health coaching has been increasingly utilized in the past decade for adopting healthy lifestyles, mostly related to nutrition and weight loss. Health coaching is a patient-centered process that focuses on changing health-related behaviors and includes goal-setting, education, encouragement, and feedback. 4 Health coaching is traditionally conducted by a trained health coach through periodic interaction with a patient; 5 however, recent years have seen an increasing trend in digital health coaching for hypertension using mobile devices. 6 Applications of mobile computing and communication technologies in healthcare, commonly referred to as mobile health (mHealth), can facilitate data collection and enable self-management of chronic conditions. 7
A systematic review of mHealth apps for hypertension self-management found that patient education or health recommendations were only included in three studies, highlighting the need for further research on behavior coaching for hypertension self-management. 6 However, few studies utilized mHealth interventions for hypertension combined with health coaching, albeit with promising results. One recent pilot study of an mHealth intervention utilized a smartphone app and Bluetooth-enabled devices to track blood pressure (BP), heart rate (HR), weight, and physical activity, alongside a diet log for tracking food intake, remote monitoring, and health coaching provided by a human coach. 8 Findings from this study indicated that an mHealth app for promoting healthy behaviors was feasible and engaged participants; however, the study did not find a significant improvement in physiological outcomes for systolic or diastolic BP (SBP, DBP), HR, or weight. 8 Another recent study of an mHealth intervention for hypertension in an underserved community utilized a Bluetooth-enabled BP device and a smartphone app for monitoring and tracking BP and weekly follow-up with the patient by a healthcare provider. 9 Findings showed a significant improvement in SBP in the intervention group and an increased motivation for a patient to self-monitor their BP and to engage with the mHealth technology. 9 Despite these promising studies, most involved health coaching by a human coach, while the application of automated digital health coaching to hypertension care seems largely absent. A systematic review of 11 randomized controlled trials evaluating the use of mHealth for the self-management of hypertension found that all included some form of human interaction and intervention. 10 Similarly, a scoping review of nine studies combining mHealth and health coaching for self-managing chronic diseases found that all included intervention by a human coach. 11
Consequently, we conducted a longitudinal home study between January 2021 and May 2021 to evaluate the feasibility and early outcomes evaluation for HyperCoach, an iOS mHealth app designed to deliver health coaching for hypertension, in collaboration with the American Heart Association (AHA). We previously reported the effects of the intervention on users’ beliefs and intention to use the app, as well as on user adoption of the technology and their corresponding clinical outcomes. 12 However, the analyses of clinically meaningful health outcomes were at the time of that report preliminary. Therefore, this article aims to further report on whether patients with hypertension could better self-manage their disease by using mHealth combined with digital health coaching.
Methods
Study design
We used a case-control design that consisted of two 30-day phases comprising a health awareness phase and a health coaching phase, as previously described. 12 The first phase of the study involved a self-measured blood pressure (SMBP) program. The goal of this phase was to make patients more aware of their hypertension health status through the daily monitoring and feedback of their BP, HR, weight, and daily step values in numerical and trend chart formats. The second phase involved digital health coaching in addition to daily monitoring. The health coaching provided by this intervention was fully automated with no direct interaction by a human health coach. The study was approved by the Institutional Review Board of Texas A&M University (IRB2019-1070); participants gave written informed consent.
Participants
Thirty-five patients were recruited from a large university community in Texas (as described previously 12 ). Recruitment material was sent through the university bulk email system using a snowballing technique to increase the sample size. Participants were eligible if they were at least 18 years of age, English-speaking, had a primary diagnosis of hypertension, were taking medication to control their hypertension, and owned an iOS smartphone with a data plan. Participants with resistant hypertension or more than two comorbidities determined by the Charlson Comorbidity Index 13 were excluded.
Intervention—mHealth coaching
The intervention for this study consisted of the mobile application (HyperCoach) that delivered an AHA-endorsed 30-day hypertension coaching plan and two devices: an Indie Health Bluetooth-enabled weight scale and an Indie Health Bluetooth-enabled blood pressure cuff. Both devices are FDA 510(k) compliant, and the cuff is clinically validated by the American Medical Association's Validate BP program. Figure 1 provides an overview of the mHealth intervention for the two different phases of the study.
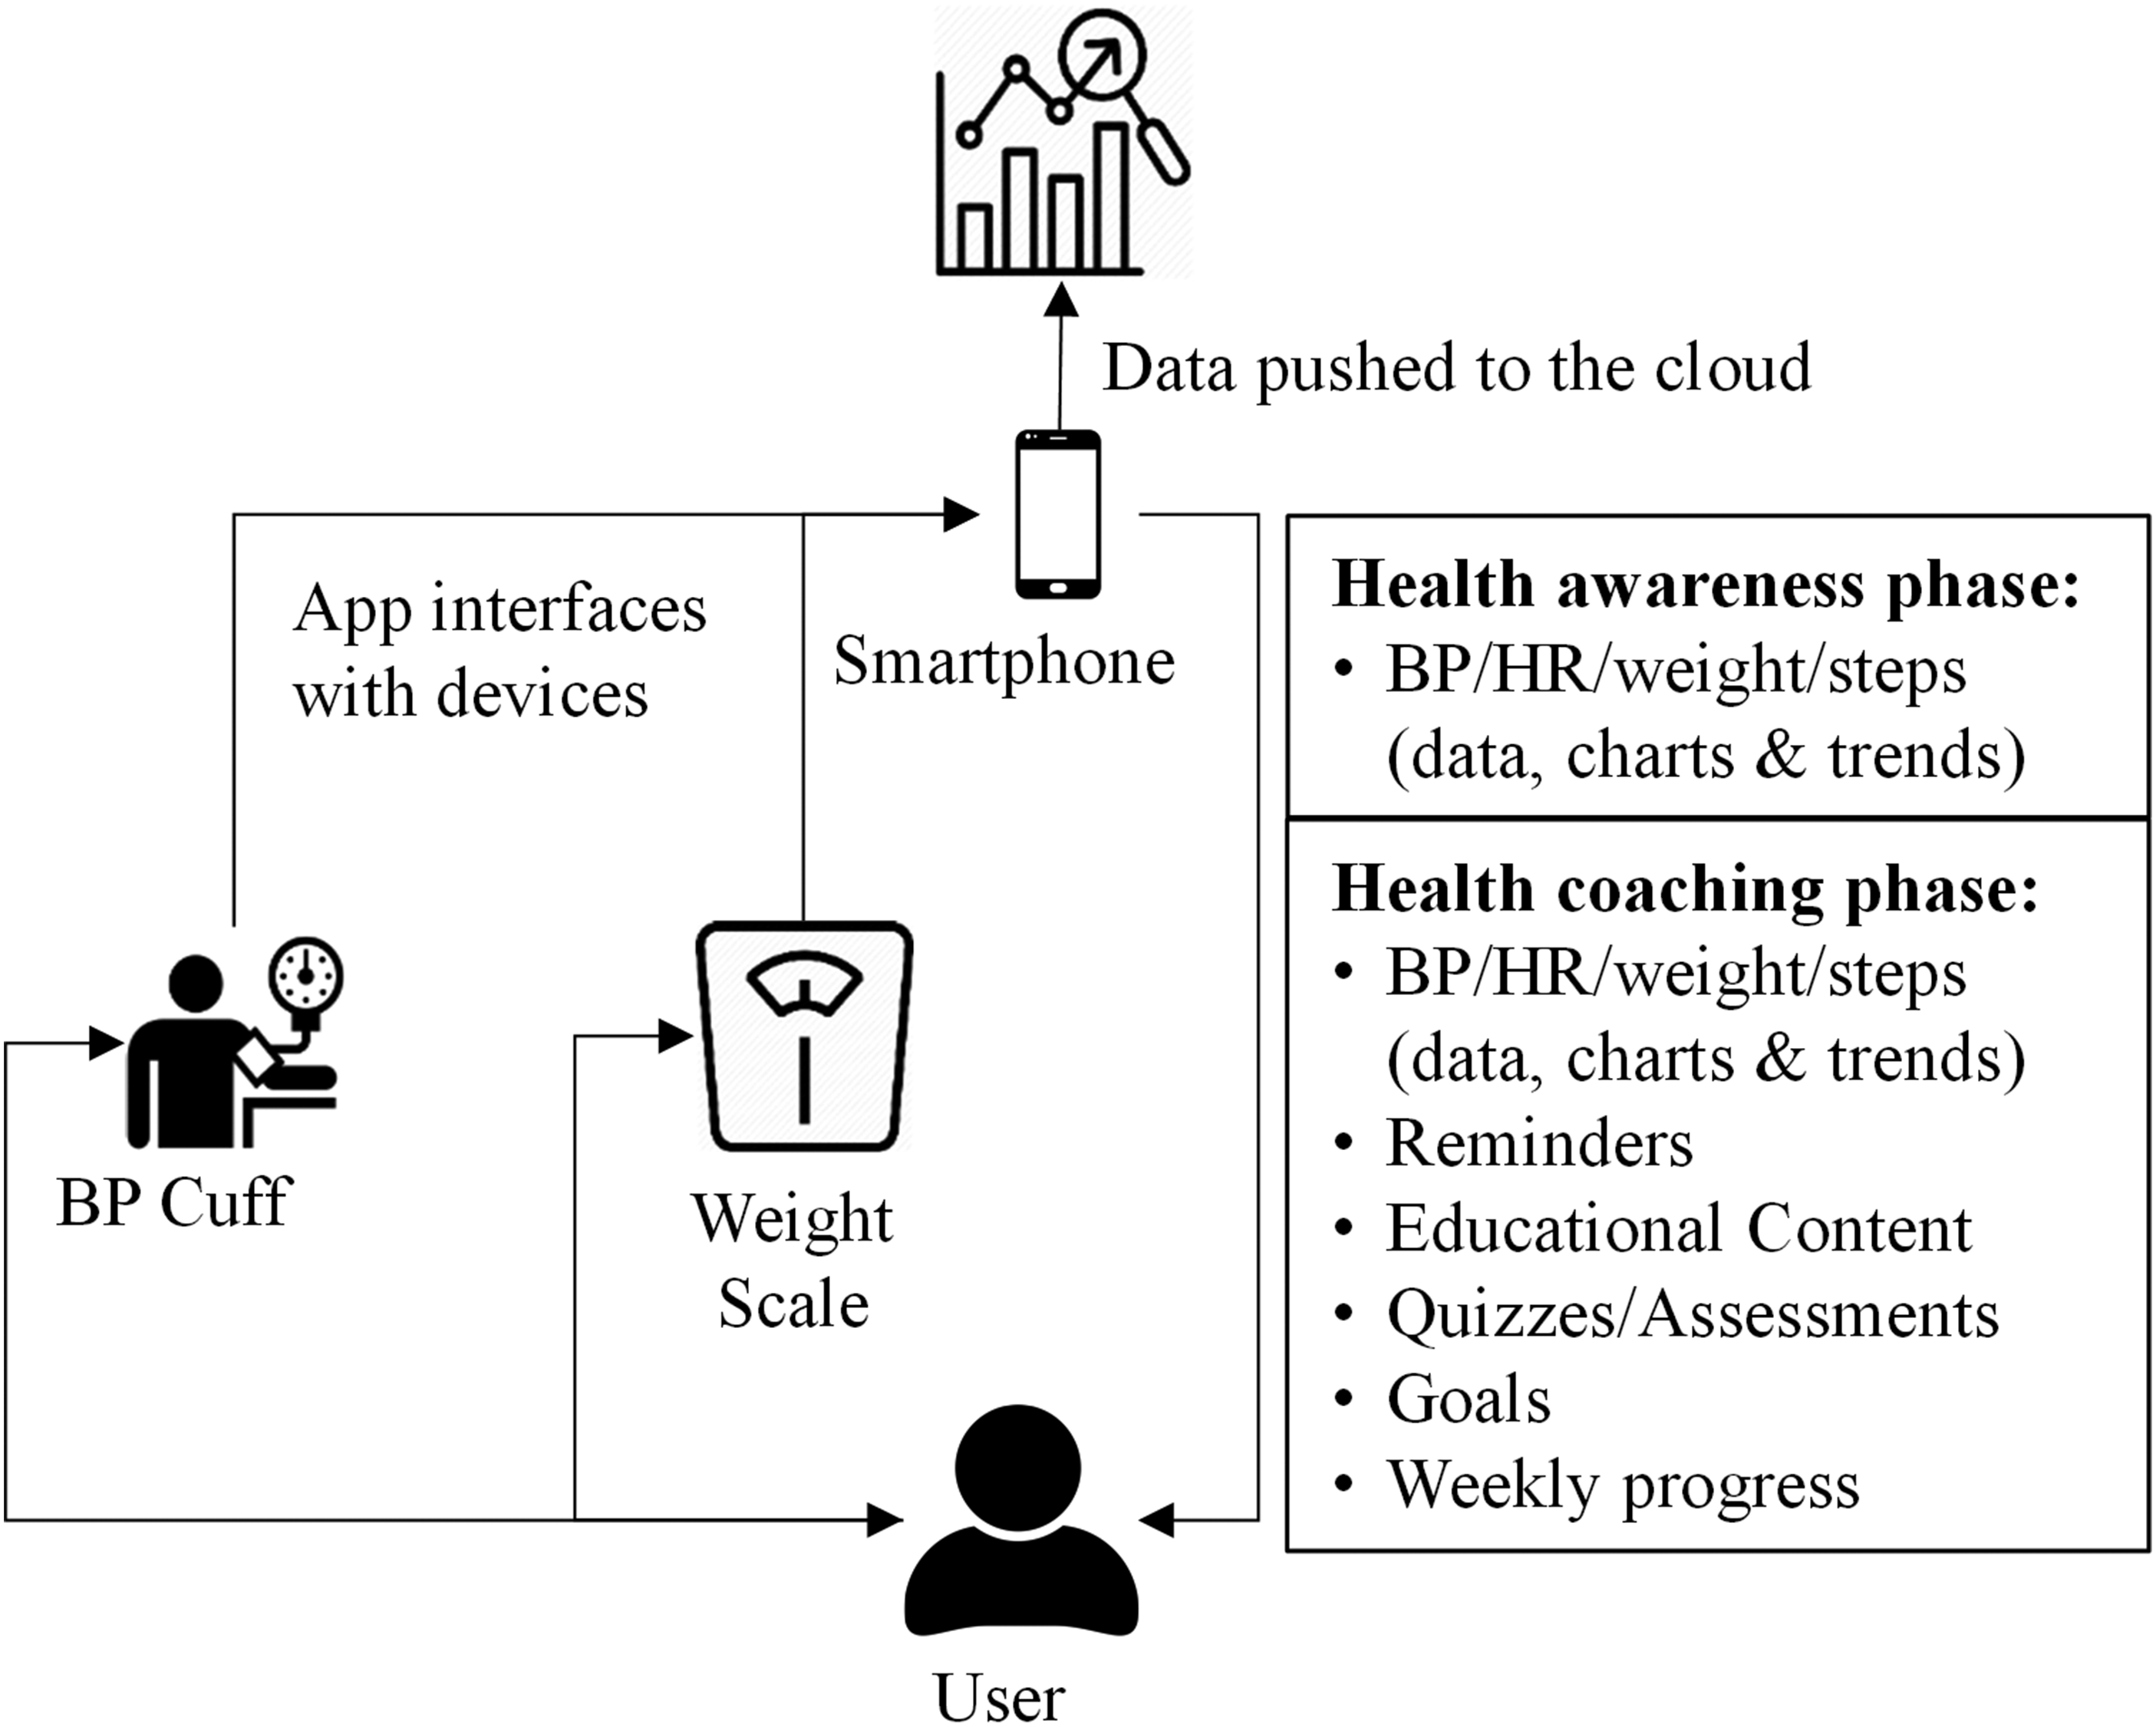
Overview of HyperCoach mHealth intervention.
Coaching plan
In consultation with the AHA, we designed a novel 30-day health coaching plan based on the AHA's 12-week hypertension CarePlan. 14 The HyperCoach plan included daily physiological monitoring (BP, HR, and weight) and pushed daily coaching content using the HyperCoach app. The health coaching content included daily reminders to perform BP and weight measurements; the establishment of goals; AHA educational content comprising short videos and one-to-two-page brochures on BP, BP monitoring, hypertension stages, ways to self-manage hypertension, recommended physical activity goals, information on food intake, and other healthy lifestyle changes for improving and maintaining a healthy BP; weekly multiple-choice quizzes on the educational material; and weekly progress reports. There was no specific communication between the patient and their healthcare team as part of this study; patients interacted with their physicians independently of the study protocol, and no medication adherence prompts were pushed to the patients.
Hypercoach
The main features of the HyperCoach app were a calendar of activities, list of daily tasks, and overview widgets for daily BP, HR, weight, and step values, including averages and trends (Figures 2–4). Participants had access to a “My Plan Calendar” widget (Figure 2(a)) through which they could review tasks for a given day such as BP and weight measurements as well as coaching tasks. A green checkmark next to the activity in the Tasks section indicated completion for that day (Figure 2(b)). Educational content such as articles or videos were interactive (e.g. ability to zoom in/out) and optimized for mobile displays. Participants could also interact with the widgets to view a “Dashboard” display (Figure 2(b)) showing their daily values of BP, HR, weight, and step count. We utilized a user-centered design process for HyperCoach that included two formative usability testing studies.

Hypercoach app “My Plan Calendar” and “Dashboard” widgets.

Hypercoach app “Blood Pressure” and “Heart Rate” widgets.

Hypercoach app “Weight” and “Steps” widgets.
The “Blood Pressure” widget (Figure 3(a)) showed the range of BP readings over the previous 90 days; trend of BP readings for the last seven days color-coded as normal (green), elevated (yellow), and Stage 1 (orange) or Stage 2 hypertension (red); the AHA-recommended BP goal of 120/80 (represented as green horizontal lines); the latest BP value; and the weekly average BP value. Similar widgets were provided for HR (Figure 3(b)), weight (Figure 4(a)), and daily steps (Figure 4(b)).
Data management
The HyperCoach app was connected to a cloud storage server hosted on Amazon Web Services. Measurement data (SBP, DBP, HR, and weight) were uploaded in real-time; the current cumulative daily step count was uploaded each time the app uploaded new data. In addition, time spent interacting with the coaching material (time spent on each task and task completion) was recorded and uploaded to the cloud storage. Quality monitoring of the data was accomplished through daily checks by team members, including participant follow-up if warranted (i.e. missing data for a given period).
Study procedure
Due to the COVID-19 pandemic, this study was conducted virtually. Devices were shipped to participants and researcher–participant interactions were conducted virtually. These four separate interactions included: (1) the onboarding session, during which informed consent was obtained and inclusion/exclusion criteria verified; (2) the installation of a limited version of the HyperCoach app on their mobile device, a walkthrough of the measurement devices and the app, verification that the app was synced to the cloud, and a review of study requirements to monitor their BP and weight daily; (3) the transition from the health awareness phase to the health coaching phase with a walkthrough of the various coaching features enabled on the HyperCoach app; and (4) an exit interview to obtain feedback on the study and the HyperCoach app.
During the health awareness phase, participants were instructed to measure their BP and weight daily under similar physiological conditions. We suggested that they measure these values after awakening and using the restroom and before eating or engaging in physical activities for the day. Participants received feedback via HyperCoach in numerical and trend chart formats for their BP, HR, weight, and step count readings. No other forms of health coaching were provided during this phase.
During the health coaching phase, participants were provided the full coaching content of the HyperCoach app for the self-management of hypertension. In addition to the daily BP and weight measurements tasks, participants were assigned a daily coaching task to either watch an educational video, read an information brochure, take a multiple-choice quiz on that week's educational material, review weekly progress, respond to an assessment regarding their progress, or set goals for the upcoming week. The daily coaching task(s) could be performed anytime during the day, and the educational material was available on demand for future reviews.
Outcome variables
Clinical outcomes, health-related quality of life, health literacy, compliance, engagement and usability were assessed.
Clinical outcomes
SBP, DBP, HR, and weight (to calculate body mass index (BMI)) were measured daily to assess changes during each phase of the study. Measurements from both devices (BP Cuff and weight scale) were uploaded automatically to HyperCoach.
Health-related quality of life
Health-related quality of life (HRQOL) is a state of mind regarding how someone perceives their health status and not merely the absence of diseases. 15 HRQOL was measured at the beginning of the study, after the health awareness phase and after the health coaching phase using the 36-Item Short Form Health Survey (SF-36). 16 HRQOL scores can range from 0 to 100 with higher scores representing better quality of life.
Health literacy
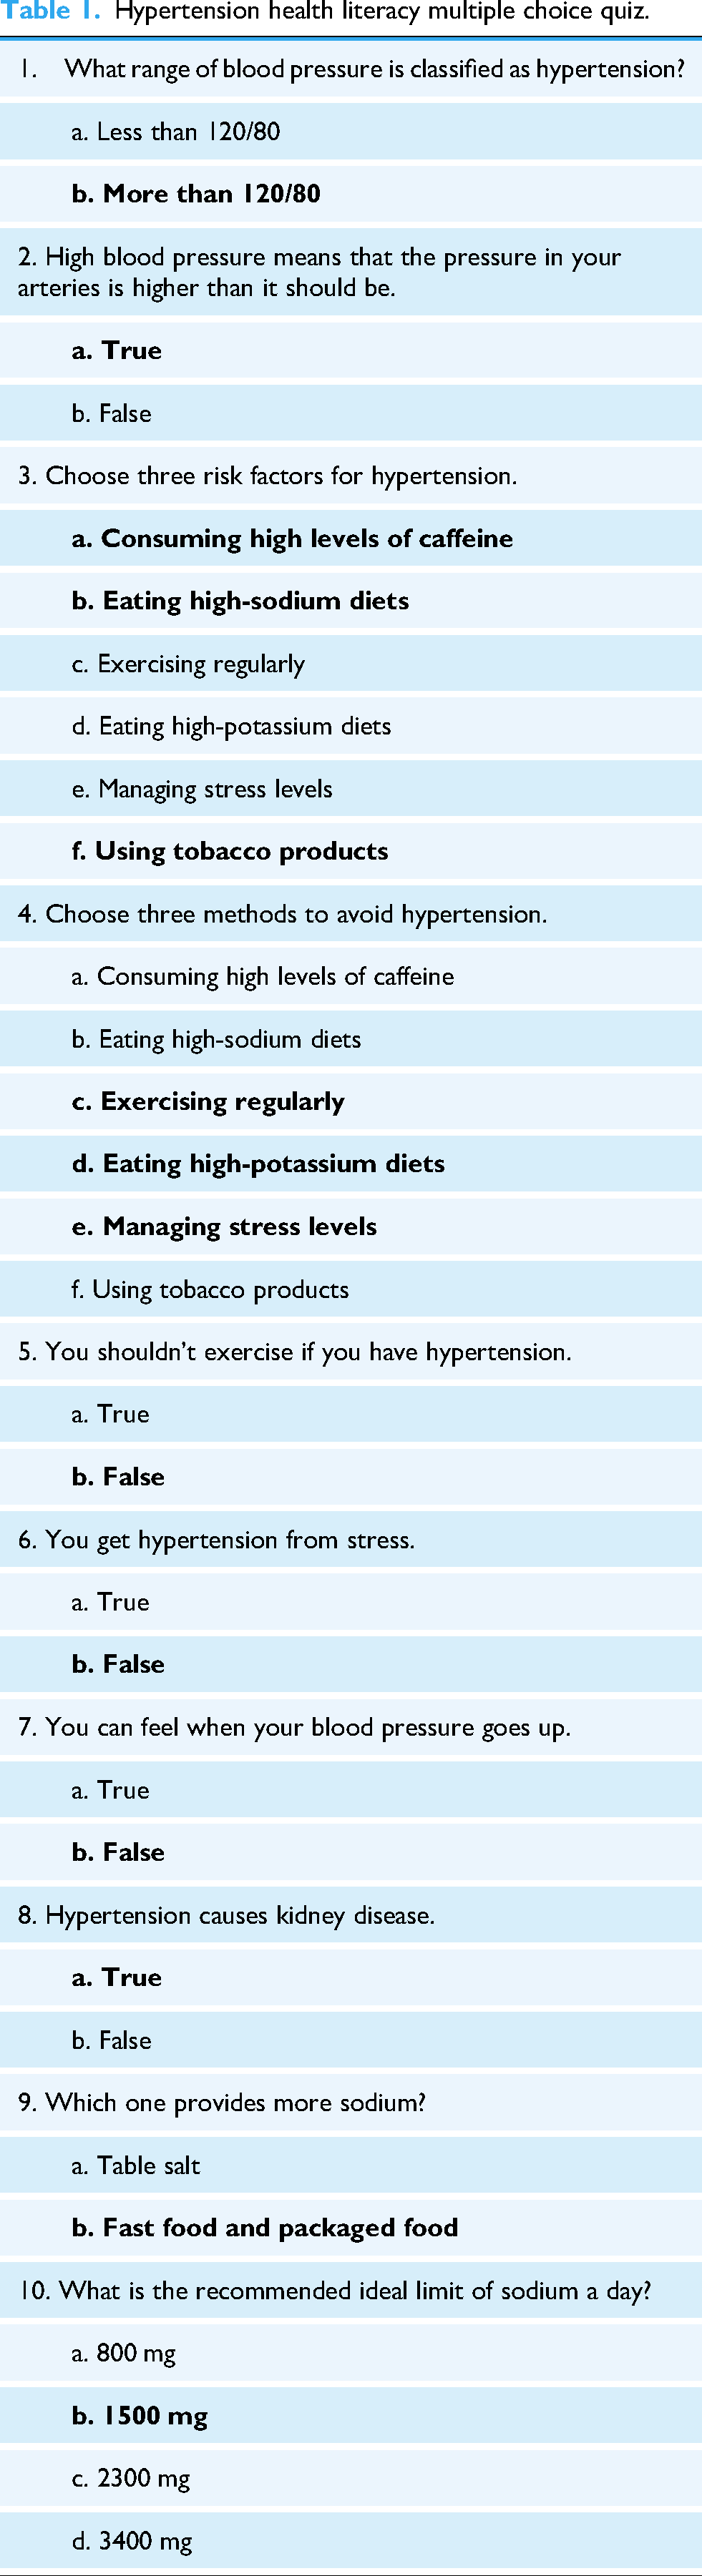
Hypertension health literacy was assessed at the beginning of the study, after the health awareness phase, and after the health coaching phase using a 10-question multiple choice quiz developed in consultation with the AHA (Table 1). Hypertension health literacy was calculated based on the percentage of correct responses to the quizzes. General health literacy was assessed after the health awareness phase and after the health coaching phase using the Short Assessment of Health Literacy-English (SAHL-E) test. 17
Hypertension health literacy multiple choice quiz.
Compliance and engagement
Participant compliance with daily measurements was assessed during both study phases by calculating the percentage of days they performed the BP and weight measurements. Participant engagement with the coaching material was assessed during the coaching phase as the time spent reviewing coaching material and percentage of total coaching tasks completed.
Usability assessment
Interviews were conducted with participants upon study completion to obtain feedback on the study and the HyperCoach app. Usability of the HyperCoach app was assessed using the System Usability Scale (SUS). 18 Participants rated the app by responding to 10 questions on a 5-point alternate response Likert continuum (from strongly disagree to neutral to strongly agree; see Figure 5). Responses were converted to a score from 0 to 100. Higher scores were associated with better usability.

System usability scale.
Statistical analysis
Changes in all outcomes were compared after each phase of the study with the preceding measurement or score using paired t-tests (e.g. Mid vs Pre and Post vs Mid). A one-way analysis of variance (ANOVA) was performed to determine the individual effect of demographic variables on the changes in the mean values of SBP, DBP, BMI, HRQOL, and hypertension health literacy. In addition, user feedback on the overall study and the HyperCoach app was obtained at the end of the study.
Results
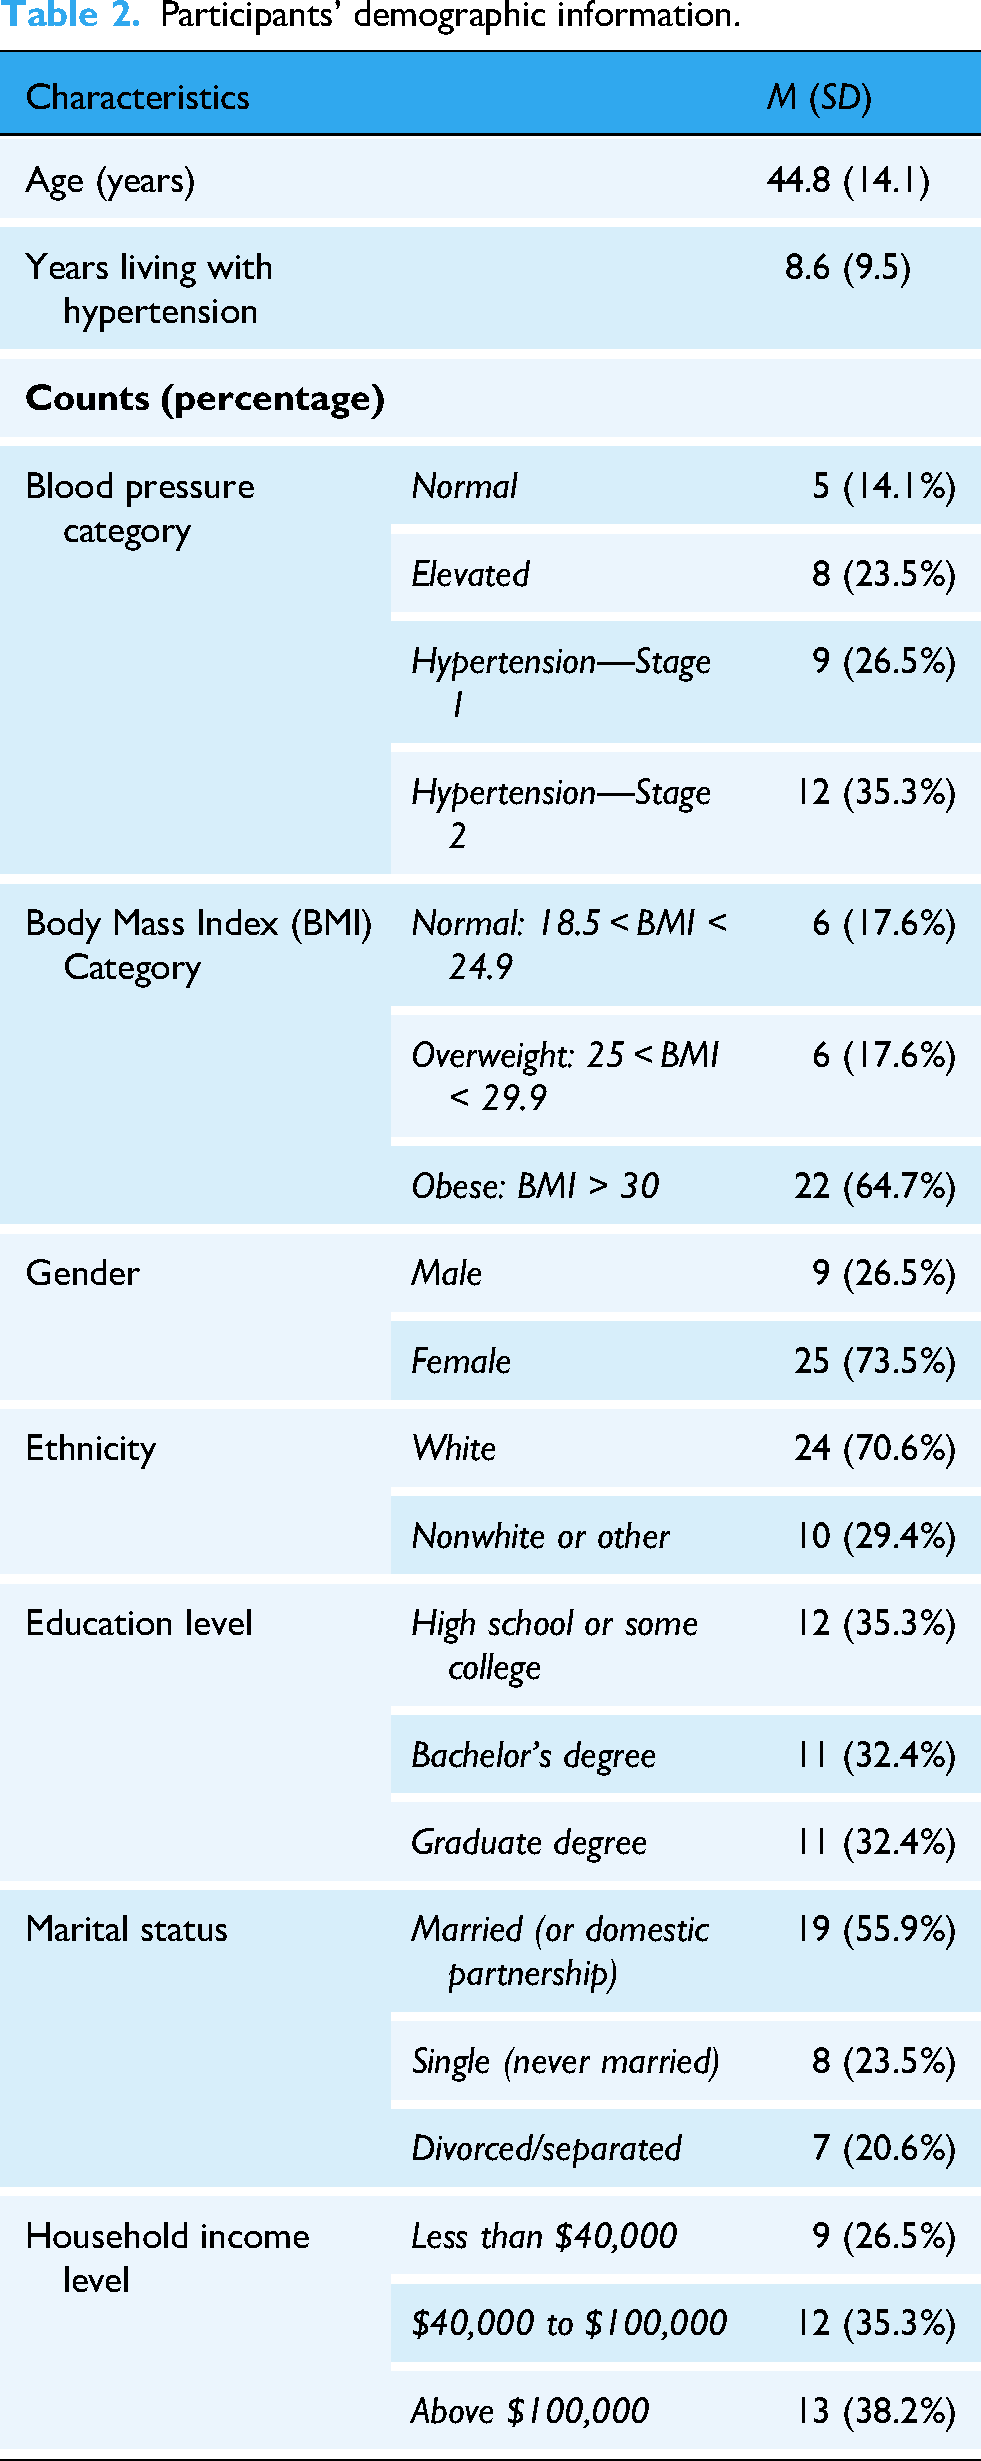
One female participant dropped out of the study at the midpoint leaving a total of 34 participants (25 females and nine males) who completed both phases of the 60-day study with a mean age of 44.8 years (SD = 14.1; range: 19–79), mean baseline SBP of 136.3 (SD = 18.4), mean baseline DBP of 84.2 (SD = 11.4) and mean baseline BMI of 32.0 (SD = 6.9). Additional demographics for the participants in this study are listed in Table 2.
Participants’ demographic information.
Outcomes
Table 3 provides a summary of the means and paired sample t-test results for the changes in SBP, DBP, BMI, HRQOL, hypertension health literacy, and general health literacy at the different stages of the study. Statistically significant changes (per t-test) in the health coaching phase were found for SBP, DBP, mean HRQOL, and mean health literacy, as detailed below.
Summary of outcomes for clinical measures, quality of life, and health literacy.
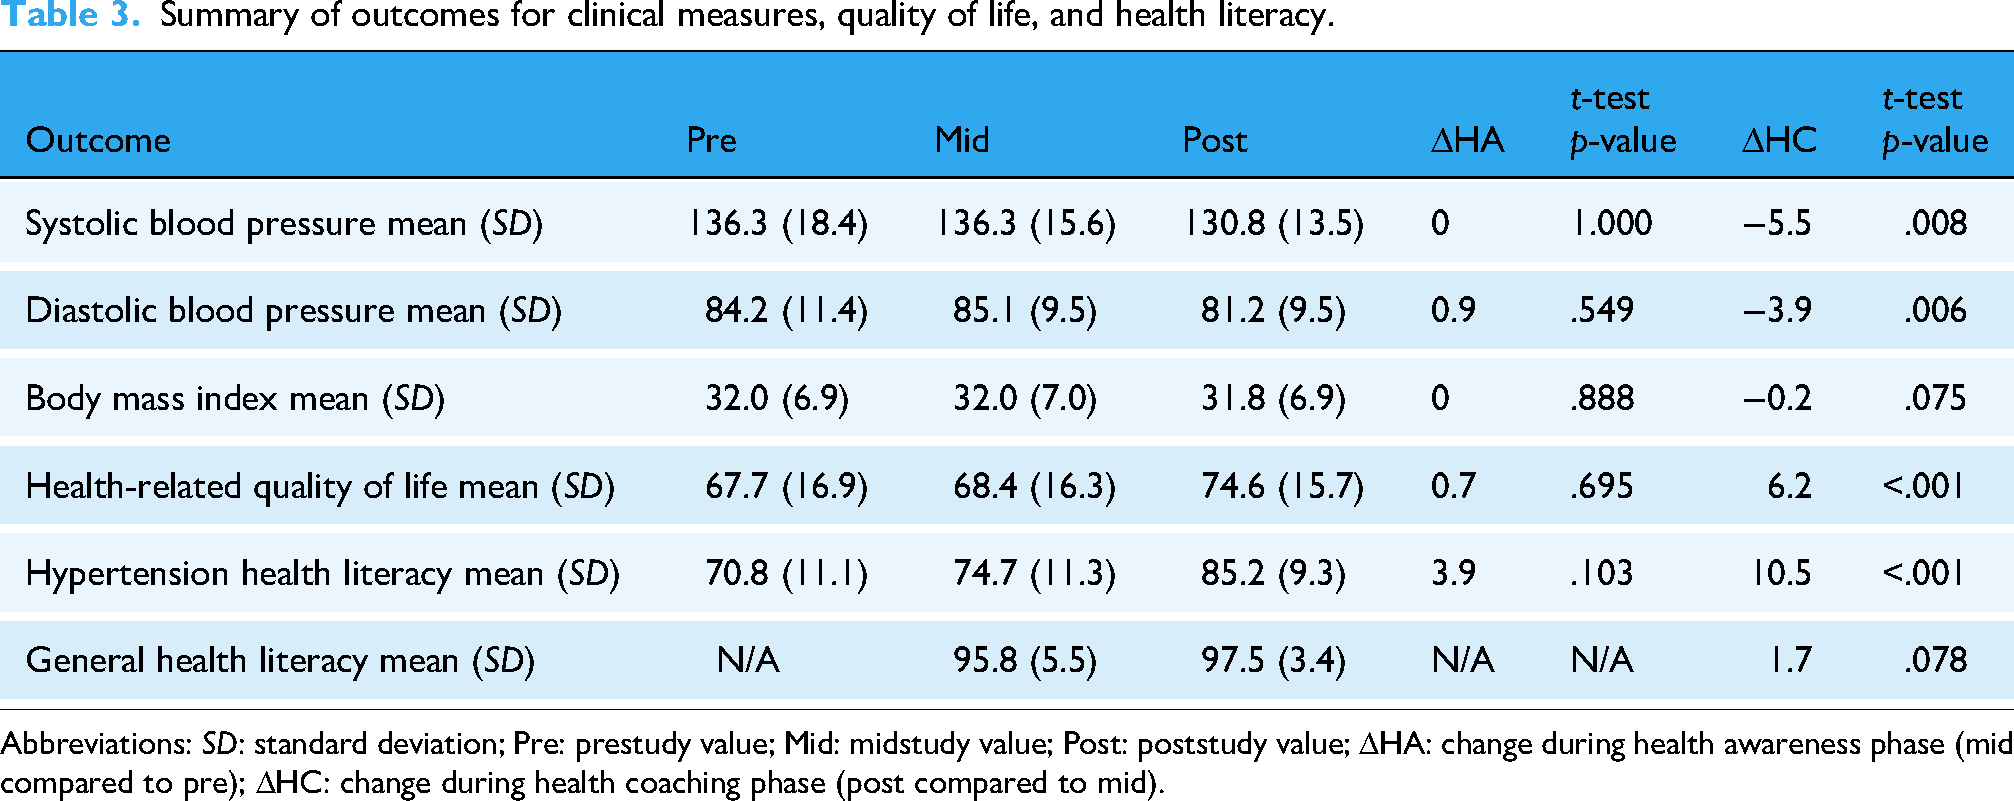
Abbreviations: SD: standard deviation; Pre: prestudy value; Mid: midstudy value; Post: poststudy value; ΔHA: change during health awareness phase (mid compared to pre); ΔHC: change during health coaching phase (post compared to mid).
Clinical outcomes
The mean values of SBP, DBP, and BMI for the participants at baseline, midstudy and poststudy were compared. Figure 6 shows the mean SBP values for the participants at the beginning of the study, after the health awareness phase and after the health coaching phase of the study. Participants’ mean SBP value did not change during the health awareness phase but showed a statistically significant decrease from 136.3 (standard deviation (SD) = 15.6) to 130.8 (SD = 13.5) during the health coaching phase (t(33) = 2.840, p = .008) with a medium effect size (d = 0.49 95% CI [0.13−0.84]). Figure 7 shows the mean DBP values for the participants at the beginning of the study, after the health awareness phase and after the health coaching phase of the study. Mean DBP increased slightly from 84.2 (SD = 11.4) to 85.1 (SD = 9.5) during the health awareness phase but showed a significant decrease from 85.1 (SD = 9.5) to 81.2 (SD = 9.5) during the health coaching phase (t(33) = 2.916, p = .006) with a medium effect size (d = 0.50 95% CI [0.14−0.85]). The participants’ mean BMI value did not change during the health awareness phase but showed a nonsignificant decrease from 32.0 (SD = 7.0) to 31.8 (SD = 6.9) during the health coaching phase.
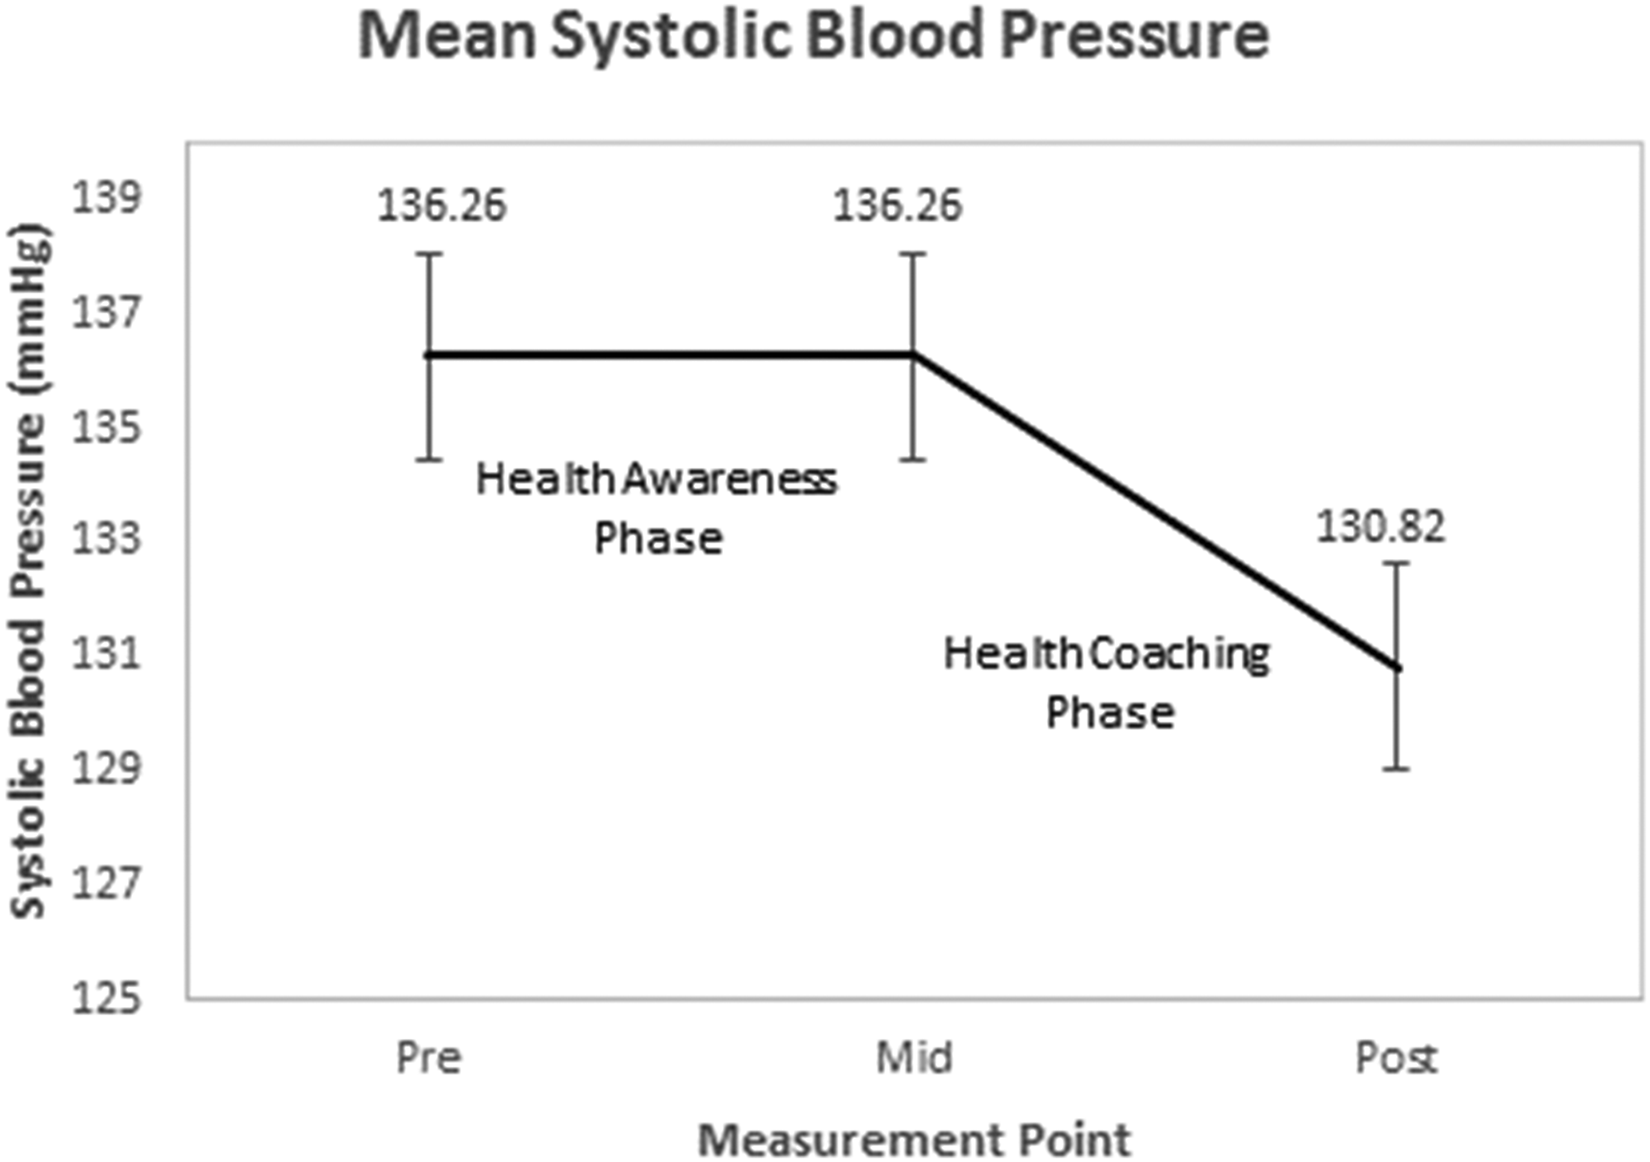
Systolic blood pressure results.

Diastolic blood pressure results.
Health-related quality of life
Figure 8 shows the mean HRQOL scores for the participants at baseline, after the health awareness phase and after the health coaching phase of the study. Participants’ mean HRQOL score showed a nonsignificant increase from 67.7 (SD = 16.9) to 68.4 (SD = 16.3) during the health awareness phase but a statistically significant increase from 68.4 (SD = 16.3) to 74.6 (SD = 15.7) during the health coaching phase (t(33) = −5.040, p < .001) with a large effect size (d = −.86, 95% CI [(−1.26)−(−0.46)]).
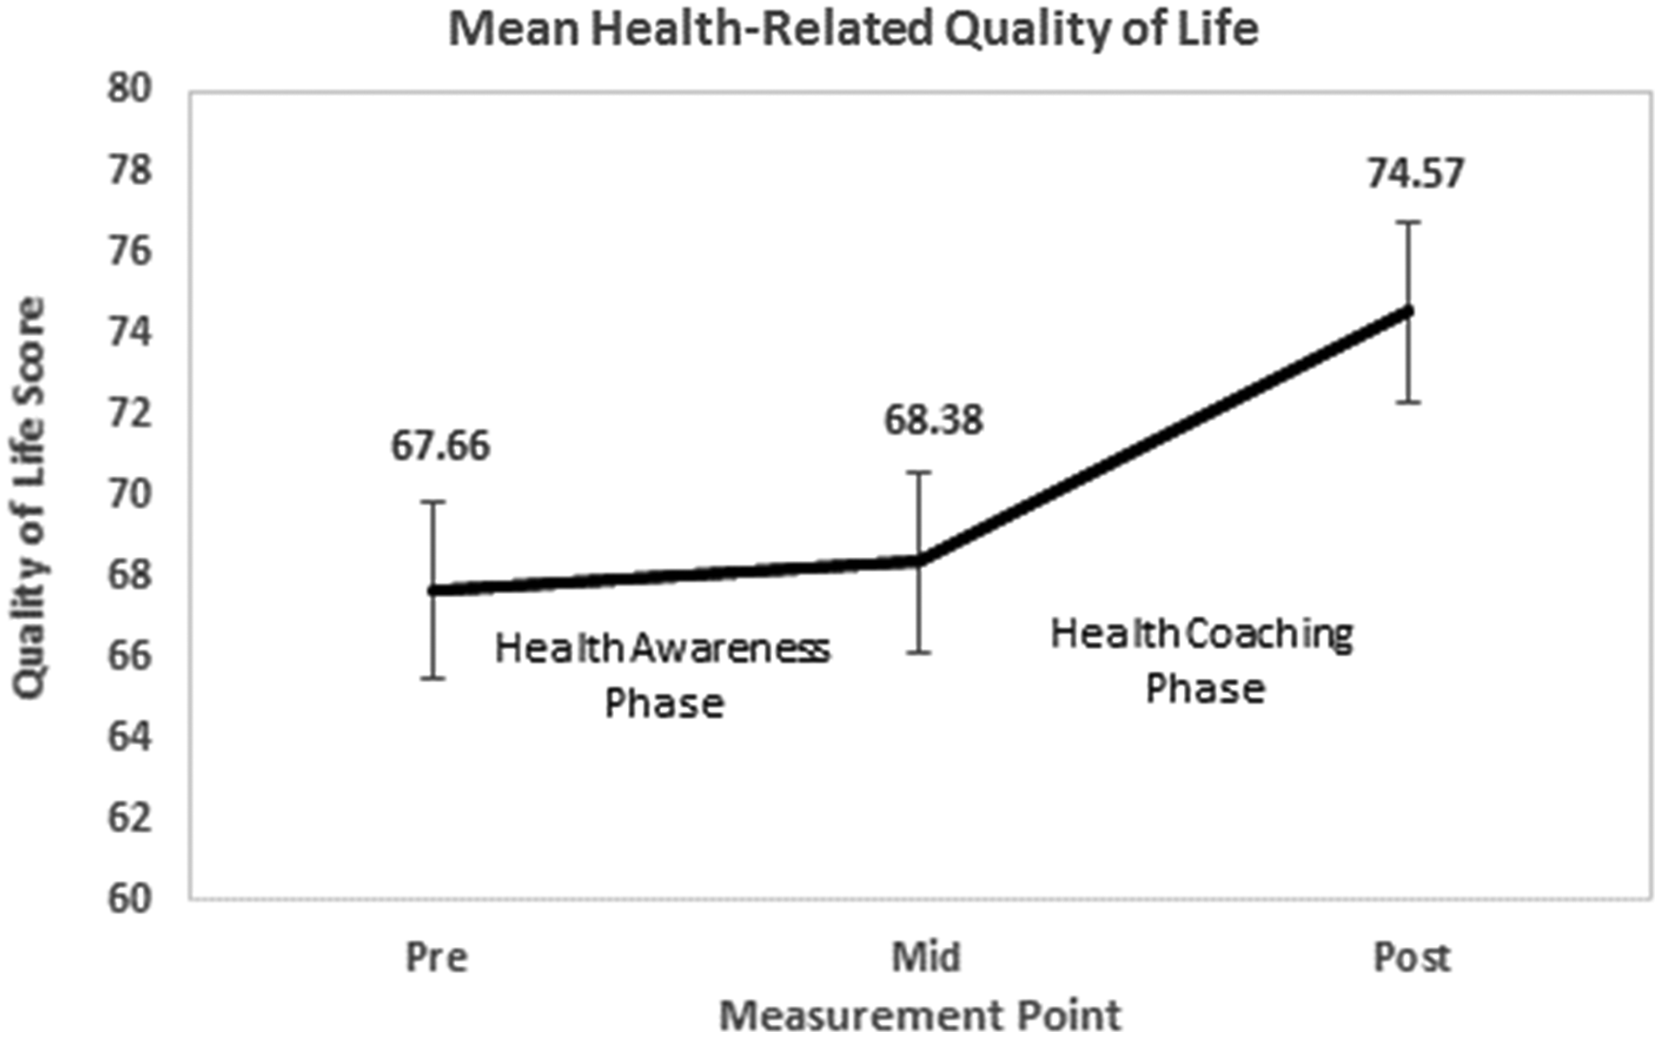
Health-related quality of life results.
Health literacy
Figure 9 shows the mean hypertension health literacy scores for the participants at baseline, after the health awareness phase and after the health coaching phase of the study. Participants’ mean score for knowledge of hypertension showed a nonsignificant increase from 70.8% (SD = 11.1) to 74.7% (SD = 11.3) during the health awareness phase but showed a statistically significant increase from 74.7% (SD = 11.3) to 85.2% (SD = 9.3) during the health coaching phase (t(33) = −5.037, p < .001) with a large effect size (d = −.86, 95% CI [(−1.25)−(−0.46)]). The participants’ general health literacy was assessed midstudy and poststudy. Mean score for general health literacy showed a nonsignificant increase from 95.8% (SD = 5.5) to 97.5% (SD = 3.4) during the health coaching phase. All participants scored high (above 14/18) on the SAHL-E test, so no additional analysis of this metric was performed.
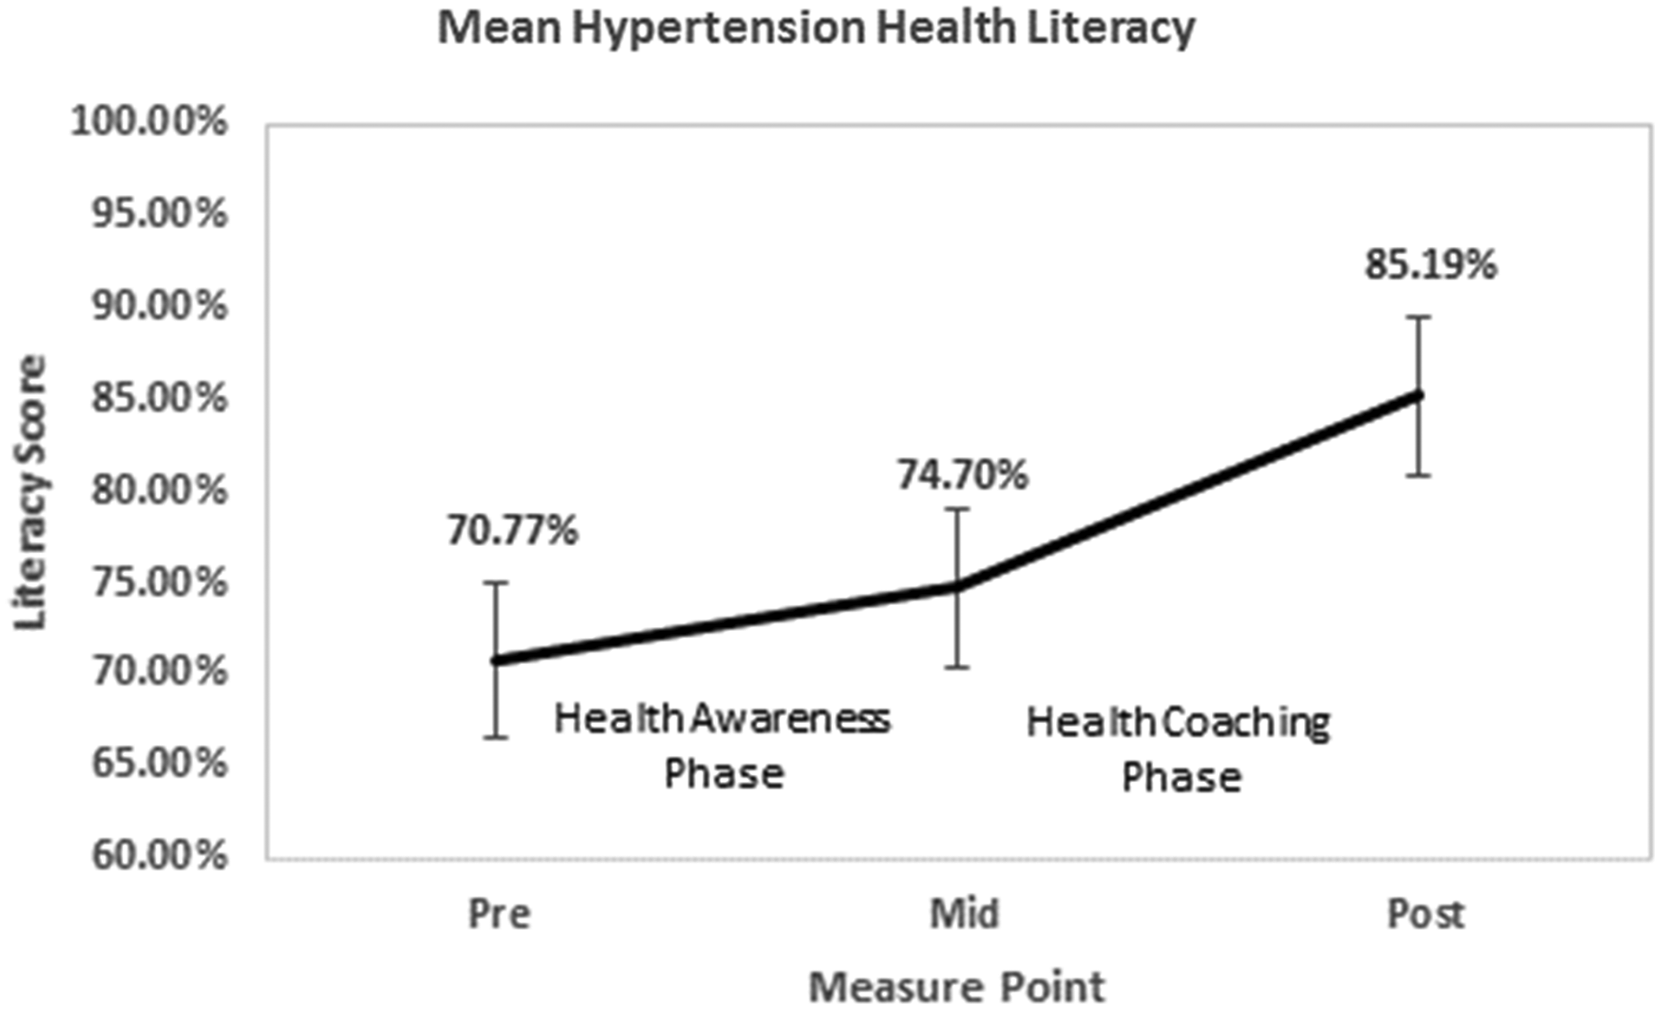
Hypertension health literacy results.
Analysis of variance
One-way ANOVA was performed to determine the individual effect of demographic variables listed in Table 2 on the changes in the mean values of SBP, DBP, BMI, HRQOL and hypertension health literacy. Table 4 summarizes the variables with significant effects.
Overview of the effects of demographic variables on outcomes.

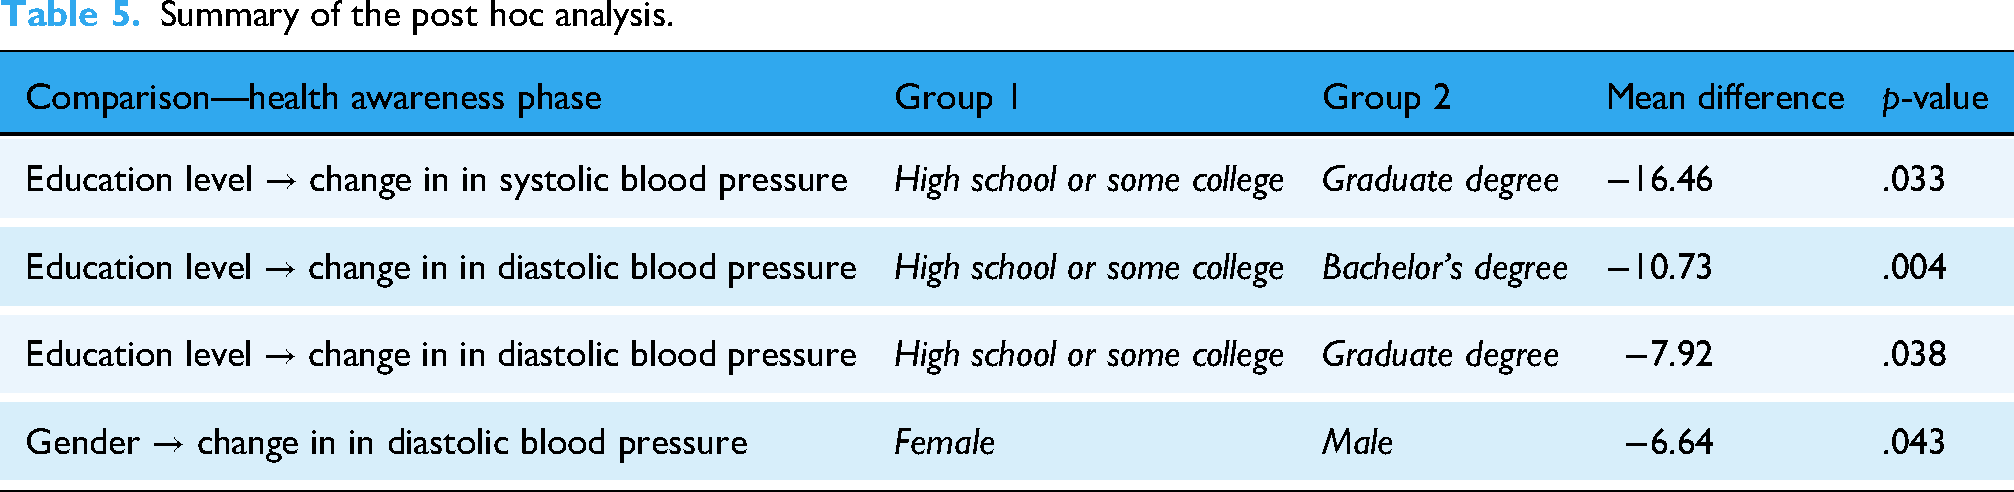
Tukey's Honestly Significant Difference post hoc analysis resulted in four instances where a significant difference was found between education and gender groups. Table 5 lists the results of the post hoc analyses with significant results.
Summary of the post hoc analysis.
Initial blood pressure category
During the health awareness phase, participants’ initial blood pressure category was a significant predictor of both the change in mean SBP value (F(1,32) = 6.02, p = .02) and the change in mean DBP value (F(1,32) = 9.83, p = .02). Conversely, during the health coaching phase, participants’ initial blood pressure category only predicted the change in mean SBP value (F(1,32) = 4.15, p = .05). A review of the participants’ mean SBP and DBP values showed that only participants in hypertension stage 2 showed a decrease in mean SBP and DBP value during the health awareness phase. However, during the health coaching phase, the mean SBP and DBP values showed a decrease for participants in the elevated, hypertension stage 1 and hypertension stage 2 categories.
Education level
During the health awareness phase, the main effect of participants’ education level on the change in mean SBP value was significant (F(1,32) = 7.12, p = .012). Post hoc analysis indicated that the change in SBP was significantly better for participants with a graduate degree (M = −6.5, SD = 14.7) than for participants without a bachelor's degree (M = 9.9, SD = 15.5). During the health awareness phase, the main effect of education level on the change in mean DBP value was significant (F(1,32) = 6.02, p = .020). Post hoc analysis showed that the change in DBP was significantly better for participants with a bachelor's degree (M = −3.8, SD = 9.0) or a graduate degree (M = −1.0, SD = 6.1) than for participants without a bachelor's degree (M = 6.9, SD = 6.6). The results showed that during the health awareness phase, the mean DBP and SBP decreased only for participants with either a bachelor's or graduate degrees. However, during the health coaching phase, these values decreased regardless of education level.
Gender
During the health awareness phase, the effect of a participant's gender on the change in DBP was significant, F(1,32) = 4.46, p = .043. Post hoc analysis showed that the change in DBP was significantly better for males (M = −4.0, SD = 7.0) than for female participants (M = 2.6, SD = 8.4). Only male participants showed a decrease in mean SBP and DBP values during the health awareness phase. However, during the health coaching phase both males and female groups showed a decrease in mean SBP and DBP values.
Body Mass Index
During the health awareness phase, the main effect of participants’ BMI on the change in hypertension health literacy was significant (F(1,32) = 4.72, p = .037). However, post hoc analysis did not find any significant differences in the change in hypertension health literacy between the participant groups based on their BMI category.
Compliance and engagement
Average participants’ compliance with daily BP and weight measurements increased from 96.2% during the health awareness phase to 96.3% during the health coaching phase. Average engagement with coaching material averaged 100% during the health coaching phase.
Usability assessment
The mean SUS rating for the HyperCoach app was 93 (SD = 7) with a range of 67.5 to 100 (27 of 34 participants rated 90 or greater). A study of nearly 1000 SUS surveys correlated SUS scores with adjective ratings from “worst imaginable” for a SUS mean score of 12.5 to “best imaginable” for a SUS mean score of 90.9 (with a SUS mean score of 85.5 correlated with an adjective rating of “excellent”). 19 Thus, the SUS rating of the HyperCoach app was between “excellent” and “best imaginable” by the participants in our study.
Discussion
Our findings suggest that mHealth-enabled coaching shows promise in improving self-management of hypertension including positive trends in SBP, DBP, HRQOL, and patients’ hypertension literacy. Furthermore, most participants felt the intervention helped them manage their hypertension, improved their awareness and knowledge of their hypertension and made them more self-accountable for monitoring and/or managing their hypertension.
Our results showed that during the awareness phase which resembled a typical SMBP program with no coaching features, significant improvements to BP values were observed only for patients with the most severe condition (Stage 2). On the other hand, during the coaching phase, BP values improved significantly for most participants regardless of severity or education levels. These results align with recent reviews of mHealth interventions for self-management of hypertension6,10,20 which support the efficacy of utilizing mHealth interventions for self-management of hypertension. However, to our knowledge, this is the first study evaluating the effects of digital coaching with no human coach involvement on hypertension outcomes and engagement.
While we believe the coaching content in addition to health awareness contributed to changes in lifestyle choices including nutritional intake, our study did not show a significant change in BMI. This may be partly attributed to the short duration of the coaching phase of the study (30 days). This is consistent with a recent systematic literature review of the effect of mHealth on weight loss which reported an insignificant decrease in BMI at three months but a significant decrease in BMI at six months. 21 In addition, the AHA-based coaching material was targeted toward changes in lifestyle associated with hypertension control and not specifically for weight loss. 14
One of the contributions of this research is to assess the role of education and health literacy in investigating the efficacy of mHealth coaching to improve hypertension outcomes. Health literacy has been identified as a significant barrier limiting the patients’ ability to self-manage their healthcare. 22 A recent systematic review of the effects of mHealth-based interventions on health literacy concluded that mHealth inventions were effective in improving health literacy, particularly when patients are willing to receive mHealth-based interventions and are proficient with the operation of mHealth devices. 23 However, our results showed that improving awareness of patients’ health metrics through mHealth may only impact health literacy for those with higher levels of education (i.e. graduate degrees). On the other hand, improved awareness combined with mHealth coaching improved hypertension health literacy significantly regardless of education level. These findings concur with recent literature which suggests that the design of health information such as graphs and visualizations should account for the users’ literacy levels if not accompanied by coaching. 24
Similarly, while self-reported measures of patient HRQOL are often used in clinical trials to monitor patient response to an intervention, 25 this important holistic health measure has been rarely used in studies evaluating mHealth interventions. A recent study of mHealth interventions on the HRQOL for cancer patients showed positive improvements in quality of life; 26 however, we are not aware of any studies assessing HRQOL for hypertension mHealth interventions. More work is needed to verify if such changes in quality of life are sustainable over a longer period.
Sustainable effects of an mHealth intervention require an emphasis on designing for usability and engagement. For example, a study that evaluated patients’ engagement with mHealth technology for hypertension found that higher patient engagement with the intervention resulted in a significant reduction in BP. 27 A separate systematic literature review of mHealth interventions for cardiovascular disease using smartphone apps 28 found statistically significant weight reduction with higher user engagement with the app. We believe the surprisingly high engagement with our intervention was partly due to our user-centered and heuristic-based design and evaluation efforts that resulted in easy-to-perform measurements using Bluetooth-enabled devices, intuitive and immediate presentation of information in numerical and trend chart formats, and short (mostly 2–3 min) but informative educational content. A recent systematic literature review of design features for improving user engagement with mHealth interventions identified personalization, reinforcement, and communication as the most commonly cited app design features to improve user engagement. 29 Personalization was achieved in the HyperCoach app by applying personalized greetings, a function to allow users to set goals, personalized user feedback, and weekly progress reports. Reinforcement was achieved in the HyperCoach app via daily reminders, weekly quizzes that reinforce the educational material and congratulatory messages in the weekly progress report. While the app communicated tasks and health values, communication with healthcare professionals or peers was not included as part of the HyperCoach app as it was designed to be fully automated with no human intervention.
Despite the promise shown by the digital coaching intervention presented in this work, several challenges and barriers need to be addressed before the benefits of such interventions can be realized in a wider spectrum of demographics globally. For example, additional demographic and cultural variables such as language may impact a population's risk of hypertension as well as how it is managed. 30 Other potential barriers in need of investigation are potentially high service costs and lack of affordability, low technology savviness and the need for customized education programs, potential impacts on established clinical workflows, and the need for additional resources such as human coaches or connecting such interventions with care. In addition, given the high prevalence of comorbidity between hypertension and diabetes and the importance of lifestyle changes for both, similar interventions may have a positive impact on diabetes outcomes. Future work may include comorbid patients in their trials or develop and evaluate similar interventions aimed at diabetes self-management.
Finally, this was a complex naturalistic study conducted virtually. This study serves as an example of how to adapt an in-person study to pandemic conditions precluding direct face-to-face interaction. The lessons learned from this adaptation make it a productive contribution to the literature on adapting human research studies to pandemic conditions.31–34
Limitations
This study has several limitations that may affect generalizability of findings. First, this study was conducted using a relatively small sample size. Second, recruitment was mainly focused on a university population. This may introduce representation bias toward more health literate populations as evidenced by the literacy assessment indicating that most participants had a high general health literacy based on the SAHL-E score, likely reflecting this demographic of college students or faculty or staff at the university. More work is needed to validate these findings using a larger and more diverse sample. Third, given the case-control design used in this study, some of the effects observed during the coaching phase might have been due to the buildup of confidence, increased trust, and observed benefits. Given the difficulties of conducting a longitudinal home study, the design did not use a real control group (i.e. a group with no intervention). Other designs such as between-subjects experiments can be conducted to help verify differences between the awareness and coaching. Fourth, while this study provides promising results for the effectiveness of digital coaching over a 30-day period, it is not clear if such effects sustain over longer periods of time. To address this limitation, work is in progress to assess a revised AHA-endorsed care plan to see if the reduction in BP can be sustained over a 90-day period. Finally, this study did not control for or measure patients’ daily behavior including medication adherence, nutrition intake, or exercise. More work is warranted to breakdown the key behavioral changes as a result of digital coaching to assess behavior change.
Conclusion
This study demonstrated that using mHealth to support health coaching can improve the self-management of hypertension. In addition, our study demonstrated that a carefully designed mHealth app grounded in user-centered design and human factors engineering principles can improve health literacy and engagement. Future planned work includes replication of this hypertension mHealth study with a larger sample size, longer duration, and inclusion of participants from low socioeconomic status communities. In addition, participants’ BP and BMI will be monitored for up to 90 days after the end of the coaching to check for compliance with daily measurements and sustainment of the effects of coaching. Additional future planned work includes incorporation of the mHealth coaching attributes of this hypertension study into similar mHealth interventions for hypoglycemia self-management, stress self-management, and mental health self-management.
Footnotes
Acknowledgments
This study was developed in conjunction with the American Heart Association Center for Health Technology and Innovation using coaching material developed as part of the American Heart Association's 12-week hypertension care plan. The authors thank Jacob M. Kolman, MA, ISMPP CMPP™, senior scientific writer at the Houston Methodist Academic Institute and senior technologist of the Texas A&M University Applied Cognitive Ergonomics Lab, for critical review and language editing on drafts of this manuscript.
Ethical considerations
The study was approved by the Institutional Review Board of Texas A&M University (IRB2019-1070).
Consent to participate
Participants gave written informed consent.
Funding
This work was supported by the National Science Foundation Engineering Research Center: Precise Advanced Technologies and Health Systems focused on Underserved Communities (PATHS-UP) (Grant No. 1648451).
Conflicting interests
The authors declared no potential conflicts of interest with respect to the research, authorship, and/or publication of this article.
Data availability
The datasets generated during and/or analyzed during the current study are available from the corresponding author on reasonable request.