
Abstract
Background
Rapid and accurate identification of large vessel occlusion (LVO) is crucial for determining eligibility for endovascular treatment. We aimed to validate whether computed tomography combined with clinical information (CT&CI) or diffusion-weighted imaging (DWI) offers better predictive accuracy for anterior circulation LVO.
Methods
Computed tomography combined with clinical information and DWI data from patients diagnosed with acute ischemic stroke were collected. Three deep-learning models, convolutional neural network, EfficientNet-B2, and DenseNet121, were used to compare CT&CI and DWI for detecting anterior circulation LVO.
Results
A total of 456 patients, 228 patients with LVO [68.91 ± 12.84 years, 63.60% male; initial National Institutes of Health Stroke Scale (NIHSS) score: median 11 (7–14)] and without LVO [67.06 ± 12.29 years, 64.04% male; initial NIHSS score: median 2 (1–4)] were enrolled. Diffusion-weighted imaging achieved better results than CT&CI did in each performance metric. In DenseNet121, the area under the curves (AUCs) were found to be 0.833 and 0.756, respectively, while in EfficientNet-B2, the AUCs were 0.815 and 0.647, respectively.
Conclusions
In detecting the presence of anterior circulation LVO, DWI showed better results in each performance metric than CT&CI did, and the best-performing deep-learning model was DenseNet121.
Keywords
Introduction
Endovascular therapy has proven to be effective for patients with acute ischemic stroke (AIS) with large vessel occlusion (LVO), but its effectiveness is highly time-dependent. 1 Therefore, rapid and accurate identification of LVO is crucial.
Computed tomography (CT) has been the cornerstone of initial stroke imaging owing to its widespread availability and speed. 2 Computed tomography angiography (CTA) is commonly used to detect LVO, but it can be time-consuming, requires contrast material, and may miss LVOs in the absence of a specialist.2,3 Moreover, clinical scale scores, such as the National Institutes of Health Stroke Scale (NIHSS), can also be used to predict LVO, but their accuracy is insufficient for efficient triage. 4 Machine learning techniques are an innovative approach to improve diagnostic precision by identifying complex patterns within imaging datasets and recently there were attempts to detect LVO with it. Several studies utilizing CTA have demonstrated the effectiveness of 3D convolutional neural networks (CNNs), EfficientNetV2, and DenseNet-121 in accurately identifying LVO.56–7 Until recently, however, there had been no research comparing these three algorithms.
Diffusion-weighted imaging (DWI) is particularly sensitive to early ischemic changes and can delineate brain tissue at risk and the infarct core. 2 However, comprehensive evidence supporting the predictive ability of DWI for LVO is still lacking. Therefore, this study aimed to determine whether DWI or computed tomography combined with clinical information (CT&CI) offers better predictive accuracy for anterior circulation LVO in patients with AIS using deep learning.
Methods
Participants
We conducted a retrospective analysis involving patients with anterior circulation LVO and were admitted to Gil Medical Center between January 2012 and June 2023. The inclusion criteria for this study encompassed patients who were: (1) 18 years or older and (2) experienced AIS (within 7 days of onset). Patients were excluded from this study if they had: (1) a transient ischemic attack without symptomatic lesion; (2) evidence of an initial intracranial hemorrhage or tumor; and (3) infarctions involving the posterior circulation or both anterior and posterior circulation concurrently. Approval for this study was granted by the local ethics committee of Gil Medical Center, South Korea (GAIRB number: 2023-285). Due to the retrospective nature of the study, the requirement for informed patient consent was waived. The study adhered to the relevant guidelines and regulations in all its methodologies.
Data collection
Demographic data (age, sex) were collected from medical records. Neurological deficits associated with stroke were evaluated using the NIHSS score upon admission by an experienced stroke neurologist. The NIHSS score was repetitively measured following admission, according to the center's protocol. Imaging data consisted of brain noncontrast CT (NCCT) and DWI images categorized by a neurologist as negative, internal carotid artery (ICA) occlusion, anterior cerebral artery (ACA) occlusion, or middle cerebral artery (MCA) occlusion. The CT and DWI data were saved as DICOM files of 256 × 256 pixels, with a slice thickness of 5 and 1.8 mm, respectively. Figure 1 shows the CT and DWI images of the same patient. The same number of patients with and without LVO was included to prevent class imbalance. The training and test datasets were divided using 5-fold cross-validation.

(a) Brain noncontrast CT and (b) diffusion-weighted image of a patient.
Research environment
The experiments were conducted using a system consisting of an NVIDIA Tesla P100-SXMS-16GB (NVIDIA, Santa Clara, CA. USA) graphics processing unit, Intel® Xeon® CPU E5-2698 v4 (Intel, Santa Clara, CA. USA) CPU, and a 32GB RAM running on an Ubuntu 18.04 operating system. TensorFlow (version. 2.3.0) or Keras (version. 2.3.1), an open-source library that supports various functions for direct deep-learning model design and training; Compute Unified Device (version. 9.1.85) for efficient parallel processing in graphics processing units; Open Computer Vision (version. 4.5.5.64) for preprocessing and basic image processing of medical and other images; and Matplotlib (version. 3.3.4) for graphing and visualizing data were used.
Data preprocessing
We used image preprocessing algorithms to make the CT and DWI images suitable for LVO classification. In both CT and DWI, the brightness of images was low, making it difficult to identify even brain regions. To avoid this problem, we adjusted the window level (WL) of each image. The window width (WW)/WL threshold was measured and applied separately to each image because the brightness, contrast, and characteristics of the images were different. The WW/WL threshold was determined by computing the average value of the histogram, comparing it, and searching for the maximum contrast value of the images.8 The contrast and brightness of the image were uniform after adjusting the window. Clinical information such as gender, age, and NIHSS data has different ranges and sizes, which can lead to learning errors. To avoid this, we normalized them between 0 and 1 using the MinMaxScaler technique. 9 The MinMaxScaler normalizes data to values between 0 and 1, ensuring that all features operate on the same scale. Additionally, the characteristics of the data used in the experiment, such as age and NIHSS, are well-suited to this normalization method. Compared to other normalization methods, the MinMaxScaler has a simple calculation process and is efficient.
Because this study only detected the presence of anterior circulation LVO, we chose slices containing only the proposed vascular region instead of the labeled region of interest. The range of the slices was anatomically in the supratentorial region and was set by a neurologist based on the CT and DWI images. 10
3D CNN model for deep learning
3D deep-learning models were used to binarily classify LVO in the CT and DWI data. The 3D deep-learning models such as CNN, EfficientNet-B2, and DenseNet121 were used. The reasons for using these models in this study are as follows. Convolutional neural network was utilized as a baseline model due to its simplicity and effectiveness in medical image analysis. EfficientNet-B2 was selected for its excellent performance-to-parameter optimization ratio, making it suitable for medical datasets with limited computational resources. DenseNet121 was included because its dense connectivity enhances feature propagation and reuse, which has demonstrated strong results in similar medical imaging studies.
The 3D CNN was used by extending the basic 2D CNN to 3D convolution, which is the same as the original method, but it can acquire information about depth in addition to spatial features. 11 The proposed 3D CNN model consists of three 3D convolutional layers with 64, 128, and 256 filters, followed by max-pooling and batch normalization. Feature maps are compressed using global average pooling and passed through a fully connected layer with 512 units and dropout. The final output layer employs a sigmoid activation function for binary classification. 3D EfficientNet-B2 utilizes factors such as width, depth, and resolution to help design the dimensionality of the model uniformly, and separate series of models are available depending on the resolution of the input image. 12 3D DenseNet121 is characterized by dense connectivity, where each layer of the model receives the output of the previous layer as input; and by efficient feature reusing because it uses the feature map of all previous layers. 13 For learning CT&CI, we used ensemble techniques that can combine image and clinical information features. Ensemble techniques are methods that combine or aggregate the outputs of multiple underlying models in some way to make a final prediction. 14 The study used a stacking method by extracting features from CT images and combining the extracted features with clinical information to make a final prediction. The features extracted from CT images were combined with clinical data and designed to learn their relationships through fully connected dense layers. The combined data passed through dense layers with 256 and 128 units, each using ReLU activation functions. To prevent overfitting, dropout layers were added after each dense layer. The final output layer used a sigmoid activation function to predict the binary classification result. The training hyperparameters for CT&CI and DWI were as follows: epoch 300, batch size 2, learning rate 0.00001, optimizer Adam, loss function binary cross-entropy, with input dimensions (256, 256, 38, 1) for CT&CI and (256, 256, 23, 1) for DWI. We used early stopping to prevent the model from overfitting and reduce the learning rate on the plateau, a technique that adjusts the learning rate if the model does not improve on the validation dataset over a period of time. To visualize which areas of the images were weighted more heavily by the CT&CI and DWI classification models in making predictions, global average pooling was added to the final layer of each model.15,16 Based on the addition, a class activation map (CAM) was visualized.
Statistical analysis
Deep-learning models were trained on data from patients with AIS, and their predictions were compared with neurologists’ readings. The true positives (TP), false negatives (FN), true negatives, and false positives obtained for each model were used to measure sensitivity, specificity, and accuracy. To evaluate the performance of each model, we calculated the receiver operating characteristic (ROC) curve, a graphical measure of classification performance at various thresholds, and the area under the curve (AUC), which represents the area under the ROC curve. The higher the AUC, the more accurate is the performance of the classification model. Figure 2 shows an overview of model training.
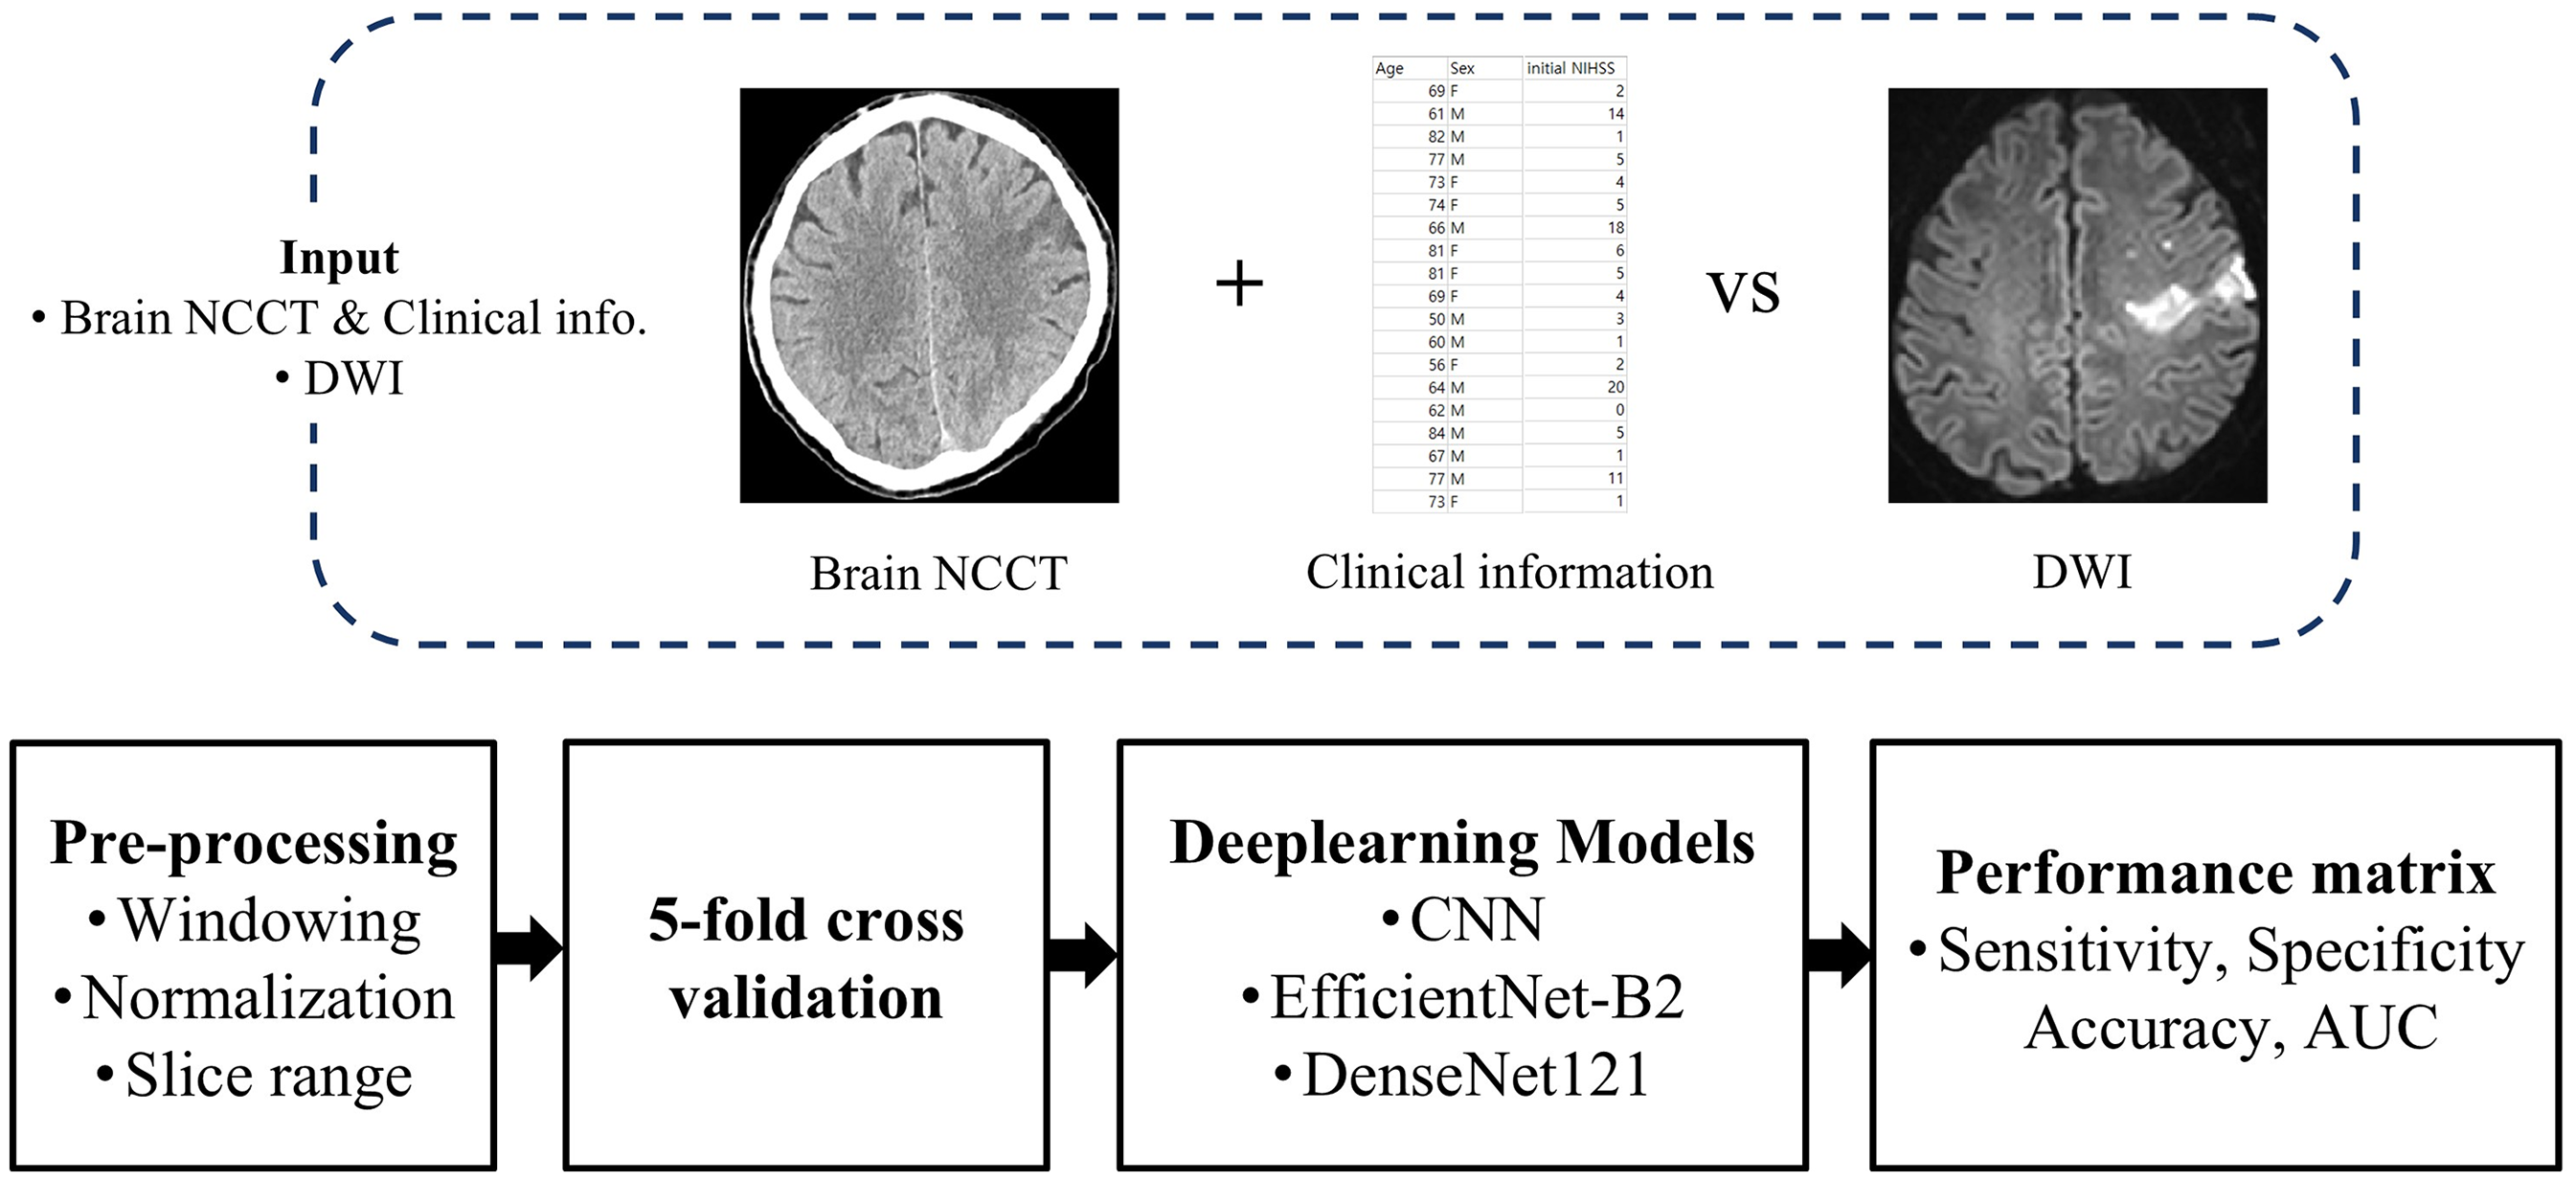
Overview diagram for model training. NCCT: noncontrast CT; DWI: diffusion-weighted image; CNN: convolutional neural network.
Results
A total of 456 patients were included in the study. Table 1 shows the demographic characteristics of the patients according to their anterior circulation LVO status. The mean age of patients with LVO was 68.91 ± 12.84 years, compared to 67.06 ± 12.29 years for those without LVO, with no statistically significant difference between the groups (p = 0.117). The proportion of male patients was similar between the two groups (63.6% and 64.0%, respectively, p = 0.92). However, the initial NIHSS score was significantly higher in patients with LVO, with a median of 11 (IQR: 7–14), compared to a median of 2 (IQR: 1–4) in those without LVO (p < 0.05). Among the patients with LVO, the ICA was 23.39%, the MCA was 69.74%, and the ACA was 0.88%.
Demographic and clinical characteristics of patients with and without large vessel occlusion (LVO).

ACA: anterior cerebral artery; ICA: internal carotid artery; LVO: large vessel occlusion; MCA: middle cerebral artery; NIHSS: National Institutes of Health Stroke Scale.
Table 2 shows all the results of the 5-fold cross-validation of CNN, EfficientNet-B2, and DenseNet121 on CT&CI and DWI data. The DWI achieved better results than CT&CI in each performance metrics. In CT&CI data, DenseNet121 showed a relatively high sensitivity of 0.736, specificity of 0.671, accuracy of 0.719, and AUC of 0.756. In contrast, the performance of EfficientNet-B2 was relatively low. In DWI data, the performance metrics of DenseNet121 and EfficientNet-B2 were all above 0.7, achieving relatively good performance. Among these, the performance of the DenseNet121 and EfficientNet-B2 deep-learning models achieved an AUC of over 0.8. Overall, DenseNet121 demonstrated high performance, however; EfficientNet-B2 achieved the highest sensitivity.
Performance of CNN, EfficientNet-B2, and DenseNet121 in detecting anterior circulation LVO using CT&CI and DWI data (5-fold cross-validation).

AUC: area under the curve; CNN: convolutional neural network; CT&CI: computed tomography combined with clinical information; DWI: diffusion-weighted imaging; LVO: large vessel occlusion.
Figure 3 shows the ROC curves used to compare the performance of the deep-learning models for LVO detection. The solid line represents the results obtained using DWI data, and the dotted line represents the CT&CI data. Overall, the performance metrics of the model for DWI data were relatively high. DenseNet121 achieved the highest AUC of 0.756 and 0.833 for the CT&CI and DWI data, respectively.

Receiver operating characteristic (ROC) curve and area under the curve (AUC) for models trained on deep-learning models CT&CI: computed tomography combined with clinical information; DWI: diffusion-weighted image; CNN: convolutional neural network.
Figure 4 shows the CAM obtained using DenseNet121 from the DWI data. Figure 4(a) shows an example of predicting LVO as an LVO (TP). The model predicts the LVO by focusing on the anterior circulation area (marked in red). Figure 4(b) shows an example of an LVO predicted to be negative (FN). The model predicted LVO negativity by focusing on areas outside the brain.
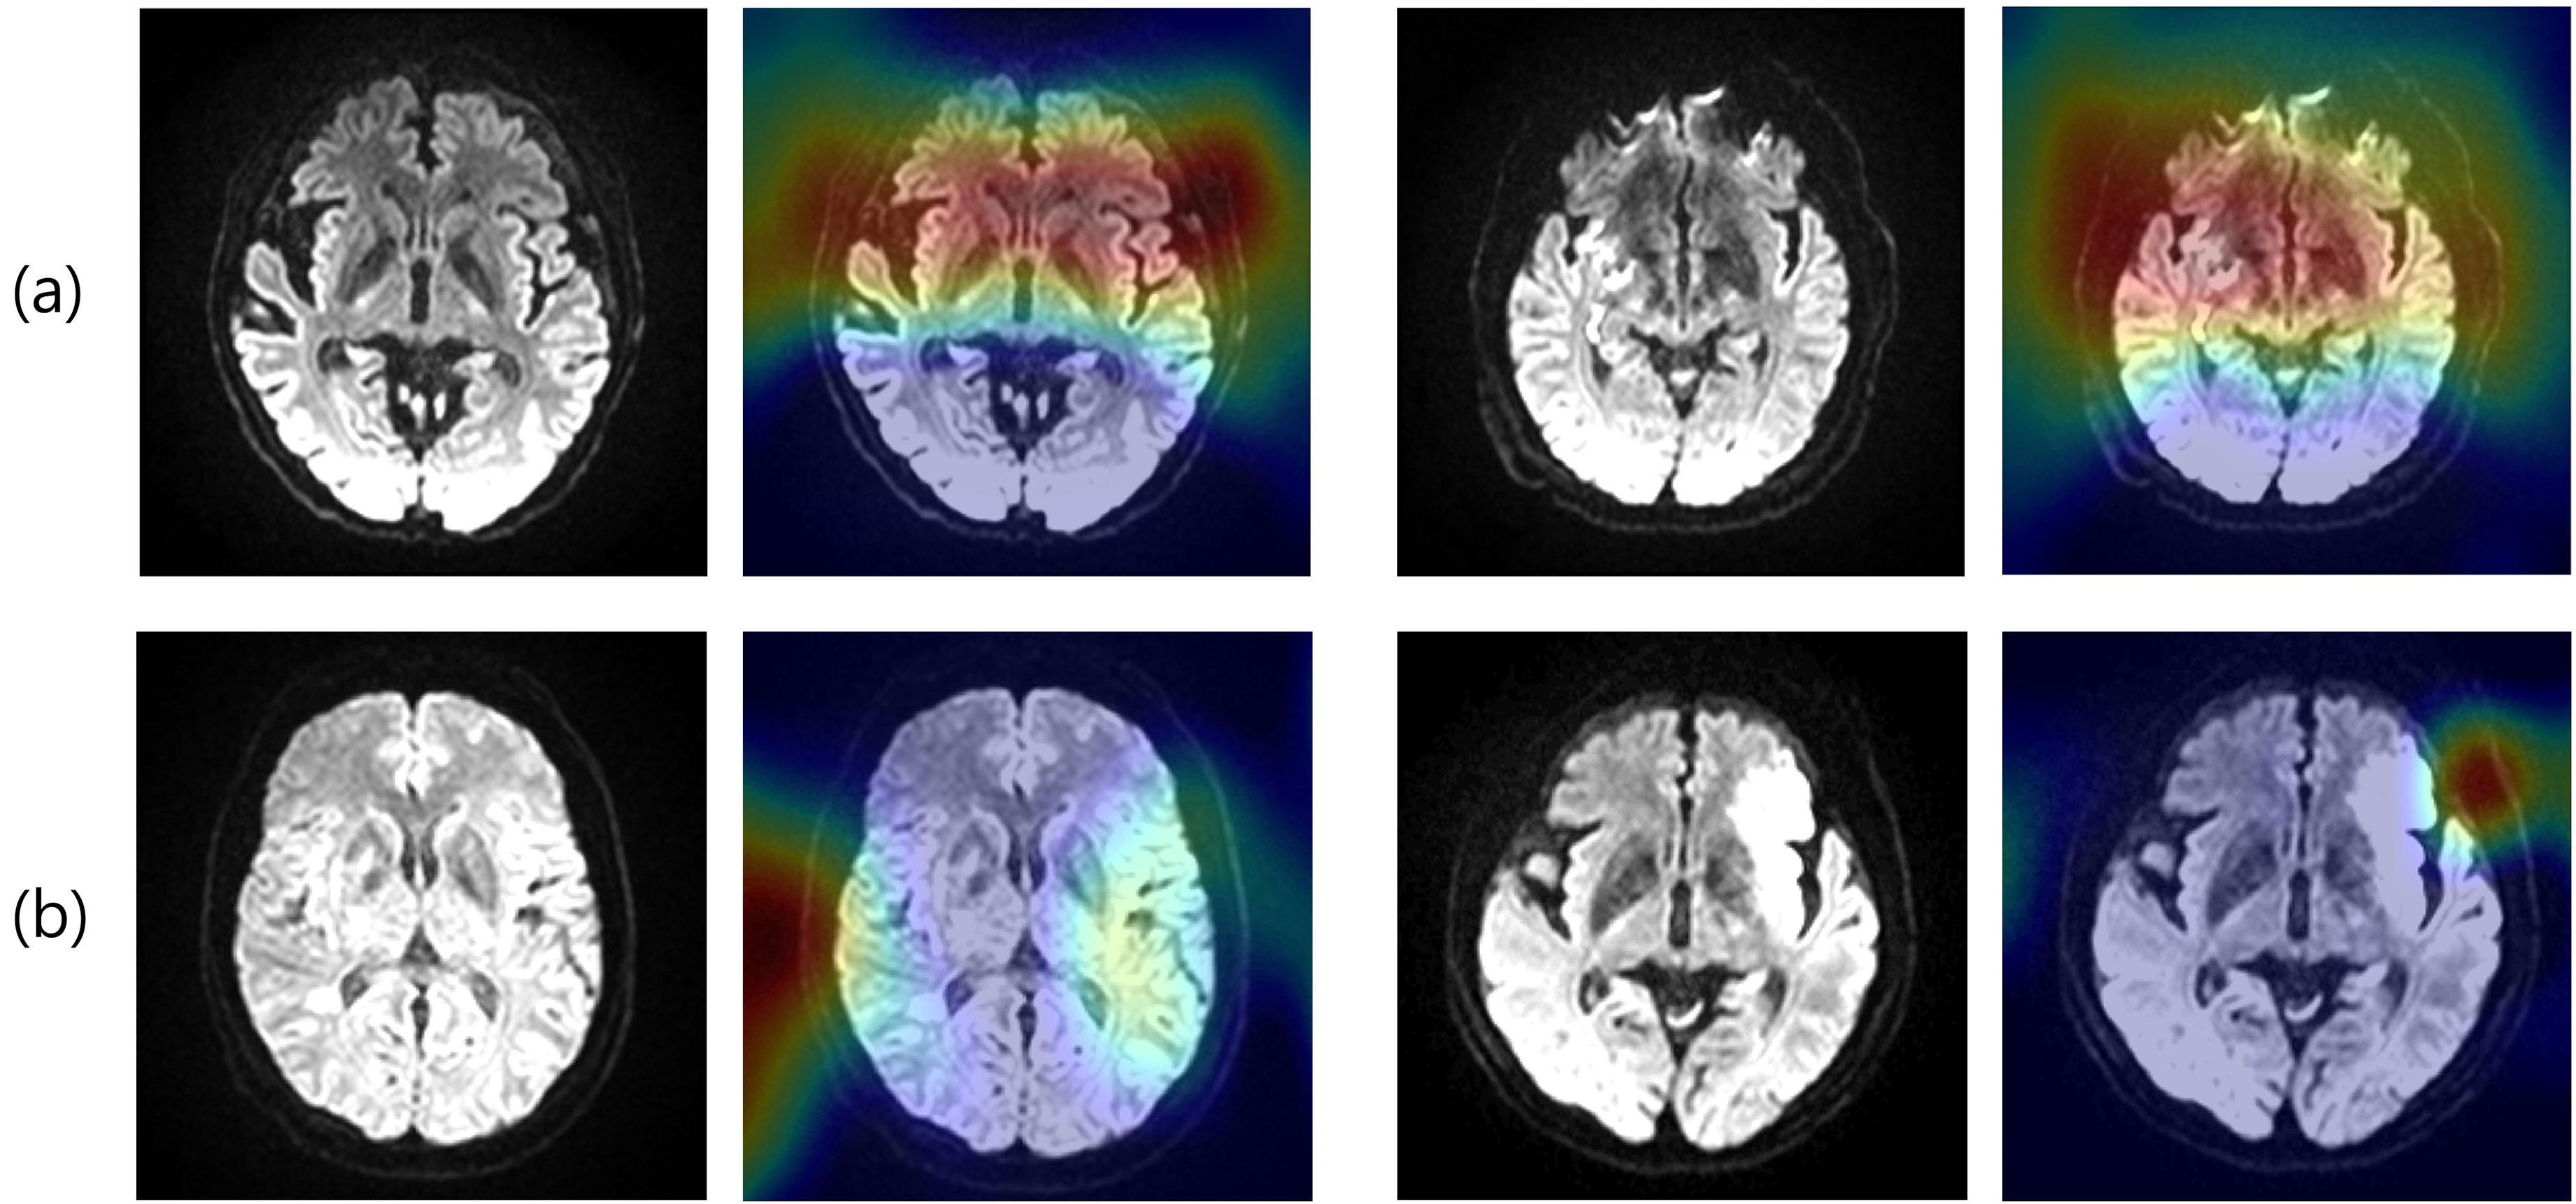
CAM of a patient with LVO, (a) true positive and (b) false negative. CAM: class activation map; LVO: large vessel occlusion.
Discussion
In this study, we compared six results using three deep-learning models and two types of datasets: CT&CI and DWI. We found that DWI predicted the anterior LVO better than CT&CI, particularly when trained with DenseNet121.
Diffusion-weighted imaging is highly sensitive to early ischemic changes and provides direct visualization of the infarct core, allowing precise delineation of the affected brain tissue. 2 This capability is essential for accurately assessing the extent and severity of ischemic injury and is closely linked to the presence of LVO. Several studies found that DWI detects ischemic lesions more effectively than CT in patients with AIS.1718–19 Additionally, MRI-based evaluations in AIS showed minimal time delays compared with CT, resulting in better outcomes.20,21 Although a recent report indicated that machine learning using CT&CI achieved better accuracy for LVO detection than NCCT alone, 22 our findings showed that DWI outperformed CT&CI data. The superior performance of DWI can be attributed to its ability to detect subtle early changes in the ischemic brain tissue, which are often missed by NCCT. 17 Furthermore, DWI does not require contrast agents or specialist interpretation, enabling a quicker and more accurate diagnosis.
Overall, DenseNet121 showed the best performance for CT&CI and DWI data. DenseNet121 connects all inputs between layers to all outputs of the next layer. This connection method facilitates the flow of video information and helps each layer to use its features efficiently. Additionally, reusing features helps to reduce the network size and improve the generalization performance. This implies that a similar or better performance can be achieved with fewer parameters than with the other models. Owing to these characteristics, classification into Negative or LVO was more effective in DenseNet121 than that in other models. This result was also shown in the CAM from the DenseNet121 model using DWI data. As hypothesized, the main area where the occlusion of blood vessels is expected is the anterior circulation of the brain. In contrast, EfficientNet-B2 performed similarly to DenseNet121 on DWI data but showed the lowest performance metrics on CT&CI. This can be explained by the fact that EfficientNet-B2, which optimizes model dimensions through factors such as width, depth, and resolution, is well-suited for DWI data in which brain lesions are clearly visible. However, it may not be as effective for CT&CI.
The strength of the current study is the selection of a range of slices featuring vessels associated with the anterior circulation. This may have contributed to some models achieving AUC above 0.8. The selection of a certain range of slices may have helped to reduce unnecessary information and features and obtain meaningful information and features to detect LVO. Moreover, while DWI significantly enhances the early detection of ischemic stroke, its availability remains limited in some institutions. 23 Given our findings that DWI outperforms CT&CI in predicting anterior LVO, it is essential for hospitals to reconsider their imaging protocols and resource allocation. Prioritizing DWI could improve patient outcomes by enabling more accurate and timely identification of LVO, which is crucial for effective treatment. 24 To successfully integrate these tools into clinical practice, it is essential for hospitals to validate DenseNet121's performance through prospective studies to confirm its accuracy and reliability across diverse clinical settings. Additionally, providing comprehensive training for healthcare professionals is crucial to ensure the effective use of these technologies. Hospitals should also establish standardized protocols that define the specific conditions under which DWI will be employed, either alongside or as an alternative to traditional imaging techniques. Finally, ongoing quality assurance and monitoring should be implemented to assess the impact of DWI and DenseNet121 on patient outcomes.
As a limitation, we only know the presence or absence of the LVO, not its location, and the region is limited to the anterior circulation, not the posterior circulation. Additionally, since this was a single-center retrospective study, we did not provide a detailed calculation or justification for the sample size.
Future research should prioritize collecting multicenter data to conduct external validation and assess the model's generalizability. Additionally, recent studies are investigating the development of multimodal model architectures. Building on the findings of this study, designing multimodal architecture that integrates CT, CI, and DWI could further enhance performance.
Conclusion
Despite these limitations, our results demonstrated that DWI, particularly when analyzed using the DenseNet121 model, outperformed CT&CI in detecting anterior circulation LVO, likely because of its heightened sensitivity to early ischemic changes and ability to delineate infarcted brain tissue.
Footnotes
Acknowledgements
We thank Gyeonggi province, the Ministry of Trade Industry & Energy and the Ministry of SMEs and Startups for administrative assistance during the course of this study.
Contributorship
JaeYoung Kang contributed to manuscript drafting. JunYoung Park performed data analysis and interpretation. All authors reviewed and approved the final manuscript.
Ethical approval
This study was approved by the Institutional Review Board of Gil Medical Center (GAIRB number: 2023-285).
Guarantor
SangHee Ha and KwangGi Kim is the guarantor of this work and accepts full responsibility for the integrity of the data and the accuracy of the analysis.
Funding
The author(s) disclosed receipt of the following financial support for the research, authorship, and/or publication of this article: This work was supported by the GRRC program of Gyeonggi province. [GRRC-Gachon2023(B01), Development of AI-based medical imaging technology], and by the Technology Innovation Program (or Industrial Strategic Technology Development Program(K_G012001185601, Building Data Sets for Artificial Intelligence Learning) funded By the Ministry of Trade Industry & Energy (MOTIE, Korea). This work was also supported by the Export-Oriented “2023 Small and Medium Business Technology Development (R&D) Support Project” (Grant No: RS-2023-00280710) funded by the Ministry of SMEs and Startups (MSS, Korea).
Conflicting interests
The author(s) declared no potential conflicts of interest with respect to the research, authorship, and/or publication of this article.