
Abstract
Background
Pediatric populations are more vulnerable to drug-induced liver injury (DILI) due to distinct pharmacokinetic profiles and ongoing physiological maturation processes. However, early identification and assessment of DILI in pediatric patients present significant clinical challenges, primarily due to the inherent complexity of pediatric cases and substantial limitations in available clinical data.
Objective
This study introduces a framework that integrates clustering analysis with dynamic classifier selection (DCS) techniques to enhance pediatric DILI prediction. The proposed method addresses challenges such as patient heterogeneity and class imbalance, while optimizing predictive performance to support clinical decision-making.
Methods
We investigated a retrospective cohort of 12,555 pediatric inpatients across six hospitals in Chongqing, China. The dataset encompassed a wide range of biomedical parameters, including laboratory results and liver function profiles, along with clinical documentation spanning demographic characteristics, medical histories, and medication regimens. Patients were stratified into four distinct clinical subgroups based on silhouette coefficient. A diverse pool of base classifiers was generated with varied initialization strategies and hyperparameter optimizations tailored to each patient cluster. The classification process was further refined through the implementation of Dynamic Classifier Selection with Multiple Classifier Behavior (DCS-MCB) methodology, which adaptively customizes model selection based on the distinctive clinical profiles of each subgroup.
Results
The Clustering-enhanced DCS-MCB framework demonstrated superior performance compared to conventional machine learning models across evaluation metrics. The ensemble learning models consistently outperformed individual classifier models, with the presented study achieving the highest F1-score (0.926), MCC (0.917), G-mean (0.959), demonstrating the strength of this hybrid approach in addressing the complexities of pediatric DILI prediction.
Conclusion
The integration of clustering analysis with dynamic classifier selection has demonstrated efficacy in complex real-world clinical settings. This methodology provides a more robust, precise, and clinically adaptable framework for patient stratification and drug safety surveillance.
Keywords
Introduction
Adverse drug reactions (ADRs) in children are receiving increasing attention. ADRs are defined as “a noticeable harmful or unpleasant reaction resulting from an intervention related to the use of a medicinal product”.1,2 Due to the ongoing maturation of children's physiological systems, such as in aspects of drug absorption, metabolism, transport, elimination, as well as the use of off-label and unlicensed drugs, they are more susceptible to specific types of ADRs,3,4 with an incidence rate 2–4 times higher than that in adults. Adverse reactions typically signal the need for caution in future administration, requiring prevention, special treatment, adjustment of the dosage regimen, or discontinuation of the drug. According to a study based on a pediatric active monitoring system, approximately 15 children per 1000 experience adverse reactions. 5 The majority of observed ADRs primarily affect the skin (e.g., rash, urticaria) and the gastrointestinal system (e.g., diarrhea, nausea, vomiting).6,7
Drug-induced liver injury (DILI) is a rare but severe ADR, resulting from an adverse reaction to drugs or other exogenous agents, 8 which can progress to acute liver failure (ALF). DILI can be categorized into two types: intrinsic and idiosyncratic DILI. Intrinsic DILI is dose-dependent, meaning the risk and severity of liver damage increase with higher drug doses, and it is more predictable as it is closely tied to the drug's pharmacological properties and mechanistic pathways. In contrast, idiosyncratic DILI is dose-independent, occurring unpredictably in only a small proportion of patients regardless of dosage, administration route, or treatment duration, and its complex causes involve genetic, immune-mediated, and metabolic factors unique to the individual. DILI is a common cause of pediatric liver disease. 9 According to data from the U.S. Acute Liver Failure Study Group, DILI accounts for more than 50% of acute liver failure cases. 10 DILI is a complex process driven by multifactorial etiologies and the combined effects of polypharmacy, with diverse underlying causes of adverse reactions among different pediatric patients. Providing clinical decision support for pediatric DILI presents a significant challenge. A pivotal concern lies in identifying the most appropriate treatment regimen to aid in the prognosis of DILI, considering the vast array of complex therapeutic alternatives. This can be effectively resolved through a comprehensive understanding of each patient's disease characteristics and medication profiles.
ADRs are preventable, 11 and the application of machine learning shows promise in assisting in the diagnosis of DILI. For example, Tracy L. Sandritter 12 employed an Electronic Health Records (EHRs)-based screening tool to identify potential pediatric DILI cases, identifying 12 patients over two years as possible or probable cases of DILI, and emphasized the need for future improvements to better identify and define DILI. In the context of predicting ADRs events, Ze Yu et al. 13 developed predictive models using seven machine learning algorithms on a cohort of 1746 patients, with the best performance achieved by gradient boosting decision trees (GBDT), yielding a precision of 44%, recall of 25%, and F1 score of 38.88%.
However, conducting research on DILI data encounters substantial challenges, primarily stemming from the following factors: (1) The intricate interactions among different medications, the prevalence of polypharmacy, and the impact of diverse underlying diseases such as sepsis and leukemia demand the application of sophisticated data analysis methods. (2) Data-related issues, like incompleteness, sparsity and imbalanced class distributions, pose significant difficulties in the analysis of real-world data. (3) There are also confounding elements involved, such as variability in clinical practices and the underreporting of adverse events. 14 To address these challenges effectively, we proposed a framework that integrates clustering and DCS techniques to facilitate accurate and personalized clinical decision making.
Clustering algorithms play a crucial role in profiling patient subgroups that are associated with a wide array of suspected triggering factors related to different diseases and medications. These algorithms operate proactively by partitioning data into distinct, non-overlapping clusters based on feature similarity., ensuring that the patterns within each cluster are highly similar while remaining distinct from those in other clusters. 15 The clustering problem has been extensively studied in diverse fields, including statistics and artificial intelligence. For example, Qianqian Yu 16 proposed a novel clustering-based method for predicting potential associations between lncRNA and diseases. This method achieved an AUC exceeding 0.8, outperforming three other comparative methods. Similarly, Utkarsh Agrawal et al. 17 introduced a new ensemble classification phase that followed the ensemble clustering stage, which improved the final classification outcomes for unclustered data. Peng Gaong Sun et al. 18 used clustering algorithms, Markov clustering algorithms, and molecular complex detection to decompose the human PPI network into dense clusters. In the medical domain, identifying biological clusters such as patient subgroups with distinct characteristics, has been demonstrated to be both feasible and of great significance for optimizing treatment strategies. Therefore, developing frameworks that assign patients into groups can not only enhance the accuracy of classification but also enable researchers to gain deeper insights into the intricate relationships within the patient data.
Single classifiers often fall short when it comes to solving intricate classification problems. In contrast, multi-classifier systems incorporating DCS19,20 present a promising solution to common challenges like data incompleteness and imbalanced class distributions that are frequently encountered in EHRs data. These systems are capable of effectively handling such complexities by integrating a variety of feature selection and undersampling techniques directly on the original dataset. DCS enables the identification and selection of the most capable classifiers for each query instance. Notable examples include methods such as META-DES, 21 multiple classifier behavior (MCB), and modified local accuracy (MLA). Typically, the process commences with an estimation of the classifiers’ competitiveness, grounded in the local region of the feature space in which the query samples are located. Subsequently, in accordance with specific selection criteria, the competence level of the base classifiers, such as accuracy or ranking, is evaluated by leveraging the samples within this local region. Finally, only the combination of classifiers that meet a certain competence level, or the single best-performing classifier, is selected. DCS has also demonstrated its efficacy in adeptly handling data characterized by imbalanced class distributions. 22
The integration of clustering techniques and DCS methods offers a hybrid strategy that capitalizes on the advantages of both to enhance predictive accuracy. Clustering categorizes patients into subgroups based on shared characteristics, allowing for a more tailored and precise application of classifiers. For instance, Wu 23 introduced a hybrid multi-clustering and bagged classifier generation (HMCBCG) method, achieving impressive results with an accuracy of 99.81%, an F1-score of 99.86%, and a G-mean of 99.78%. Such evidence underscores the potential of combining clustering and DCS techniques to improve classification performance, especially when dealing with complex and imbalanced datasets like those prevalent in medical research. Building upon this existing knowledge, our research adopts a hybrid approach specifically designed for predicting. Initially, patients are clustered into distinct groups based on clinical features such as underlying diseases and laboratory test results. Subsequently, DCS methods are employed to select the most competent classifiers for each subgroup, tailoring the classification process to the specific characteristics of each cluster. This approach not only enhances predictive performance but also increases the adaptability and robustness of the model. By tackling the heterogeneity within patient populations, this method facilitates personalized clinical decision support, advances predictive modeling for pediatric DILI, and demonstrates its potential to improve predictive accuracy and patient outcomes in real-world clinical settings.
Methods
Data collection
This study is a retrospective prognostic investigation utilizing data from pediatric inpatient records at six tertiary hospitals in Chongqing, China. According to the World Health Organization, childhood encompasses ages 0–10 years, while adolescence includes ages 10–19 years. Therefore, this study covers both children and adolescents within the study population. The initial cohort of this study consists of all pediatric patients hospitalized between January 1, 2013, and December 31, 2023, who were diagnosed with DILI during their hospitalization. First, we conducted screening using ICD-10 codes to identify potentially eligible cases. Subsequently, the research team invited clinicians to participate in the verification process to ensure that the diagnosis met the criteria for DILI. The data we used were the first data records of patients upon admission, at which time the patients had not been diagnosed with DILI.
Exclusion criteria were as follows: (1) Absence of drug exposure: Patients who had not been exposed to drugs with a known potential to cause liver injury were excluded. (2) Incomplete or missing clinical data: Individuals with incomplete clinical data or a lack of essential medical information required for diagnosis were not included. (3) Unclear etiology: Patients in whom the cause of liver injury could not be confidently linked to either specific drug exposure or underlying diseases were excluded. This category included cases where liver injury was caused by common etiologies such as viral hepatitis or genetic liver disorders. This study included 1190 pediatric cases that were confirmed to have DILI. Additionally, a control cohort was formed through randomly sampling from the cases that were confirmed not to have DILI, excluding those with incomplete or missing clinical data. In the end, data from 12,555 patients were included in this study.
Statistical analysis
In the descriptive analyses, laboratory indices and other continuous variables were characterized using means and interquartile ranges (IQRs), while categorical data were presented as counts and percentages. A two-step variable selection approach was implemented: (1) Univariate screening: Continuous predictors were evaluated using the Mann-Whitney U test, appropriate for data with non-normal distributions, while binary variables, such as gender and medication usage, were assessed through the χ2 test or Fisher's exact test, depending on the sample size. Variables demonstrating statistical significance (p-value < 0.05) were shortlisted for subsequent analysis, considering the dataset's high dimensionality. (2) Automated refinement: The variables selected from the univariate analysis underwent an automated selection procedure within the DCS framework. This step identified the most relevant predictors, balancing model complexity with predictive accuracy, as detailed in the Results section.
Specialized and standardized case report forms were designed for all cases, which captured a range of factors associated with pediatric DILI. These factors included are as follows: (1) Demographic information (e.g., gender, age); (2) Medication information (e.g., antibiotics, acetaminophen, non-steroidal anti-inflammatory drugs, drug counts); (3) Disease information (e.g., pneumonia, sepsis, leukemia); (4) Chief complaints (e.g., fever, cough, vomiting); (5) Hospital examination results (e.g., alanine transaminase (ALT), aspartate transaminase (AST), alkaline phosphatase (ALP), gamma-Glutamyl transferase (GGT), international normalized ratio (INR), total bilirubin (TBIL), direct bilirubin (DBIL), indirect bilirubin (IBIL)); and (6) Other information (e.g., number of hospitalizations, length of hospital stay). Table 1 displays the demographic and clinical characteristics of the patients. Specifically, label = 0 represents patients who were not diagnosed with DILI, and label = 1 represents patients diagnosed with DILI.
Demographic and clinical profile of patients.

The proposed framework
Figure 1 depicts the overall implementation pathway followed in this study. Step A represents the clustering phase, during which the pediatric DILI data are partitioned into distinct subgroups using the silhouette coefficient and k-means algorithm, as detailed in the Methods’ clustering section. Subgrouping considers several factors including diseases (e.g., sepsis, leukemia), laboratory indices (e.g., ALT, TBIL), and drug treatment regimens (e.g., antibiotics, acetaminophen, NSAIDs). Step B represents the classifier pool generation stage. Various strategies are used such as different cluster initialization configurations, heterogeneous models with hyperparameter optimization, and data sampling. These strategies are implemented to address the data-related challenges including imbalanced class distribution, creating a pool of base classifiers that embrace multiple optimal solutions. The final stage is the dynamic selection phase. Classifying a new query sample usually has three key steps. First, define the competence region using methods like KNN, decision space, or the potential function model. Second, set selection criteria to assess base classifiers’ performance, considering metrics such as data complexity, model ranking, and diversity. Finally, determine the method for selecting base classifiers, which could be choosing a single classifier, dynamic classifier selection, or dynamic ensemble selection (DES). By assigning different test samples to their corresponding classifiers, we can effectively carry out the decision-making process.
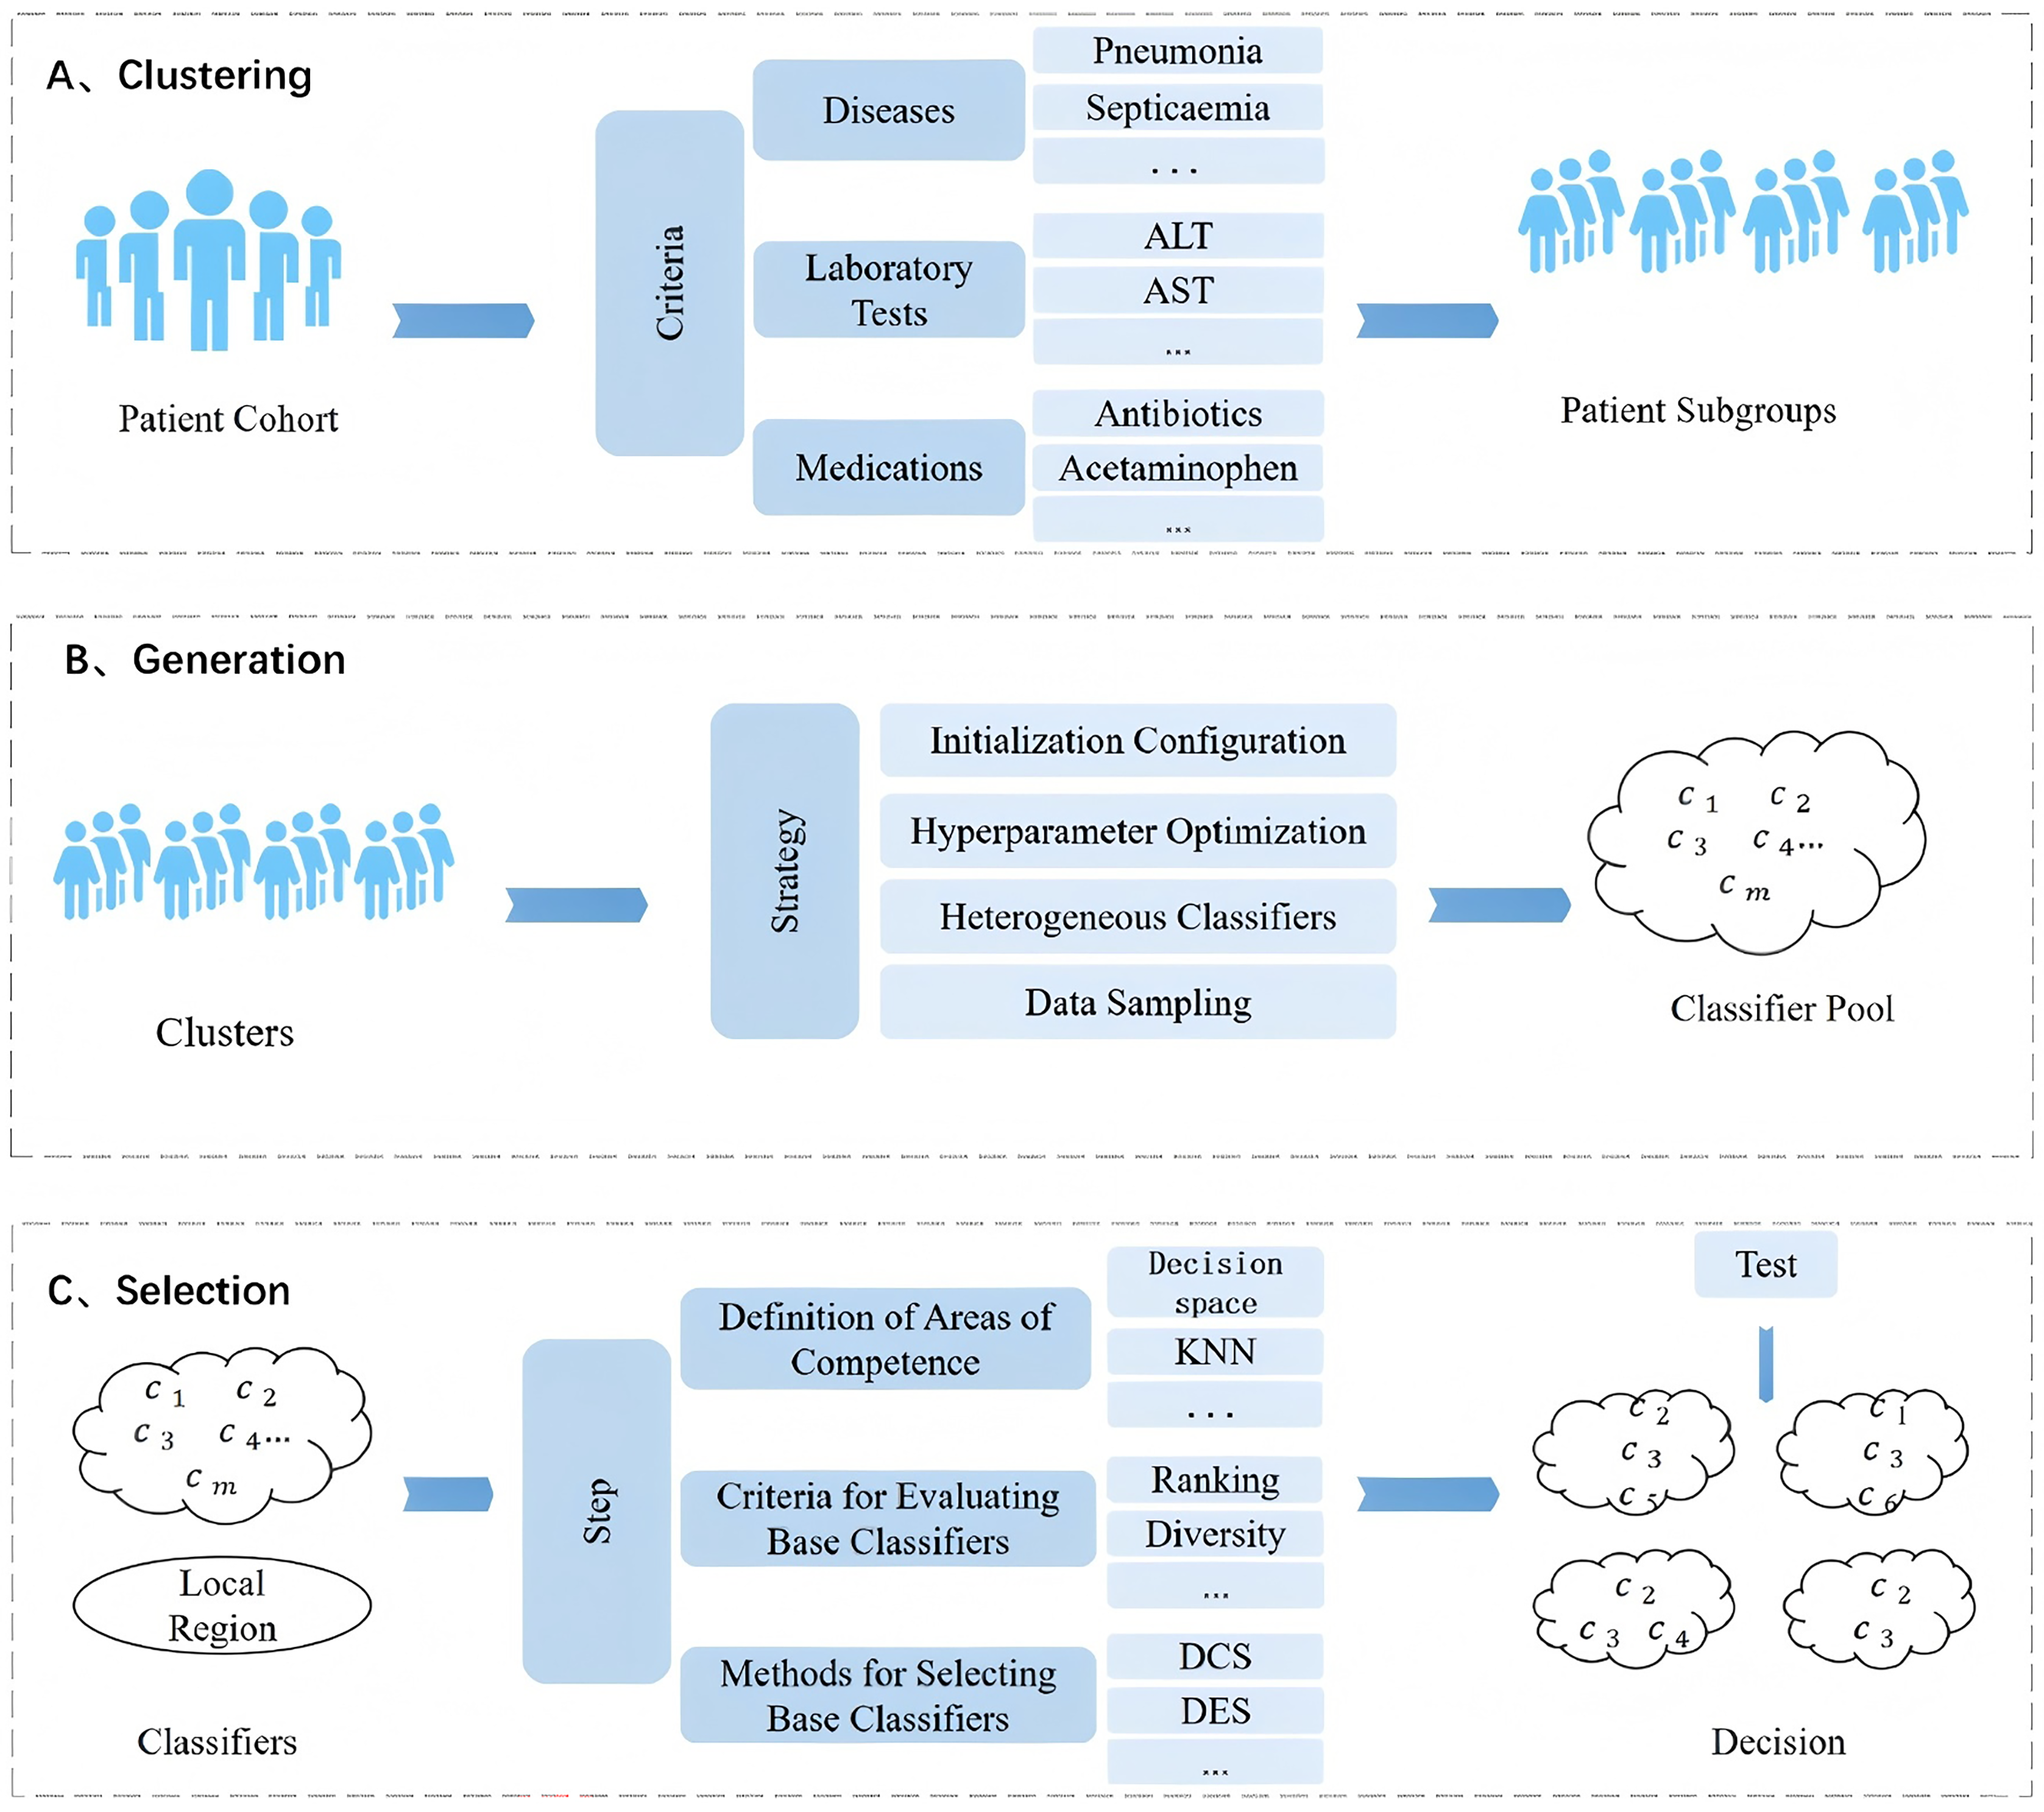
Experimental path diagram for this study.
Clustering
K-means is a classical unsupervised learning algorithm employed to partition a dataset into multiple clusters, grouping similar data points around a cluster center. The algorithmic workflow adopted in this study is as follows:
The K-means clustering algorithm was applied to perform clustering and stratification analysis on patients with similar characteristics, with the number of clusters (K) ranging from 2 to 10. For each patient's data, the distances to all cluster centers were computed, and the patient was assigned to the closest cluster. This approach ensured that each patient's data was allocated to the cluster with the minimum distance to its center. The formula used for this calculation is as follows:

In the formula above, The optimal number of clusters K (ranging from 2 to 10) was determined according to the silhouette coefficient, a commonly used metric to evaluate the quality of clustering results. This coefficient measures both the compactness and separation of clusters. The silhouette coefficient
where 
In this study, the silhouette coefficient, a metric that quantifies both intra-cluster cohesion and inter-cluster separation, was used to evaluate the clustering quality. The cluster number corresponding to the highest silhouette coefficient was regarded as the optimal K, representing the most balanced clustering result. Once the optimal K was identified, the data were grouped into K clusters, thus laying the foundation for subsequent analyses.
Dynamic classifier selection
Under the assumption that data from different groups may exhibit distinct patterns and relationships, an appropriate classifier for instances from each group is selected in this phase. Class imbalance poses a significant challenge, potentially leading to biased classification results that prioritize the majority class. DCS has demonstrated its effectiveness in dealing with imbalanced data.
Classifier Pool Generation: The goal is to create a pool C containing m base classifiers that are both accurate and diverse. These base classifiers need to include a variety of models capable of achieving optimal results on the training data. The base classifier pool is generated by using various initializations (clustering the data into diverse groups) and setting different parameters (each classifier is configured with distinct hyperparameters tailored to the data it is trained on). This approach ensures that the resulting classifier pool can generate informed predictions across a wide range of datasets, thereby improving overall classification performance.
DCS based on Multiple Classifier Behavior (DCS-MCB): This is a dynamic selection technique based on the behavior knowledge space (BSK) and classifier local accuracy.
19
Given a new test sample 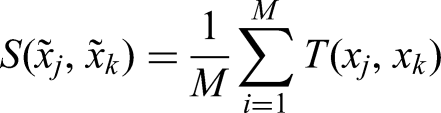

Samples with a similarity below the specified threshold are excluded from the competence region
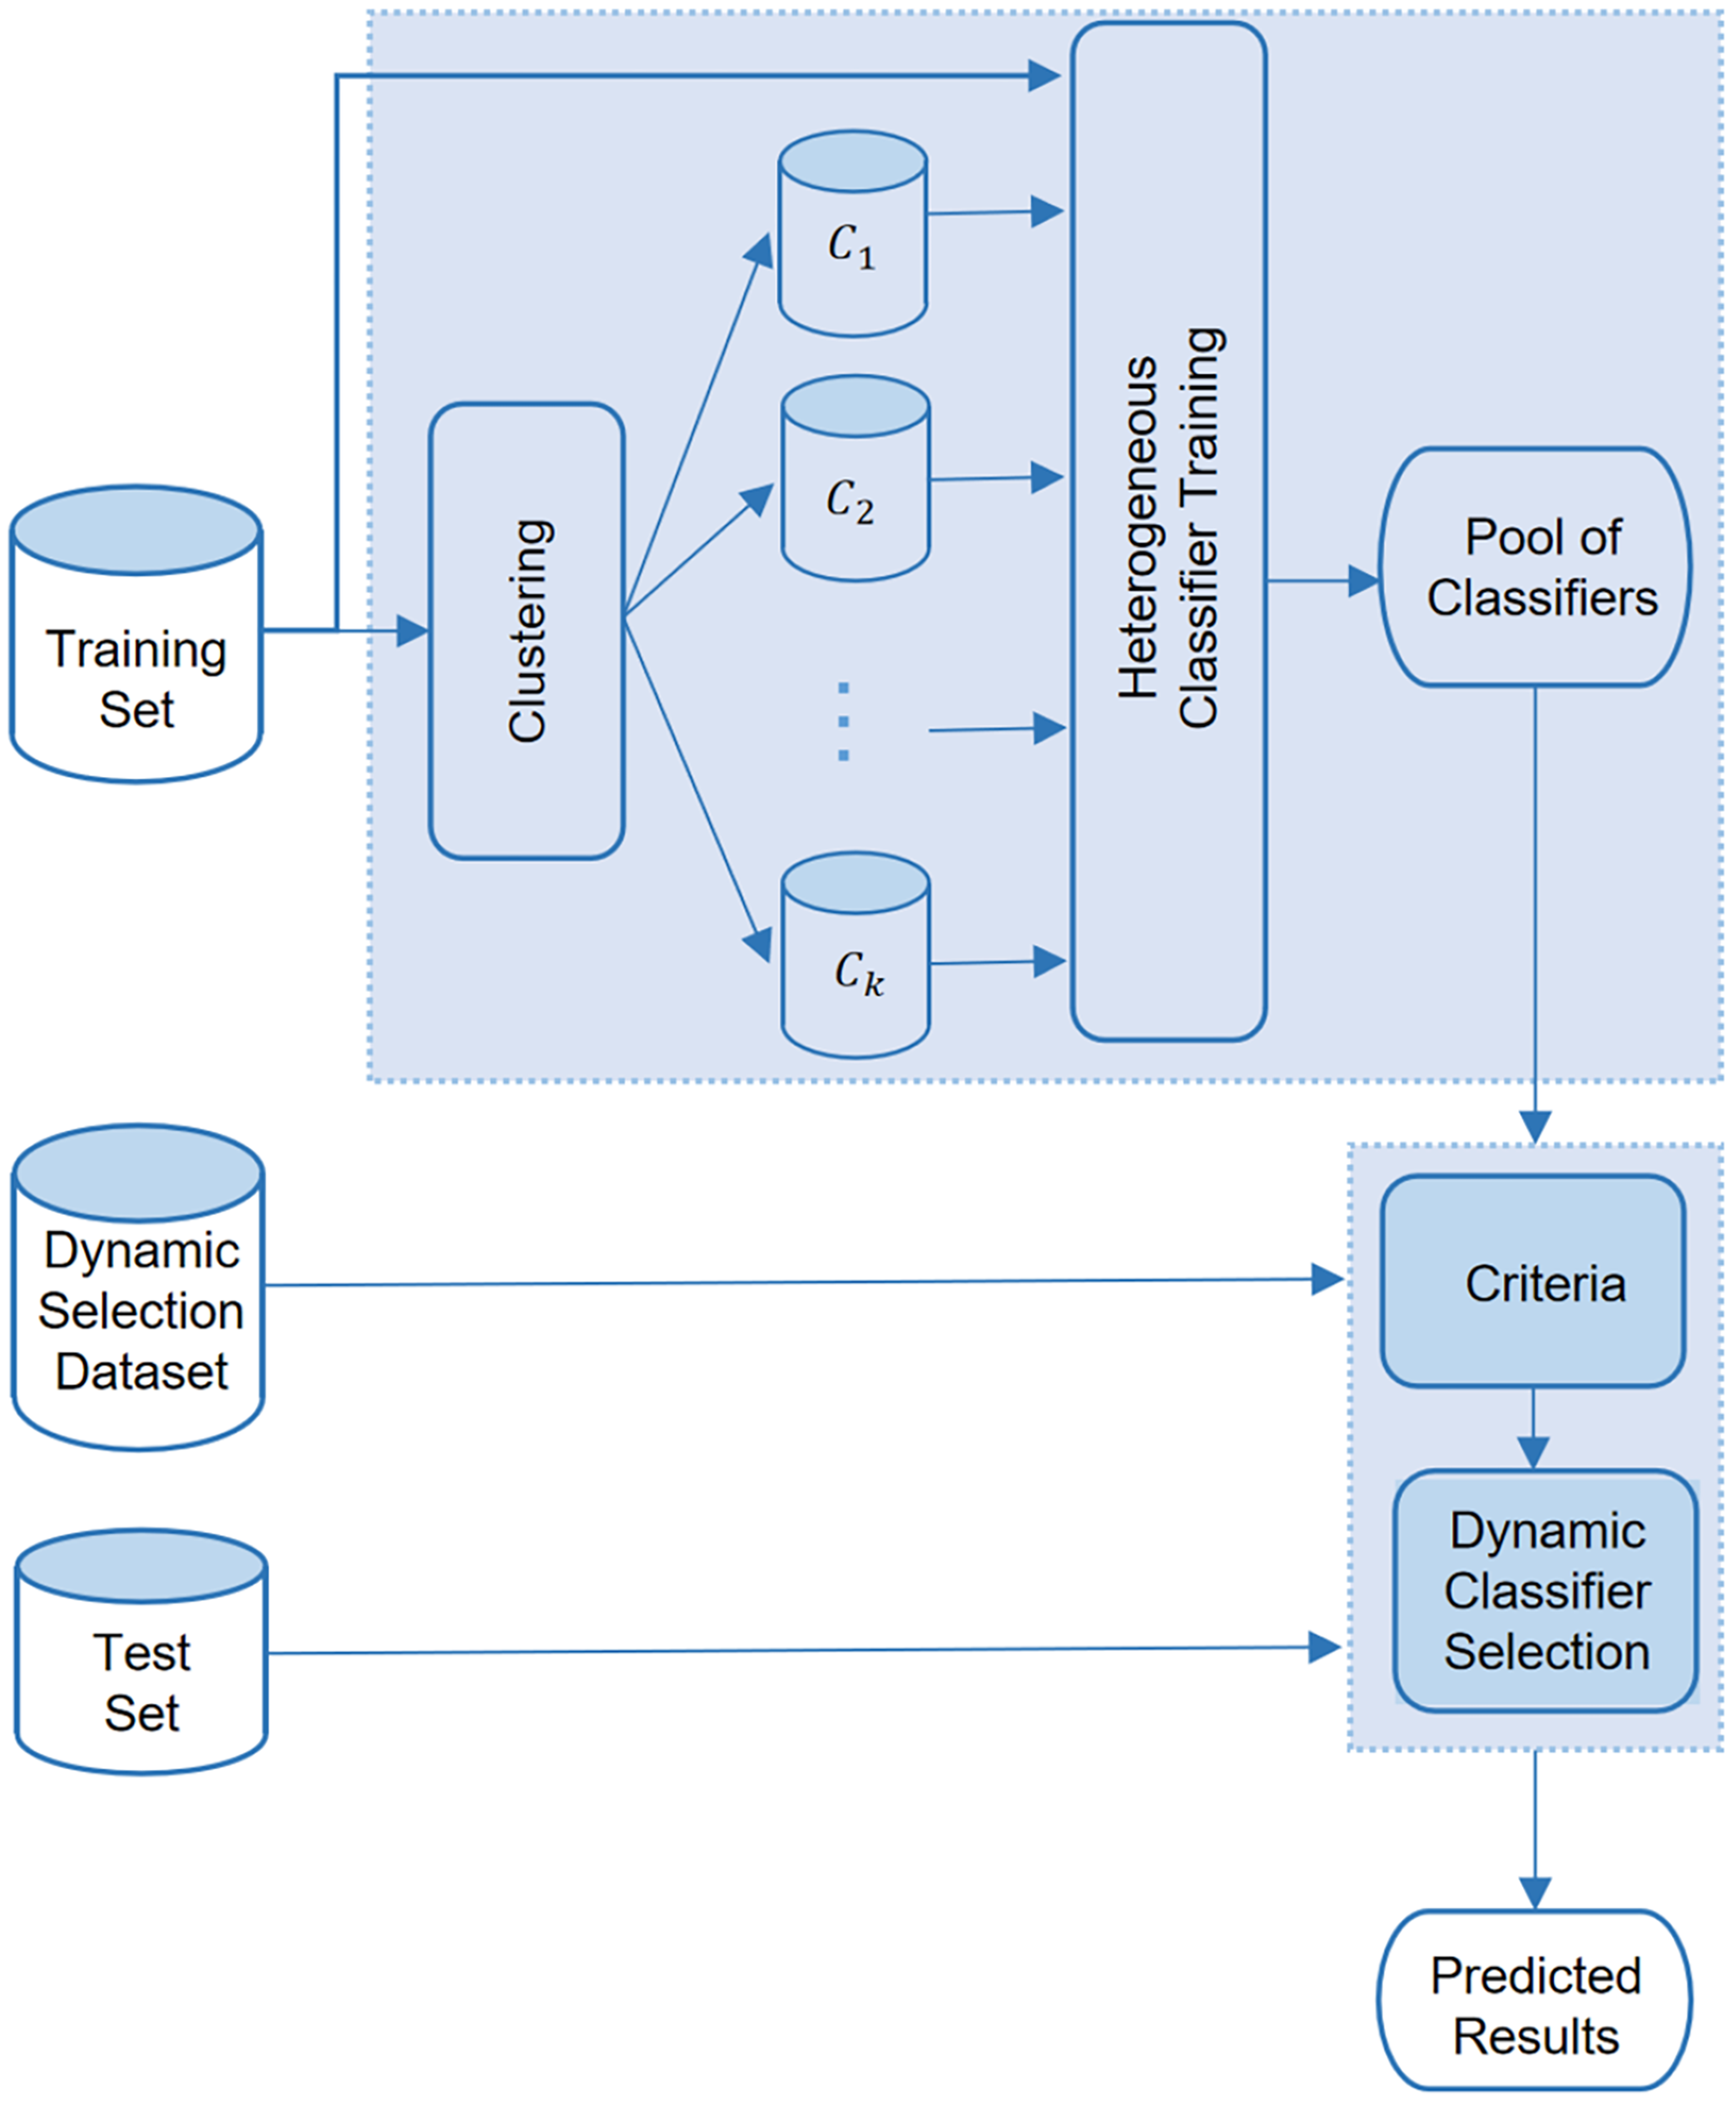
The integration of clustering and DCS framework flowchart.
In our study, separate base classifier pools are constructed for distinct data clusters. The DCS-MCB method is employed to ensure accurate classification of instances within each cluster. This approach allows for a thorough assessment of the base classifiers’ performance across their full range of capabilities. To further validate the model's robustness and reliability, the data undergoes multiple rounds of cross-validation. This iterative validation not only reinforces the model's stability but also boosts its overall predictive performance, ensuring it can be effectively applied in various clinical settings.
In summary, we utilized a framework integrating clustering and dynamic selection techniques to enhance predictive accuracy in pediatric DILI. First, we identified the optimal number of clusters using the silhouette coefficient and applied the K-means algorithm to cluster the DILI data. Subsequently, we selected base classifiers with performance surpassing a predefined threshold to create a classifier pool. In the final dynamic selection stage, we applied DCS-MCB to tailor classifier selection for each query sample, ensuring accurate and reliable predictions. The model's stability was validated through multiple rounds of cross-validation, rendering it appropriate for a wide range of clinical uses.
Results
This study presents a framework integrating clustering and dynamic classifier selection (DCS-MCB) to enhance the accuracy and robustness of prediction models for DILI in children. The results demonstrate that the proposed model outperforms traditional models, demonstrating its potential for use in clinical settings. It can assist in the early identification of high-risk pediatric DILI patients, enabling precise interventions, and improve the overall efficiency of healthcare services.
Data processing
Figure 3 depicts the data processing workflow in this study. First, the data was divided into a training set and a test set. Subsequently, the training set was clustered into four clusters (c_0 to c_3) using silhouette coefficients and k-means clustering criteria. The clustered training sets were further split into training subsets (c0_train to c3_train) and validation subsets (c0_val to c3_val). According to the characteristic disparities among each cluster, four distinct base classifier pools were constructed (the specific criteria are detailed in the “Dynamic Classifier Selection” section of the Results). Each pool might contain base classifiers with diverse or similar characteristics. For instance, if the evaluation metrics of the KNN algorithm in cluster_0 all exceed 0.8, it is incorporated into pool_0. On the contrary, if its F1 score in cluster_1 is less than 0.8, it is excluded from pool_1. Eventually, four distinct base classifier pools were formed, and the DCS-MCB algorithm was employed to integrate these pools.

Overview of data processing flow in this study.
Notably, we left the test set unprocessed, maintaining its data independence. When the DCS-MCB algorithm predicts the test set, it first identifies the cluster (c_0 to c_3) that each data point belongs to. Then, it chooses the corresponding base-classifier pool (pool_0 to pool_3) for prediction. This data-processing approach ensures that the test set utilizes the most suitable base-classifier pool for prediction. It sets this method apart from traditional machine-learning models, leading to more accurate predictions.
Clustering analysis
As described in the Methods section, we first utilized the silhouette coefficient to determine the optimal value of K within the range of 2–10. Subsequently, we applied the k-means algorithm to cluster the data into K groups. Figure 4 presents the silhouette coefficient plot of this study, with the x-axis representing the number of clusters and the y-axis representing the silhouette score. A higher silhouette score implies a better clustering result. From this evaluation, we concluded that four clusters resulted in the optimal outcome within the potential range of clusters. Consequently, patients were divided into four distinct subgroups, discriminating those with complex underlying diseases from those with milder conditions. This stratification enables a more accurate analysis of the DILI incidence across different populations.

The silhouette coefficient plot of this study.
Subsequently, the k-means algorithm was applied to cluster the data into four groups. Table 2 presents the composition of each cluster, with the ratio of 0:1 for each category shown in parentheses. A detailed examination of the data clusters indicated that complex diseases were more prevalent in cluster_0 and cluster_2. For example, in the training set, 50.84% of patients in cluster_2 had a sepsis diagnosis, compared to just 1.43% in cluster_1. The differences between cluster_1 and cluster_3 were mainly driven by variations in laboratory indicators and medication use. For instance, the proportion of patients using ambroxol in cluster_0 was 21.59%, but in cluster_3, this figure increased significantly to 53.31%.
Comparison of training and test data across four clusters.

Figure 5 showcases a heatmap designed to visualize the normalized features of patients. The four distinct clusters, namely cluster_0 through cluster_3, are clearly demarcated by prominent green dashed lines. Along the x-axis, the features are listed, while the y-axis represents the patients. The color-coded scale serves as an intuitive guide for the feature values, with darker hues indicating higher values. This heatmap offers a comprehensive view of the distribution patterns of features across diverse patient clusters. It reveals information about how features are distributed among the clusters. Each cluster exhibits unique feature prominence, accompanied by block-wise missing data. Notably, traditional statistical and machine learning techniques are found to be inadequate for effectively managing such missing data patterns. The clustering patterns unveiled in this heatmap underscore the inherent heterogeneity in feature expression among patient subgroups. This heterogeneity emphasizes the need for customized and tailored methods for predicting DILI.

Heatmap analysis of patient features across four distinct clusters in pediatric DILI.
Dynamic classifier selection
Evaluation metrics comprised conventional ones and those for imbalanced class distributions, such as accuracy (ACC), precision-recall area under the curve (PR-AUC), F1-score, recall, precision, Matthews correlation coefficient (MCC), and geometric mean (G-mean). Formulas for these metrics are:
True Positives (TP): Correctly predicted positive cases True Negatives (TN): Correctly predicted negative cases False Positives (FP): Incorrectly predicted positive cases False Negatives (FN): Incorrectly predicted negative cases
ACC (Accuracy):
It indicates the proportion of correct model predictions.
PR-AUC: It is the area under the Precision-Recall curve and reflects the trade-off between precision and recall of the model across various thresholds. It is obtained by graphing the Precision-Recall curve and computing the area under that curve.
Recall:
It represents the proportion of all positive class samples that are correctly predicted by the model.
Precision:
It shows the proportion of all samples predicted as positive that are indeed positive.
F1 score:
It is the weighted average of Precision and Recall, used to balance the Precision and Recall performance of the model.
Matthews correlation coefficient (MCC):
It is a comprehensive metric for assessing the classifier's performance, ranging from −1 to 1. A value of 1 implies perfect classification, 0 implies random classification, and −1 implies completely incorrect classification.
G-mean:

It measures the balanced performance of the model for both positive and negative classes. The higher the G-mean value, the better the model performs for both classes.
When selecting the base classifier pool, we chose a variety of individual and ensemble learning models and evaluated their performance using multiple metrics, such as ACC, Precision, Recall, F1 score, PR-AUC, MCC, and G-mean. The performance of candidate models was assessed against these metrics, and only models with all metrics above 0.5 were included in the final base classifier pool. The models finally included in the base classifier pool are: individual models (Decision Tree [DT], K-Nearest Neighbors [KNN], Logistic Regression [LR], Linear Discriminant Analysis [LDA]) and ensemble models (Random Forest [RF], Bagging, Adaptive Boosting [ADA], LightGBM [LGB]).
Table 3 shows the performance of DCS-MCB and base classifiers on original data. Without clustering, DCS-MCB achieved the highest values in ACC (0.952), F1 (0.750), Precision (0.745), and MCC (0.724). Meanwhile, Bagging achieved the highest Recall value of 0.823, and RF outperformed DCS-MCB in PR-AUC and G-mean, with values of 0.815 and 0.883, respectively. Table 4 represents evaluation metrics after data clustering. Almost all base classifiers improved in all metrics. For instance, DT's F1 score rose from 0.647 before clustering to 0.858 after. Notably, unlike pre-clustering results, the proposed Cluster_DCS-MCB framework consistently outperformed other classifiers in every metric, achieving the highest ACC (0.986), PR-AUC (0.970), F1 (0.926), Recall (0.932), Precision (0.925), MCC (0.917), and G-mean (0.959). As expected, ensemble models generally outperformed individual ones, and our proposed framework always outperform other ensemble classifiers in all comparisons.
Performance evaluation of DCS-MCB and base classifiers.

Bold values represent the top results for each corresponding indicator.
Performance evaluation of cluster_DCS-MCB and base classifiers post clustering.
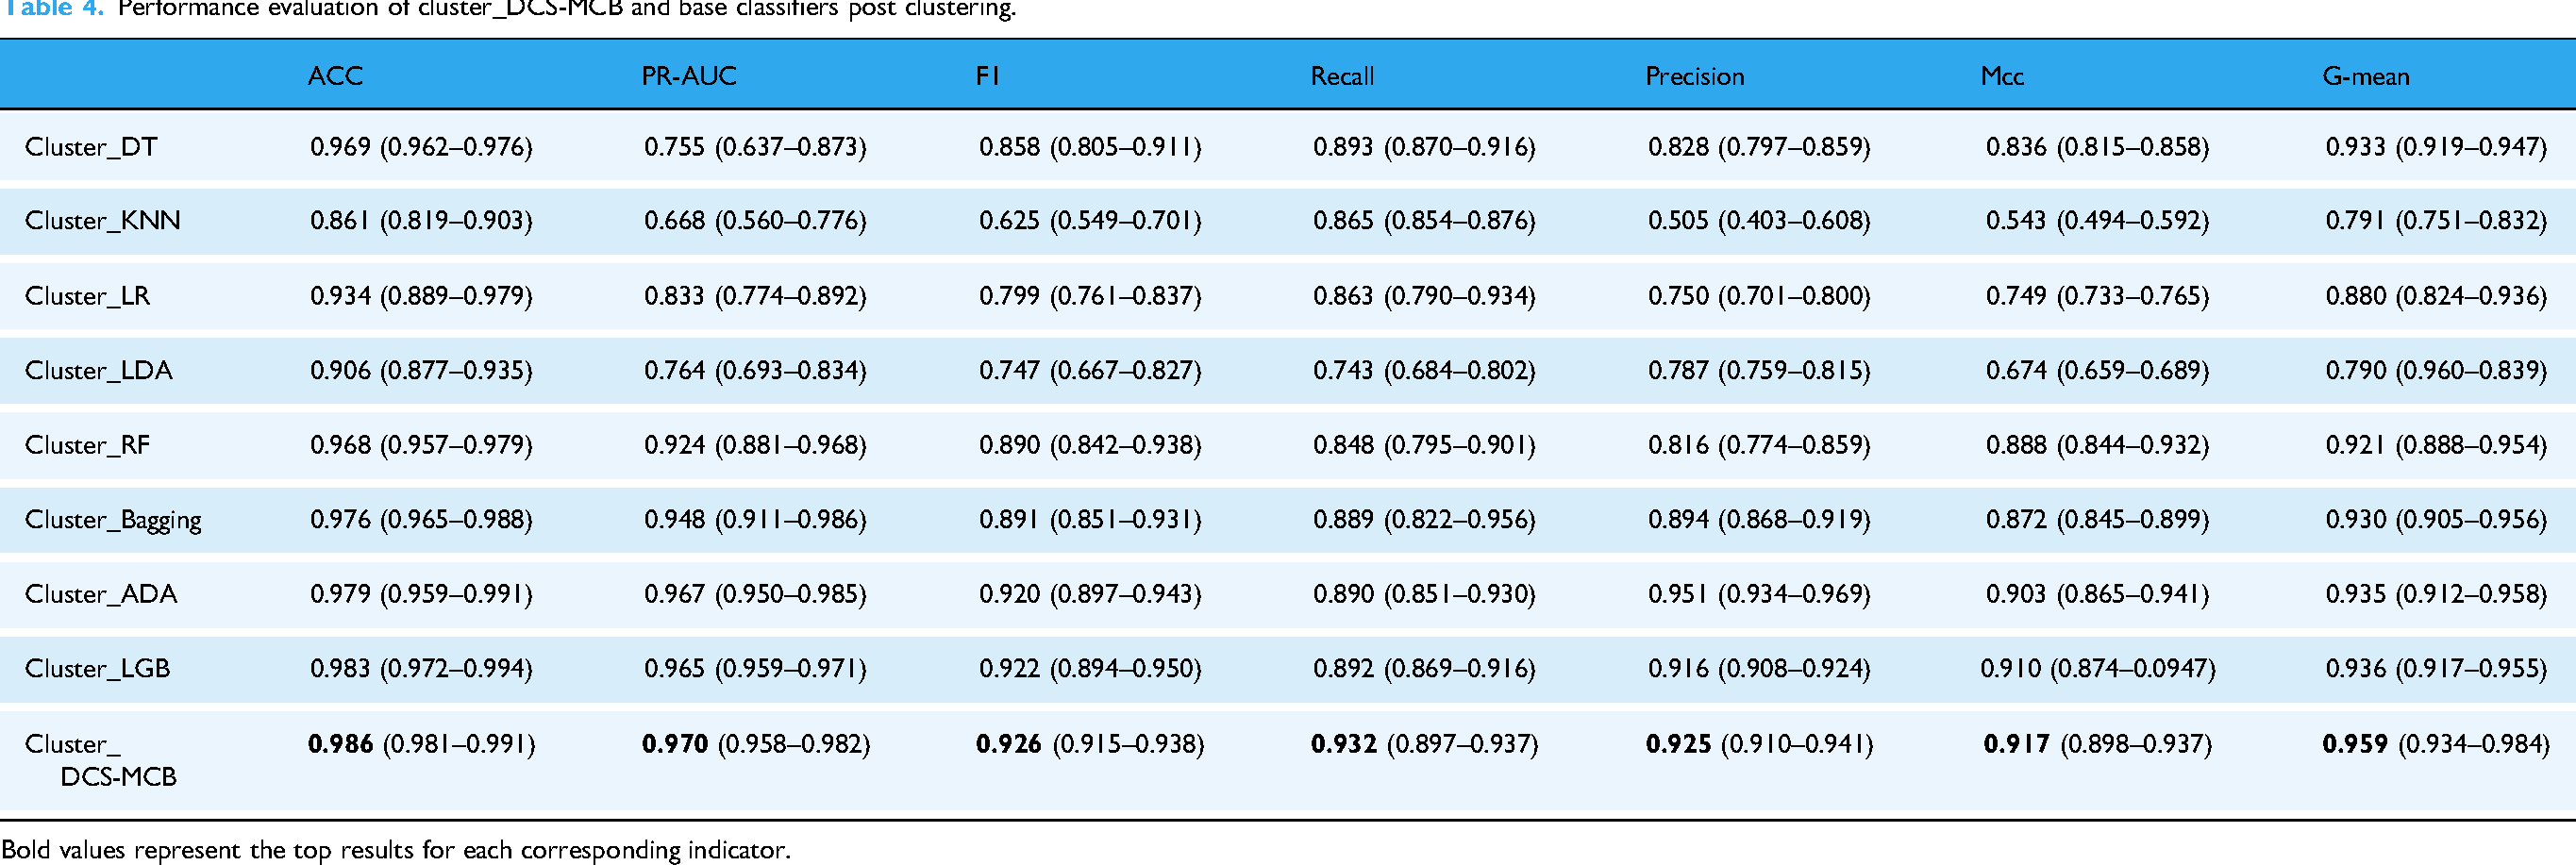
Bold values represent the top results for each corresponding indicator.
Figure 6 shows the normalized confusion matrices for the four clustering groups. In all four clusters, TP > 0.9, showing the DCS_MCB model predicts each category well. Also, misclassification rates (FP and FN) in all four clusters are < 0.1. In clusters 0 and 1, FP = 0, and FN are 0.087 and 0.059 respectively. In clusters 2 and 3, FP (0.022 and 0.05) and FN (0.035 and 0.054) increase slightly but stay low. These results suggest the model has excellent error control across all categories and reliable predictive performance.
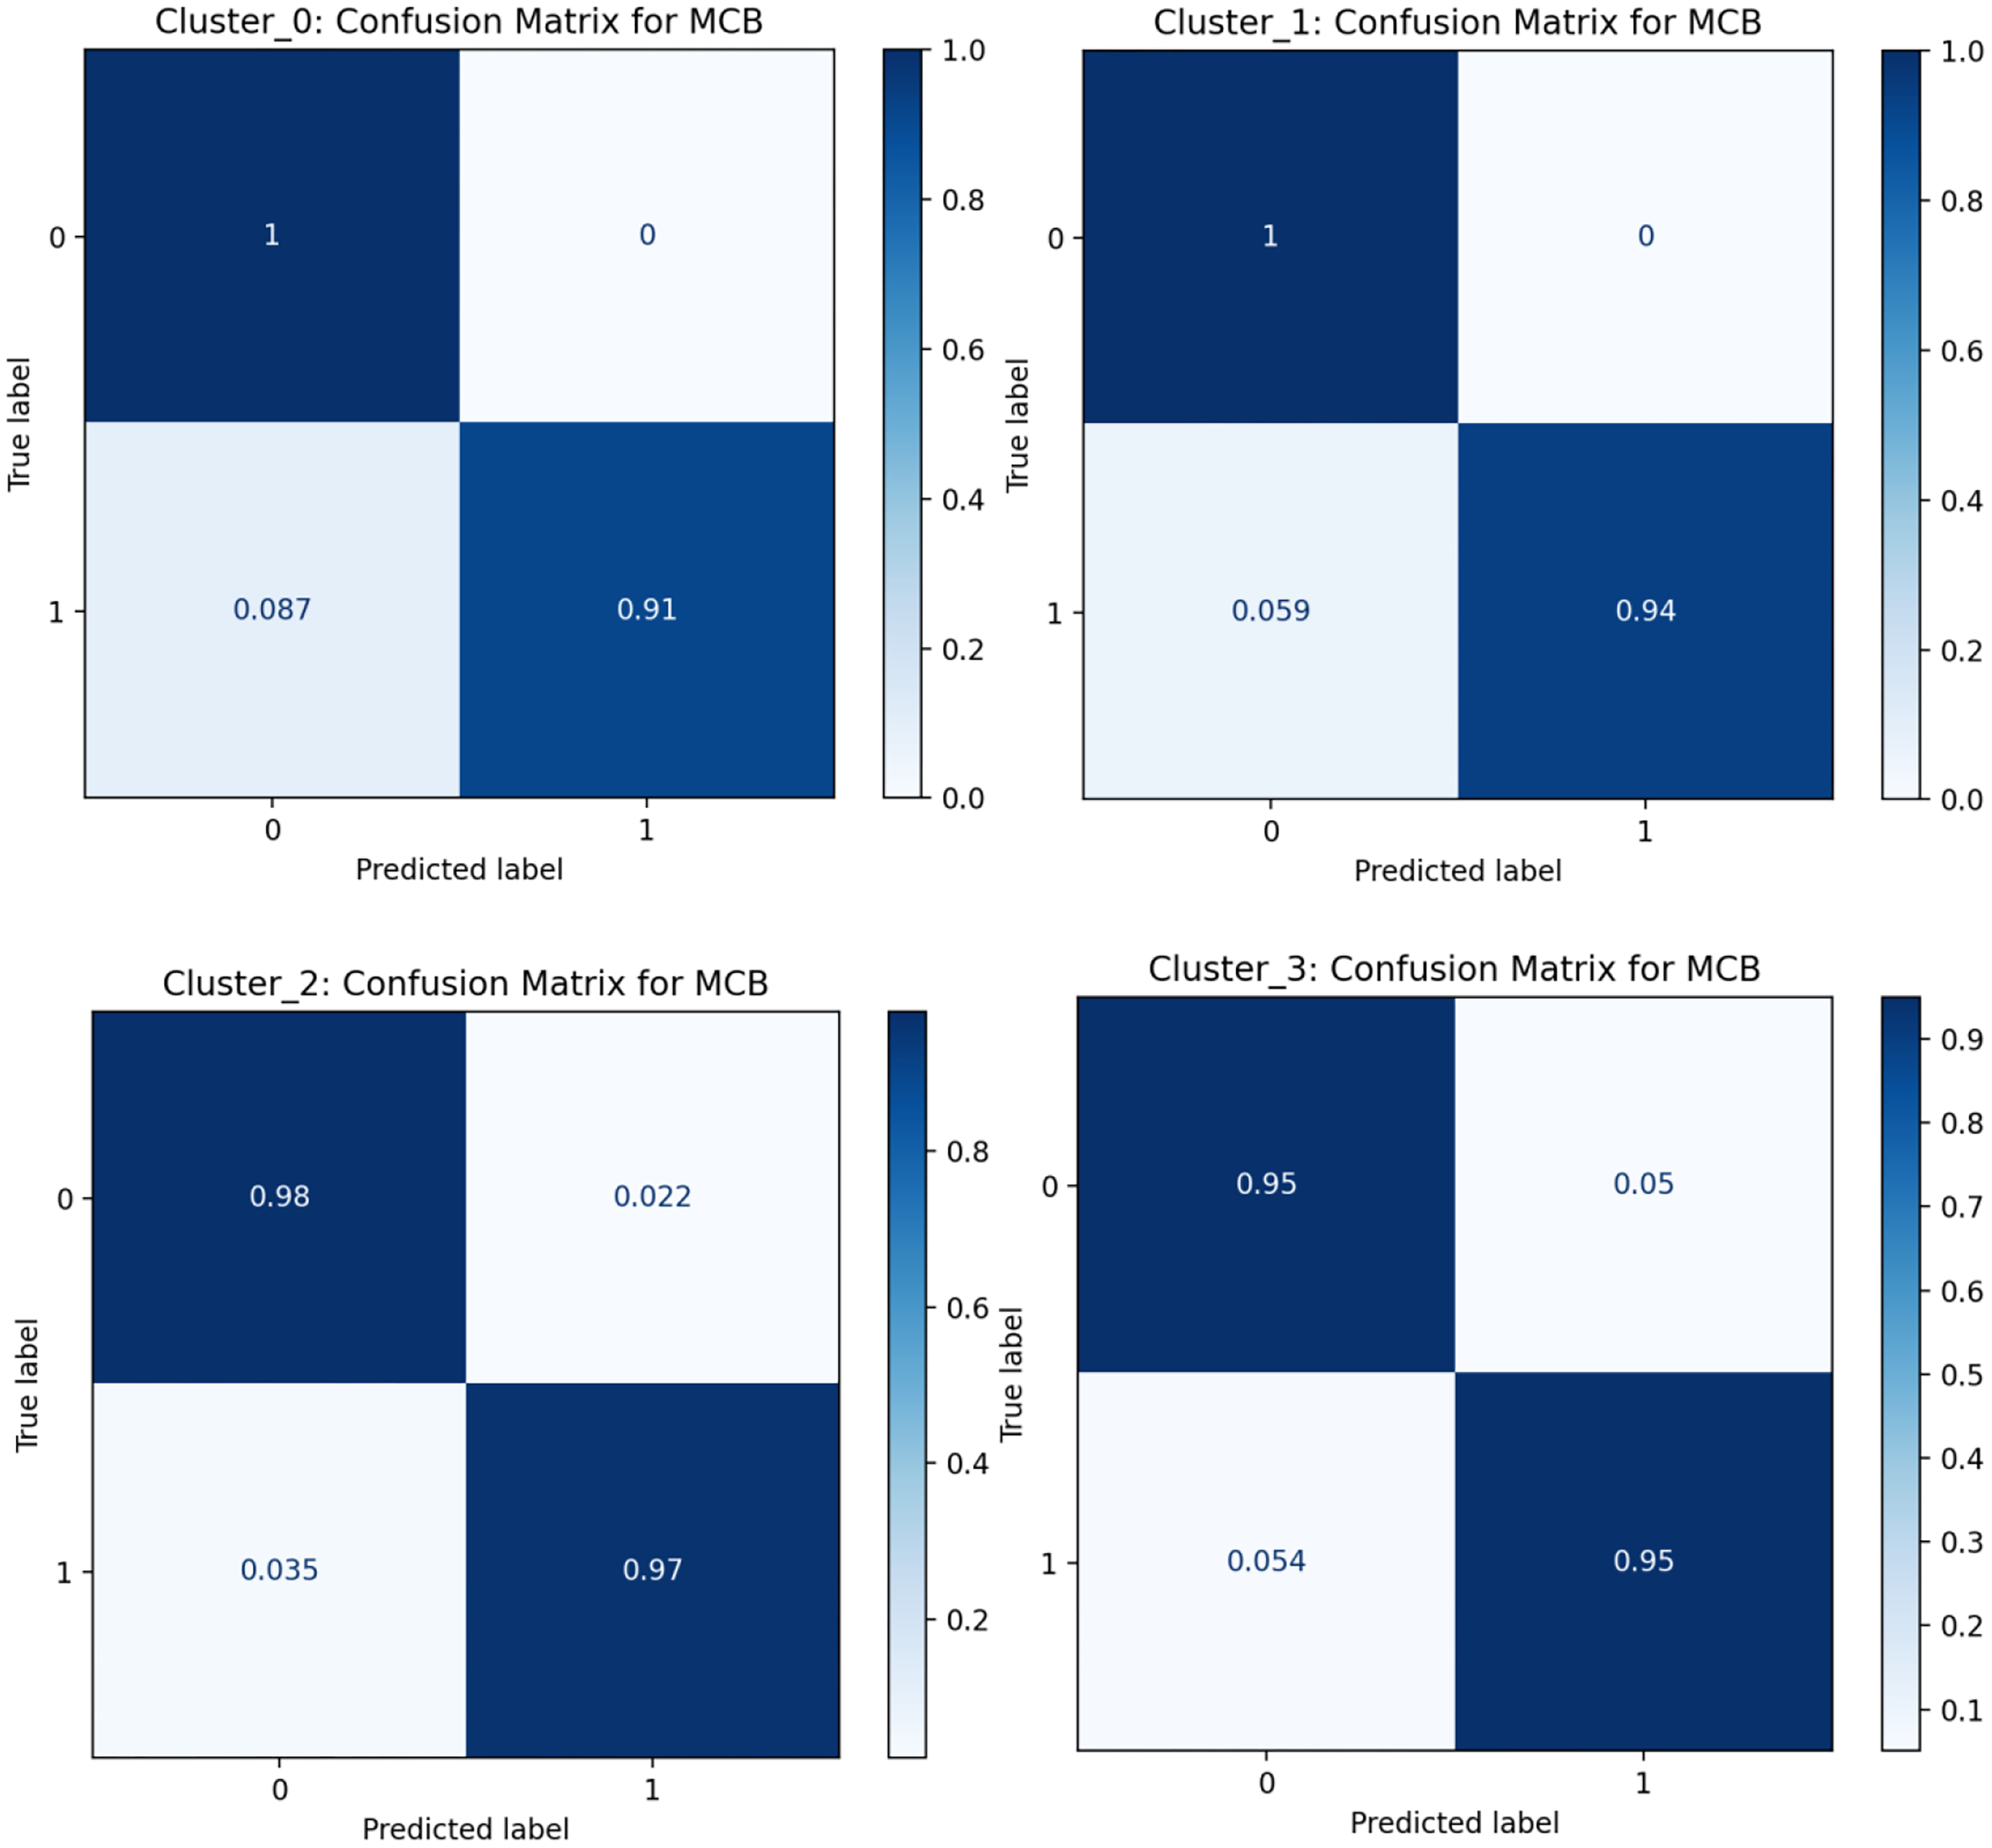
Normalized confusion matrix for four clustering groups.
These findings highlight the need to customize classification models for each data cluster's unique attributes. Varying cluster performance shows the importance of dynamic selection methods that adapt to these differences, improving the model's overall accuracy and robustness. This approach is vital in clinical applications, where accurate, context-specific predictions are key for effective patient management and treatment planning.
In summary, our study demonstrates that the integration of clustering and dynamic selection techniques substantially enhances the accuracy and robustness of pediatric DILI prediction. By stratifying patients into distinct subgroups based on complex underlying diseases and lab indicators, we achieved a more detailed analysis of drug effects across different populations. The proposed Cluster_DCS-MCB framework outperformed all evaluated metrics, highlighting the effectiveness of this hybrid approach. These results emphasize the importance of customizing predictive models to each patient subgroup's unique features, enabling more accurate and personalized clinical decision-making. The approach in this study offers a promising way to advance precision medicine and improve patient outcomes in complex clinical settings.
Interpretability
Experiments show DCS usually finds the best classifier for each patient in every cluster, accurately predicting DILI risk. Whether using a single or multiple classifiers, interpretability methods like SHAP can explain the model's predictions. Figure 7 shows the distribution of feature importance for predicting pediatric DILI risk in one patient subgroup. Higher ALT levels, chemotherapy exposure, more diagnosed diseases, longer hospital stays, more medications, and more frequent hospitalizations were found to significantly increase the predicted DILI risk. The varying feature importance rankings among different clusters match clinical expectations, validating the model's robustness and reliability. Figure 8 depicts the distribution of significant DILI factors in two patients, with predicted probabilities of 0.83 and 0.16. For patient A, elevated GGT, AST/ALT ratio, and number of diagnosed diseases were predictors. For patient B, the AST/ALT ratio, D-DIMER levels, and HBV cAb indicated a lower DILI risk. By identifying key DILI-risk factors for each subgroup, clinicians can better understand individual patient profiles and make tailored medical decisions.

SHAP charts for predicting pediatric DILI risk in one patient subgroup.

Distribution of significant factors in two pediatric DILI patients.
Discussion
The susceptibility factors for pediatric DILI mainly center on the interaction among gender, polypharmacy, and underlying diseases. Although research shows females are more sensitive to DILI, 24 in our study, the proportion of female DILI patients (440/1190) was lower than that of males. This difference might be due to environmental factors or data inclusion criteria. Pediatric DILI patients have higher levels of ALP, GGT, TBIL, DBIL, IBIL, and INR than non-DILI patients, mainly because of hepatocellular apoptosis or necrosis. 25
In cases involving multiple drugs, drug combinations significantly contribute to hepatotoxicity. 9 Drugs like acetaminophen, antibiotics, NSAIDs, antimicrobial agents, and antineoplastic agents are known DILI triggers,26–28 which matches our findings. Also, we observed that drug use patterns and their importance to outcome variables vary among different patient groups. Drug action mechanisms differ too. For example, ceftriaxone shouldn't be given to hyperbilirubinemic neonates as it can displace bilirubin, raising bilirubin levels and reducing unconjugated bilirubin. 29 Symptoms from different drug combinations vary between individuals. Healthcare providers must monitor not just traditional liver injury signs like nonspecific symptoms (fatigue, nausea, jaundice, vomiting) and biochemical dysfunctions (elevated ALT and ALP), but also be aware of common pediatric antibiotics and related drugs causing severe liver injury. Thus, careful consideration of drug dosages, frequencies, and timely assessment of potential symptoms and signs are vital in clinical practice.
Moreover, it is crucial to recognize that misclassification rates (false positives and false negatives) can give rise to ethical issues. In the diagnosis of pediatric DILI, for instance, false positives might result in needless treatment or hospitalizations. This exposes patients to avoidable medical risks, unwanted drug side-effects, and psychological distress. Conversely, false negatives can cause delay in DILI diagnosis and treatment, resulting in more severe liver damage and potentially life-threatening complications. To this end, healthcare professionals must always be cognizant of the potential consequences of misclassifications and utilize the model as an auxiliary decision-making tool, not the sole determinant for decisions. Making treatment decisions requires comprehensively integrating the physician's professional acumen, rich clinical experience, and the model's recommendations to ensure the formulation of more personalized and reliable treatment strategies, thus optimizing patient care and outcomes.
The framework proposed in this study addresses a major shortcoming of traditional methods that treat all patients alike. By optimizing classifiers for the distinct features of each patient subgroup, it enhances both prediction accuracy and robustness. It also proves advantageous in risk stratification, providing practical value for the clinical management of pediatric DILI. However, this study has several limitations. First, this study was confined to a specific region. As a result, the applicability of the currently trained model may have certain limitations. One of the strengths of our proposed framework is its ability to dynamically update the models within the classifier pool, thereby ensuring its continued effectiveness across different scenarios to a certain extent. Second, underreporting remains a persistent problem. This phenomenon may lead to the omission of some pediatric cases, causing the dataset to be skewed towards more severe cases. Consequently, the dataset becomes less representative of the general pediatric population, which could potentially undermine the generalizability and accuracy of our findings. Third, medication patterns, including dosage and frequency, have not been comprehensively taken into account. Additionally, we failed to clearly differentiate between intrinsic and idiosyncratic DILI. Even though we clustered patients according to underlying diseases, medication use, and laboratory parameters, the specific frequency and dosage of medications, which could be vital for assessing the risk of DILI, were not incorporated into the analysis. Finally, the study did not take into account the influences of factors such as genes, drug components and chemical structures,30,31 restricts a more in-depth understanding of DILI etiology and individual risk factors. Further research is expected to thoroughly explore the mechanisms, risk factors, and prognosis of pediatric DILI, and to establish corresponding diagnostic, preventive, and treatment strategies.
Conclusion
This study delves into a framework integrating clustering and dynamic classifier selection, with the aim of enhancing the accuracy and robustness of predictive models for pediatric DILI. The framework identifies the optimal number of clusters and categorizes patients into distinct subgroups. For each subgroup, a dedicated base classifier pool is constructed. Subsequently, the DCS-MCB method is utilized to adaptively pinpoint the most appropriate classifiers for every individual patient. The performance of the proposed framework is compared with common machine-learning models, evaluating its superiority, and assessing the impact of clustering enhancement on both the proposed framework and traditional baselines. Notably, the results demonstrate that the developed model outperforms existing approaches, exhibiting potential in the early identification of high-risk pediatric patients. By characterizing patient subgroups and generating cluster-specific classifiers that account for varying levels of clinical complexity, this framework provides a foundation for developing precise, clinically actionable strategies for patient stratification and drug safety monitoring.
Footnotes
Acknowledgments
The authors would like to thank all who supported this research.
Authors’ contributions
Zixin Shi: Methodology, Investigation, Formal Analysis, Validation, Writing-Original Draft, Software. Linjun Huang: Methodology, Investigation, Formal analysis. Haolin Wang: Conceptualization, Methodology, Validation, Writing-Review & Editing, Supervision, Funding Acquisition.
Data availability statement
The datasets generated and analyzed during the current study are available from the corresponding author on reasonable request.
Declaration of conflicting interests
The authors declared no potential conflicts of interest with respect to the research, authorship, and/or publication of this article.
Ethical approval statement
The study was approved by the ethics committees of Chongqing Medical University (Reference Number: 2023096, Date Approved: Dec 20, 2023), and due to its retrospective nature, this study required no informed consent and represented minimal risk to participants.
Funding
The authors disclosed receipt of the following financial support for the research, authorship, and/or publication of this article: This work was supported by the National Natural Science Foundation of China under Grant 72101040 and Graduate Research Innovation Project of Chongqing under Grant CYS23374.
National Natural Science Foundation of China, Graduate Research Innovation Project of Chongqing, (grant number 72101040, CYS23374).
Guarantor
Haolin Wang.