
Abstract
Objective
Accurate measurement of pelvic floor muscle (PFM) strength is crucial for the management of pelvic floor disorders. However, the current methods are invasive, uncomfortable, and lack standardization. This study aimed to introduce a novel noninvasive approach for precise PFM strength quantification by leveraging extracorporeal surface perineal pressure (ESPP) measurements and machine learning algorithms.
Methods
Twenty-one healthy women participated in this study. ESPP measurements were obtained using a 10 × 10 pressure array sensor during maximal voluntary PFM contractions in a seated position. Simultaneously, transabdominal ultrasound was used to measure bladder base displacement (mm) as a reference for PFM contraction strength. Seven ESPP variables were calculated based on ESPP data and intra- and inter-rater reliabilities were assessed. Machine learning algorithms predicted bladder base displacement from ESPP variables.
Results
The ESPP measurements demonstrated good to excellent intra-rater (ICC = 0.881) and inter-rater (ICC = 0.967) reliability. Significant correlations were observed between bladder base displacement and middle (r = .619, P < .001) and front (r = −.379, P =.002) vectors. The top-performing models for predicting bladder base displacement were the support vector machine [root mean square error (RMSE) = 0.139, R2 = 0.542], random forest (RMSE = 0.123, R2 = 0.367), and AdaBoost (RMSE = 0.123, R2 = 0.320) on the training set, and AdaBoost (RMSE = 0.173, R2 = 0.537), random forest (RMSE = 0.177, R2 = 0.512), and support vector machine (RMSE = 0.178, R2 = 0.508) on the test set. In predicting bladder base displacement, Bland–Altman analysis revealed these models had minimal systematic bias, with mean differences ranging from −0.007 to 0.066, and clinically acceptable limits of agreement.
Conclusion
This study demonstrates the potential of ESPP measurements and machine learning algorithms as a reliable and valid noninvasive approach for assessing PFM strength by quantifying the directionality of contractions, overcoming the limitations of traditional techniques.
Introduction
Accurate measurement of pelvic floor muscle (PFM) strength is crucial for diagnosing and managing pelvic floor dysfunction, a condition that significantly affects the health and quality of life of the female population.1,2 Despite the acknowledged importance of PFM strength in maintaining pelvic health and its association with conditions such as urinary incontinence, pelvic organ prolapse, and sexual dysfunction, current measurement methodologies fail to provide a standardized, noninvasive, and patient-friendly approach.3–5
Traditional measurement techniques, including digital palpation, perineometers, dynamometry, and electromyography (EMG), are associated with limitations such as invasiveness, patient discomfort, and measurement variability.3–6 These challenges not only deter patients from seeking or continuing treatment but also compromise the reliability and accuracy of the measurements.7,8 Specifically, the mismatch in probe and vaginal canal sizes and the sensitivity of EMG measurements to vaginal humidity introduce significant errors that affect the precision of muscle activity readings.9,10
The insertion of a vaginal sensor can result in discomfort or pain, and the innovation of extracorporeal pressure changes has revolutionized the approach to PFM training, offering a noninvasive, engaging, and effective method for enhancing PFM strength using visual biofeedback. Kang et al. (2020) and Lee et al. (2013) have demonstrated the potential of extracorporeal biofeedback devices to facilitate significant improvements in PFM training outcomes.11,12 These studies emphasized the role of visual feedback in promoting accurate muscle contractions, thereby enhancing the effectiveness of PFM training. Lee et al. (2013) explored the use of an extracorporeal biofeedback device for female stress urinary incontinence, finding notable improvements in symptoms and muscle contraction strength. 12 Similarly, PFM training using pressure biofeedback units on the extracorporeal surface perineal region as noninvasive feedback has demonstrated significant improvements in PFM contraction, as evidenced by increased bladder base displacement in healthy women.13,14 These advancements suggest that extracorporeal surface perineal pressure (ESPP) changes could significantly contribute to the noninvasive visual biofeedback strengthening of PFM. However, previous studies have also indicated the need for further research to refine these tools and methods, ensuring that they can accurately quantify PFM strength and provide reliable clinical outcomes.
Transabdominal sonography offers a noninvasive perspective on PFM excursion, providing real-time visualization of muscle movements for PFM strength measurements.3,15 The integration of transabdominal ultrasound with PFM training represents a significant advancement in pelvic health assessment and rehabilitation. 16 Building on the foundation of noninvasive measurement techniques, this study aimed to clarify the reliability and validity of PFM strength measurement through ESPP measurement in healthy women and to utilize machine learning algorithms to predict PFM excursion measured by sonography based on ESPP changes during PFM contraction while sitting. By analyzing data collected from a novel method employing a 10 × 10 pressure array sensor, we propose a groundbreaking approach to accurately quantify PFM strength, mitigating the discomfort associated with traditional measurements and providing a standardized measure that accommodates anatomical variations across individuals. The application of advanced machine learning algorithms to analyze ESPP data has the potential to enhance the accuracy and reliability of PFM strength quantification, ultimately leading to improved diagnostic capabilities and personalized treatment plans for women with pelvic floor dysfunction.
Methods
Participants
The study protocol was approved by the Yonsei University Mirae Campus Institutional Review Board (approval no. 1041849-202204-BM-070-03). Before participating in the study, we explained all experimental procedures to the subjects, and they provided written informed consent. A minimum sample size of 19 is required to detect at least a significant moderate correlation (α = .05; β = .20; r = .60), 17 which would be necessary to draw the conclusion that the ESPP using 10 × 10 pressure array sensor is a valid method. As such, a sample size of 21 was selected to provide adequate statistical power reasonably above the estimated sample size requirement. This study of intra- and inter-rater reliabilities and validity was performed at our laboratory from September 2022 to December 2022 (Figure 1). Inclusion criteria required that women had adequate practice at the first visit to perform voluntary contraction of the PFMs correctly with a verbal command. 18 Women were not included based on self-report of pelvic floor disorders such as urinary or fecal incontinence or pelvic organ prolapse stage 1 or 2. Participants were excluded if they were pregnant, less than 6 months post-partum, had dyspareunia, had a history of major pelvic trauma, or had previous sex reassignment surgery.17,18 Participants attended two visits to the laboratory, scheduled around the menstrual cycle, but not standardized across the study sample. The means and standard deviations of baseline characteristics are presented in Table 1.
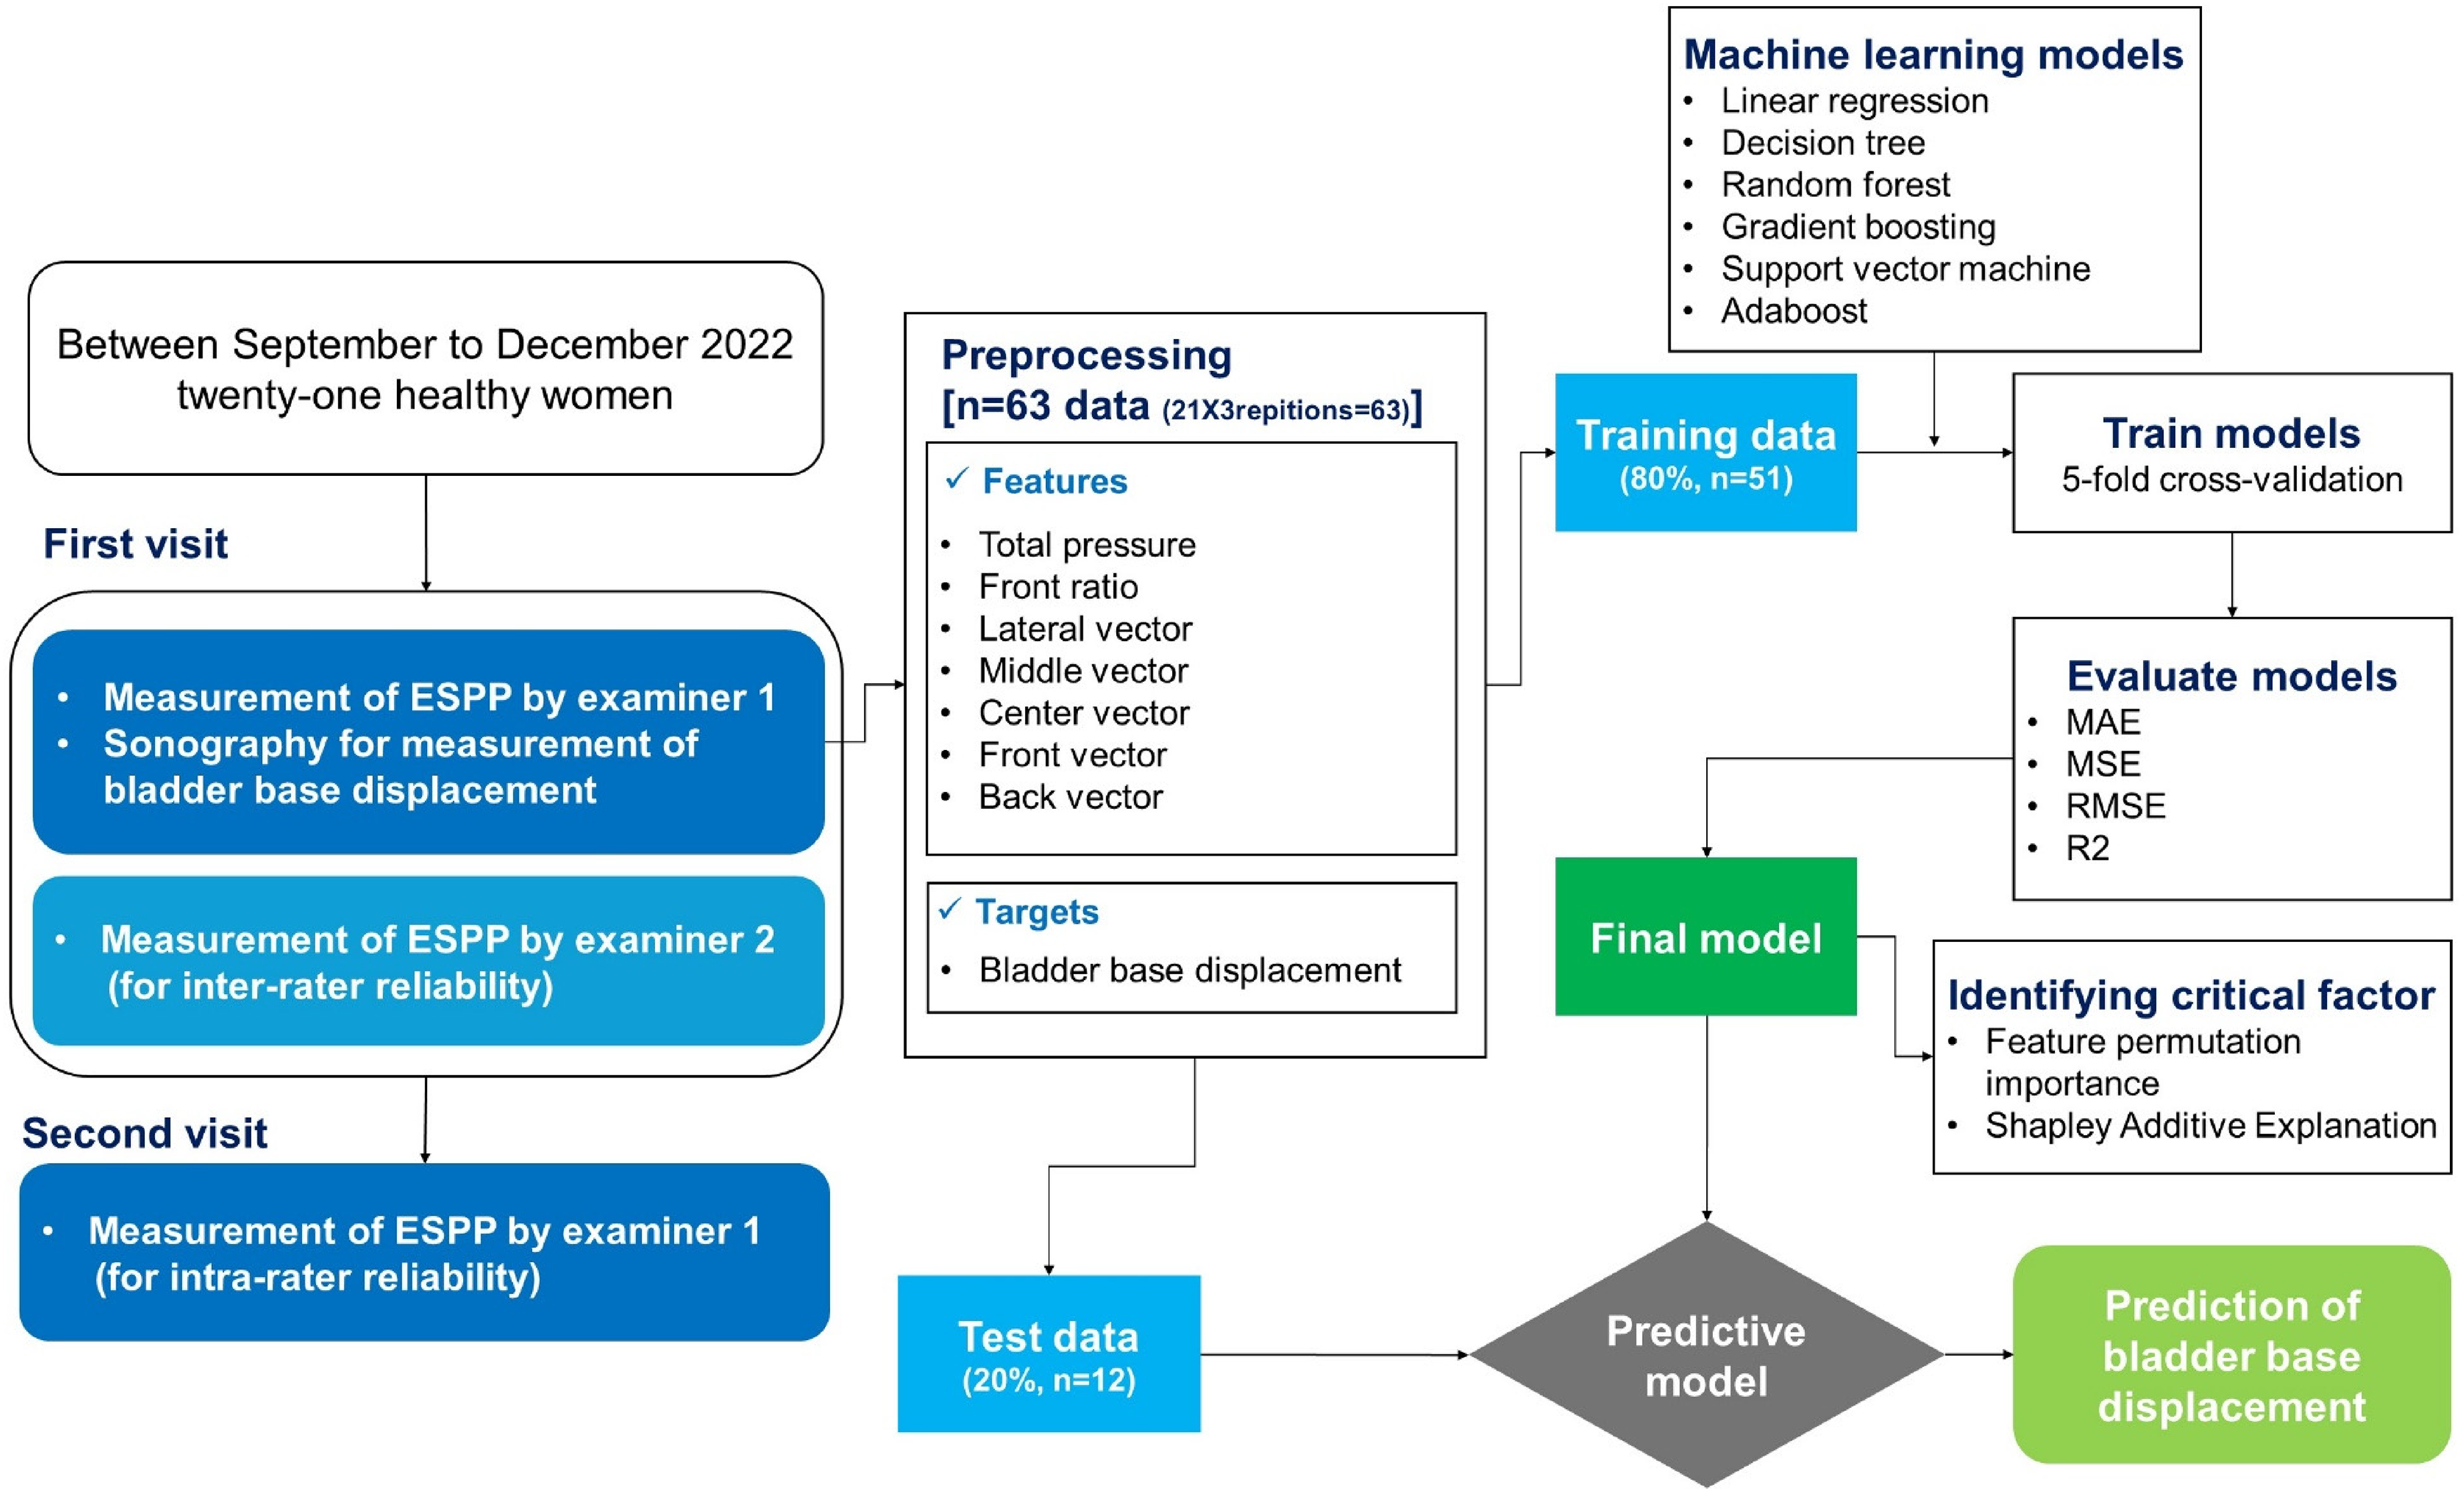
Flowchart of intra- and inter-rater reliability analysis and machine learning algorithm development.
Mean and standard deviation of baseline characteristics.

Measurement of extracorporeal surface perineal pressure
The spatiotemporal pressure distribution of the ESPP was evaluated using a fully instrumented nondeformable semicylinder covered by a 10 × 10 matrix of flexible pressure sensor arrays (PM100-B, Polyworks; Gyeonggi-do, Korea) (Figure 2). In the 10 × 10 matrix of flexible pressure sensor arrays, the measurements of each matrix were recorded in arbitrary units. The nondeformable semicylinder covered by flexible pressure sensor arrays was positioned centrally on the chair. Rubber markers were placed on either side of the semicylinder to ensure consistent seating alignment with the ischial tuberosity. The semicylinder surface was 93 mm in width and 130 mm in length, and its sensing area was 93 × 93 mm. The capacitive sensors had a measurement range of 3–100 kPa, enabling unidirectional measurements with high spatial resolution. The Pelvsense measurement system (WAVEON; Gyeonggi-do, Korea) integrates the sensor array with dedicated data acquisition hardware and analysis software. The system employs a data acquisition unit that connects to the sensor array through a shielded cable for initial signal processing. Data is transmitted wirelessly via Bluetooth to an Android tablet running specialized analysis software, enabling real-time visualization of pressure distribution patterns and continuous data recording. Prior to each measurement session, the system undergoes zero-point calibration to ensure accuracy. Participants are carefully positioned on the measurement device with their ischial tuberosities aligned with rubber markers for consistent positioning. During measurement, the system continuously records pressure data at 30 Hz, capturing both resting and contraction phases. The analysis software provides real-time pressure mapping and calculates various pressure-related variables essential for assessing PFM function.
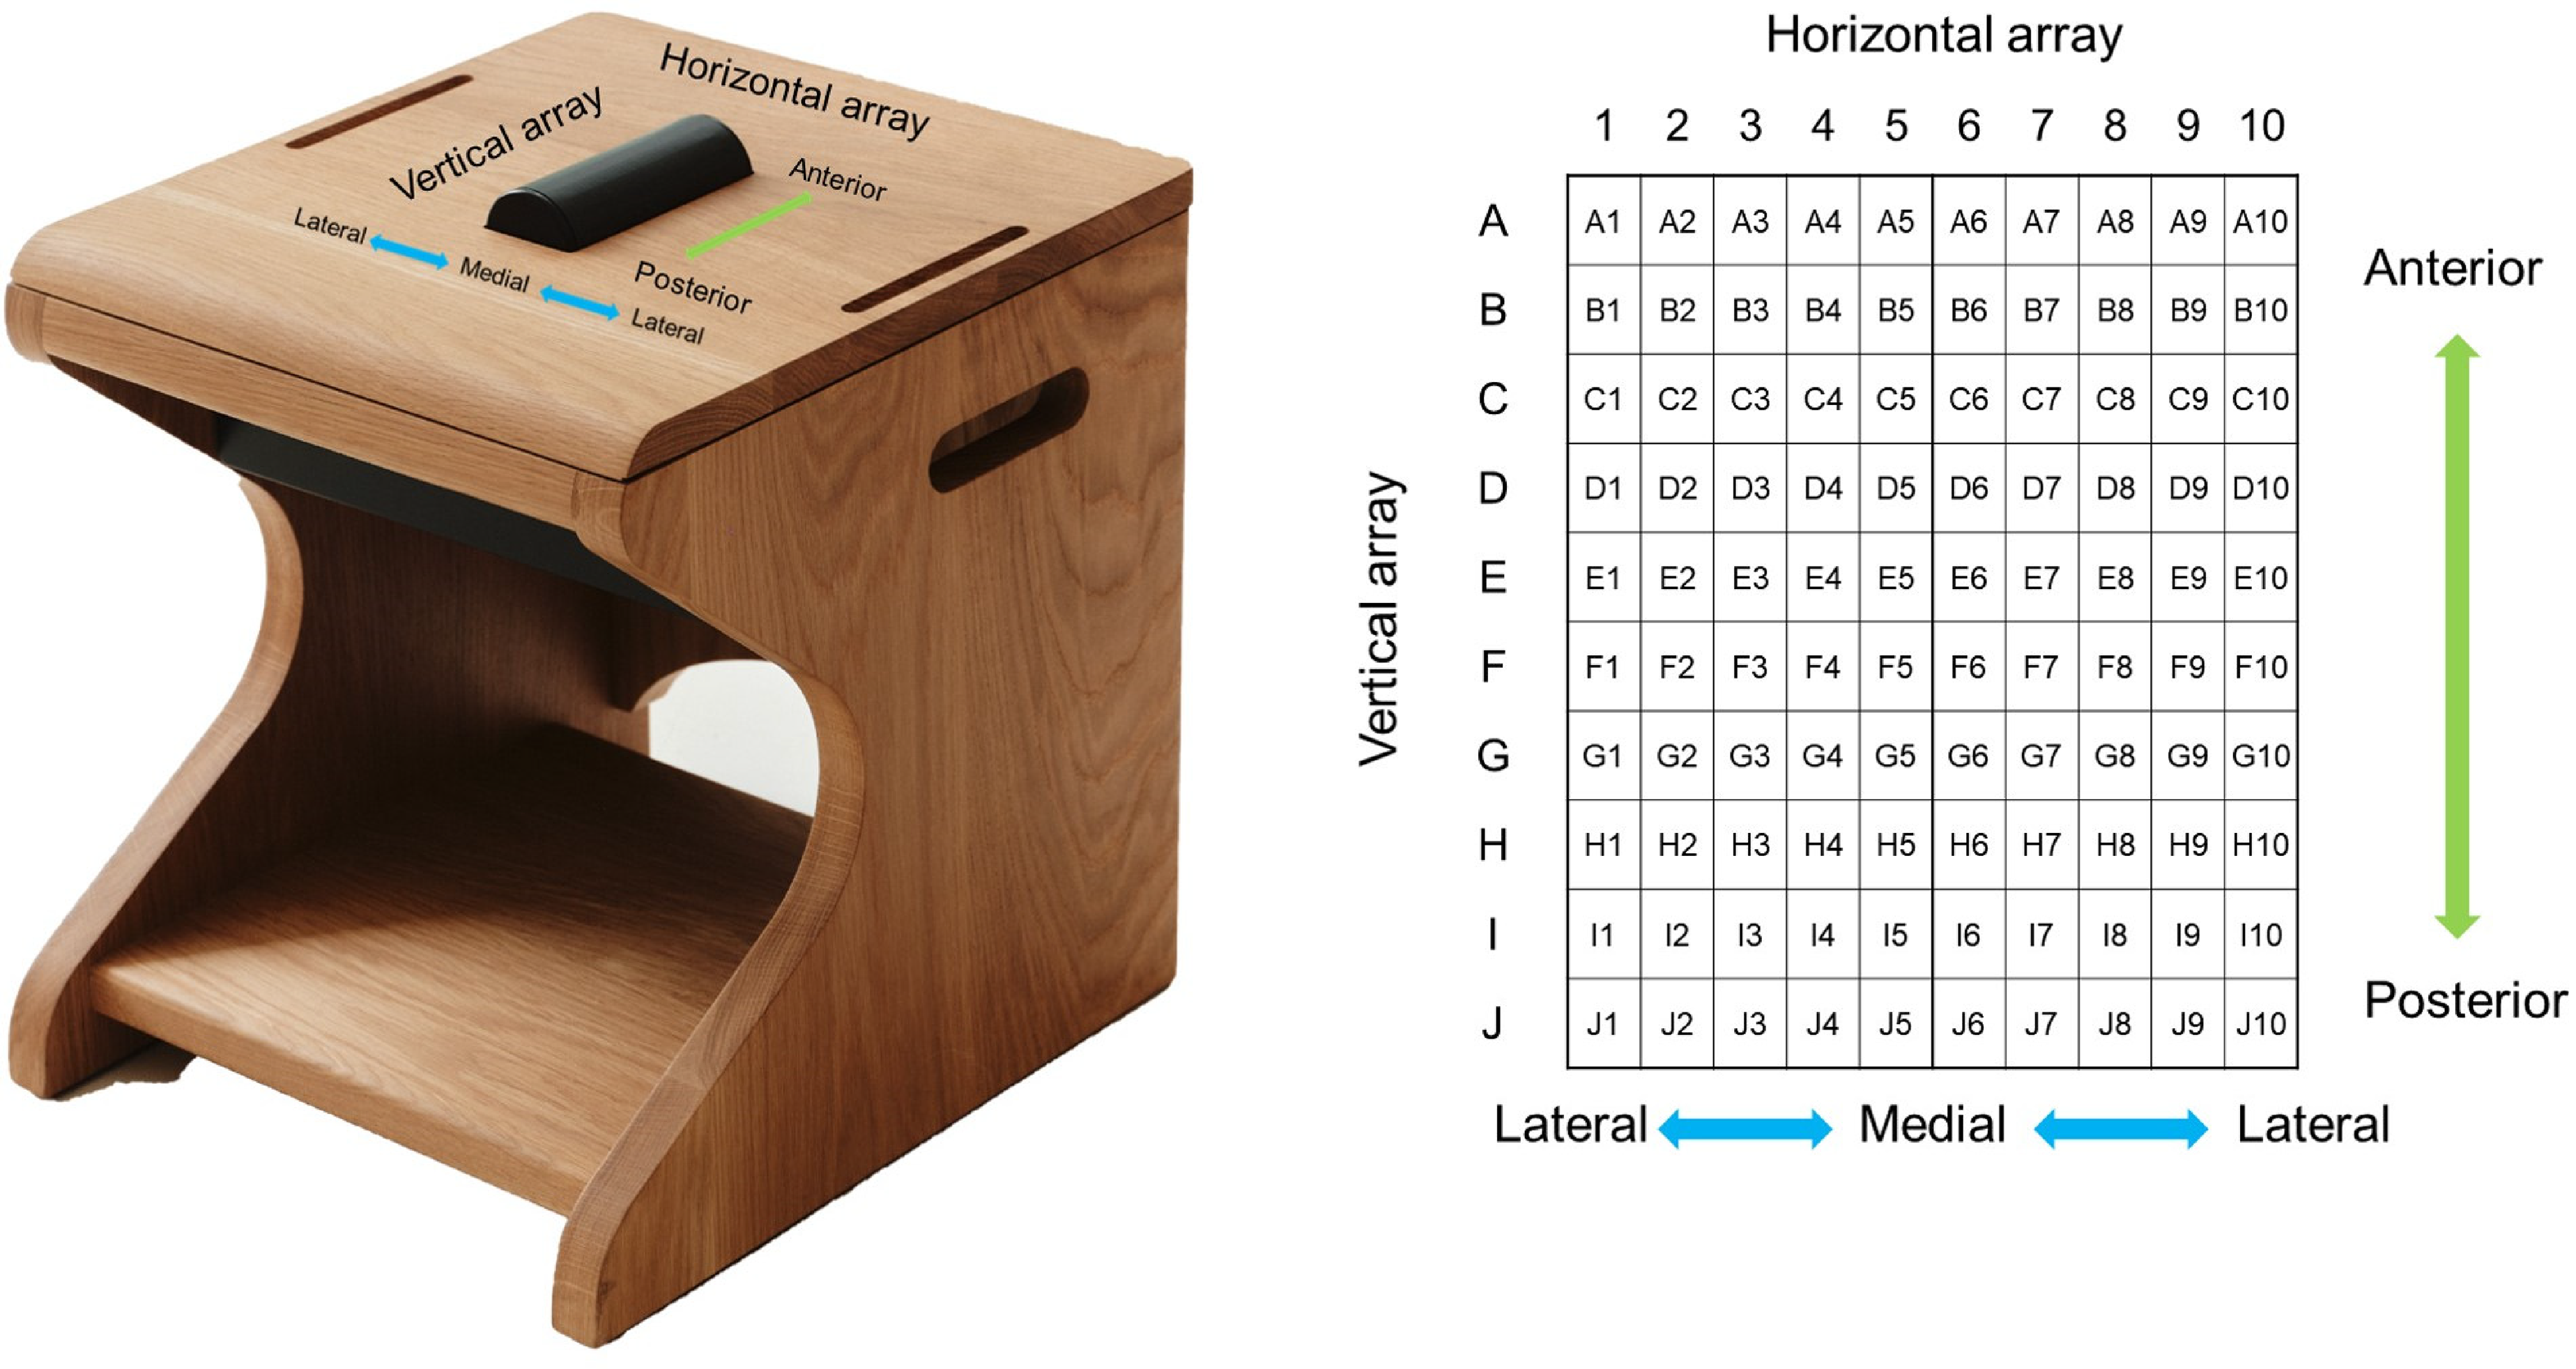
Measurement of extracorporeal surface perineal pressure using 10 × 10 matrix of flexible pressure sensor arrays.
Pressure-related variables were acquired as the participants performed PFM maximal voluntary contraction while breathing normally, with a 1-minute rest period between trials. The tester adjusted the subjects’ sitting position to a neutral pelvic position on the chair. We defined the pelvic neutral position as when the angle between the anterior superior iliac spine and the posterior superior iliac spine was 0 degrees. When measuring ESPP, the participant was initially kept in a resting state without any trunk or buttock movement for 5 seconds. Then, with a verbal cue, the participant was instructed to maximally contract the PFM for 5 seconds. The PFM maximal voluntary contraction consisted of three trials of PFM maximum contractions maintained for 5 seconds each, where the participants had to ‘'lift” and ‘'squeeze” their PFM as hard as possible, 19 and the ESPP data was calculated from the middle 3 seconds during PFM maximal voluntary contraction. 1 The ESPP values measured during contraction were adjusted using the average values measured during the initial 5 seconds of the resting state.
Measurement of the PFM contraction using sonography
Transabdominal ultrasound measurements of PFM function were performed using an ultrasound imaging unit set in M-mode (A35; Samsung Medison, Seoul, Korea) with a 5 MHz convex transducer. A standardized bladder-filling protocol was used prior to imaging. The evaluated women were asked to fill the bladder by consuming 500–750 mL of water, 1 h before the measurements.14,16 This procedure allowed for clear imaging of bladder base movement. The ultrasound probe was placed in transverse orientation, across the midline of the abdomen, immediately superior to the pubic symphysis. The angle of the probe was adjusted to approximately 60° from the vertical position and aimed towards the gluteal or postero-inferior region of the bladder until a clear image of the bladder was visible.3,15 Measurement of the PFM contraction using sonography were taken simultaneously with measurement of ESPP in a seated position, applying the same position and verbal cue.
Transabdominal ultrasound imaging is primarily used to assess the lifting aspect of a PFM contraction by observation of movement of the bladder base as a marker for PFM activity during voluntary PFM contraction. The technique has also been used to assess the amount of movement at the bladder base during PFM contraction. Good intra-rater and inter-rater reliability for measurement of bladder base displacement (transverse views) between resting and PFM contraction (ICC, 0.81–0.88). 15
Procedure
In the first visit, participants were instructed on the performance of the two tasks involved in the protocol: resting tasks, in which the PFMs remain relaxed, and PFM maximal voluntary contraction tasks, which involve both squeezing and lifting the PFM without engaging accessory muscles. Measurement of the PFM contraction using sonography was taken simultaneously with measurement of ESPP in a seated position. Participants were then instructed to perform three trials for PFM maximal voluntary contraction in a seated position, including standardized encouragement and a 3-second rest between contractions. Examiner 1 measured ESPP, and examiner 2 measured ultrasound. After a 10-min rest break, participants were remeasured by examiner 2 only for ESPP, applying the same protocol for inter-rater reliability. Examiner 1 was a physiotherapist with 6 years of clinical experience. Examiner 2 was a physiotherapist with 8 years of clinical experience and 6 years of educational experience in a university institution. Two examiners had completed specialized training in pelvic floor ultrasound assessment and had extensive experience in transabdominal ultrasound measurement of bladder base displacement.
A second day of testing was scheduled within 7 days of the first measurement. In the second visit, before the measurement of ESPP, women were asked to fill the bladder by consuming 500–750 mL of water 1 h prior to control the bladder's condition to be similar to that of the first visit measurement. Participants were measured by examiner 1 only for ESPP, applying the same protocol for intra-rater reliability.
Data source and collection
We calculated seven variables (total pressure, front pressure ratio, lateral vector, middle vector, center vector, front vector, and back vector) based on the ESPP changes during PFM contractions using a 10 × 10 pressure array sensor. The sensor recorded data at a frequency of 30 Hz for each cell over a total duration of 10 s, with the initial 5 s in a resting state, followed by 5 s of sustained PFM contraction. In the 10 × 10 pressure array, columns (horizontal array) are designated as 1 to 10, and rows (vertical array) are designated as A to J. The seven variables were calculated by determining the difference between the average values for the middle 3 s of both the contraction and resting periods. The definitions and calculations for each variable are as follows (Figure 3):
Total pressure: The sum of the values from all 100 cells in the pressure array. Front ratio: The sum of the values from the front 5 rows (A to E) and all 10 columns (1 to 10), divided by the total pressure. Lateral vector: The average of the left lateral vector (average difference between the values in column 3 and column 2 for each row from A to J) and the right lateral vector (average difference between the values in column 8 and column 9 for each row from A to J). Middle vector: The average of the left middle vector (average difference between the values in column 4 and column 3 for each row from A to J) and the right middle vector (average difference between the values in column 7 and column 8 for each row from A to J). Center vector: The average of the left center vector (average difference between the values in column 5 and column 4 for each row from A to J) and the right center vector (average difference between the values in column 6 and column 7 for each row from A to J). Front vector: The average of the upper vector (average difference between the values in row A and row C for each column from 1 to 10) and the lower vector (average difference between the values in row C and row E for each column from 1 to 10) in the front area. Back vector: The average of the upper vector (average difference between the values in row E and row G for each column from 1 to 10) and the lower vector (average difference between the values in row G and row I for each column from 1 to 10) in the back area.
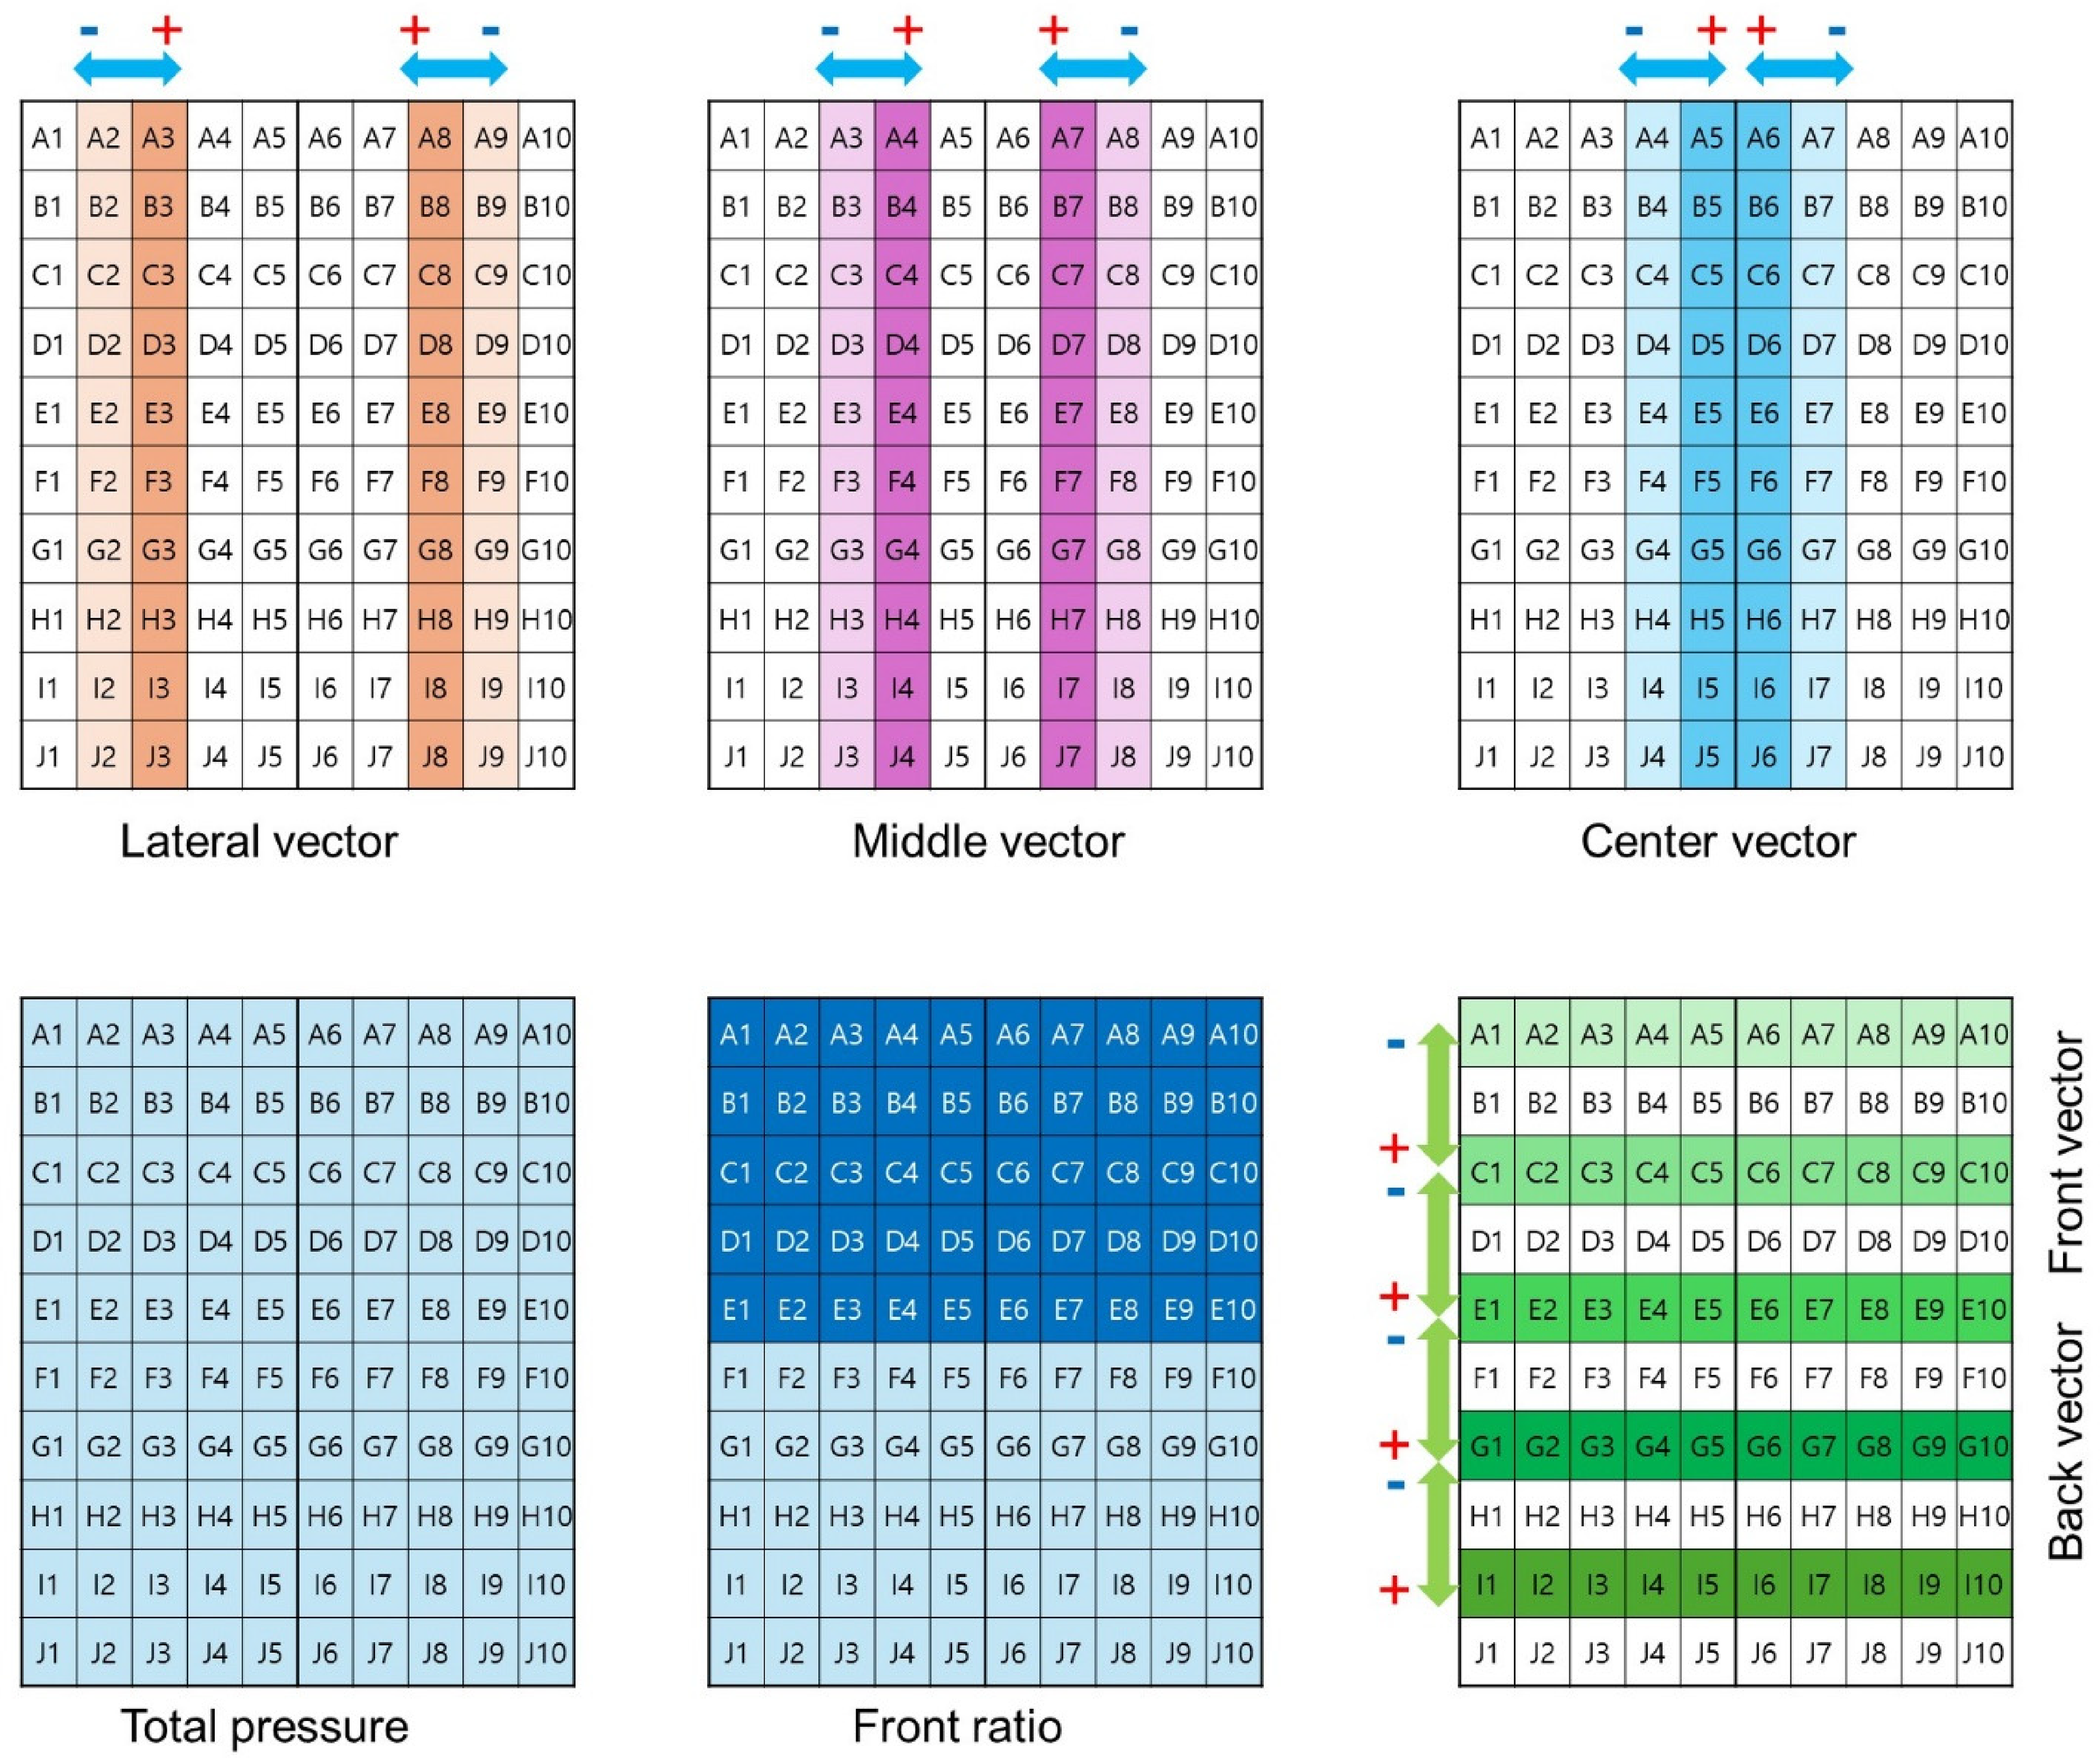
Area of calculations for seven variables using extracorporeal surface perineal pressure data.
The interpretation of these variables provides insights into the distribution and direction of forces applied to the pressure array during PFM contractions. A higher value of total pressure indicates a greater overall force applied to the entire pressure array, while a higher front ratio suggests that a larger proportion of the total force is applied to the front 5 rows of the pressure array. The lateral, middle, and center vectors represent the pressure changes in their respective columns, with a positive value indicating a greater tendency for the force to move inward and a negative value suggesting a greater tendency for the force to move outward. Similarly, the front and back vectors represent the pressure changes in their respective rows, with a positive value indicating a greater tendency for the force to move backward and a negative value suggesting a greater tendency for the force to move forward.
Statistical analysis
Statistical analyses for intra- and inter-rater reliability of ESPP were performed using SPSS ver. 18.0 software (IBM Co., Armonk, NY, USA). The machine learning analysis was performed using Orange data mining software (Orange 3.3.0, Ljubljana, Slovenia) and Python (Version 3.6.15). While the primary model development and evaluation were conducted using the Orange ML framework, we performed additional hyperparameter tuning using Python's scikit-learn library. Specifically, we implemented grid search with 5-fold cross-validation using GridSearchCV to optimize the parameters of each model. This process was performed only on the training dataset to avoid any data leakage. Model performance metrics were calculated using Orange's built-in evaluation modules. 20
Intra- and inter-rater reliability
In the reliability analysis, we used the mean values of three repeated measurements from 21 participants. Intra-rater (intraclass correlation coefficient, ICC [3,3]) reliability between first and second visits was determined using an intraclass correlation coefficients (ICCs) with 95% confidence intervals (CIs). The ICC (2,3) model was used to test inter-rater reliability by calculating across raters in first visit. The ICCs were interpreted as follows: ICC values less than 0.5 (poor), values between 0.50 and 0.75 (moderate), values between 0.75 and 0.90 (good), greater than 0.90 (excellent). 17
Pre-processing and machine learning algorithms
The implementation process consists of two main algorithms: ESPP data processing and machine learning implementation, as detailed in Table 2. The ESPP data processing algorithm handles the raw pressure data from the 10 × 10 sensor array and calculates the seven ESPP variables. The machine learning implementation algorithm describes the process of model training and evaluation using these processed variables to predict bladder base displacement. For the machine learning analysis, we utilized the individual data points from the three repeated measurements of each participant, resulting in a total of 63 data points for analysis. 21 Seven numeric features (total pressure, front pressure ratio, lateral vector, middle vector, center vector, front vector, and back vector) and bladder base displacement measured by sonography as numeric target were included in the present study. Exploratory data analysis was performed to detect missing data. Imputation for handling missing data was performed by eliminating instances with unknown values. The distribution of each variable was confirmed as a boxplot. Pearson's correlation coefficient was used to analyze the relationships between seven numeric features (total pressure, front pressure ratio, lateral vector, middle vector, center vector, front vector, and back vector) and bladder base displacement.
Algorithm implementation: (1) ESPP data processing and (2) machine learning implementation.

From the complete data (n = 63), we split the data into a training set (80%, n = 51) for model development and a test set (20%, n = 12) for external validation to predict performance. Six machine learning algorithms, including linear regression, decision tree, AdaBoost, Extreme Gradient boosting machines, random forest, and support vector machine, were trained via 5-fold cross-validation.
The hyperparameters for each machine learning model were optimized through grid search with 5-fold cross-validation using scikit-learn's GridSearchCV in the training set. The optimal parameters for each model were as follows: Linear regression was fitted with intercept (fit_intercept = True). The support vector machine was configured with a radial basis function kernel (kernel='rbf’), regularization parameter C = 1.0, epsilon = 0.1, and scaled gamma. The random forest regressor was optimized with 50 estimators, maximum depth of 10, minimum samples split of 5, and minimum samples leaf of 1. The decision tree regressor used a maximum depth of 5, minimum samples split of 2, and minimum samples leaf of 1. The extreme gradient boosting regressor was configured with a learning rate of 0.01, maximum depth of 3, and 100 estimators. Finally, the AdaBoost regressor was implemented with a learning rate of 0.1, exponential loss function, and 50 estimators. These parameters were selected based on their optimal performance in cross-validation.
Model validation
To evaluate the performance of the machine learning models, we employed a comprehensive set of evaluation metrics, including mean absolute error (MAE), mean square error (MSE), root mean square error (RMSE), and coefficient of determination (R2). These metrics were calculated for both the training and test datasets to assess the models’ predictive accuracy and generalization capability. MAE, MSE, and RMSE are widely used regression metrics that quantify the average magnitude of the errors between the predicted and actual values. MAE measures the average absolute difference between the predicted and actual values, while MSE calculates the average squared difference. RMSE is the square root of MSE and provides a measure of the average prediction error in the same units as the target variable. These metrics range from 0 to ∞, with lower values indicating better model performance. A value of 0 represents a perfect fit, where the predicted values exactly match the true values. R2, also known as the coefficient of determination, is a statistical measure that represents the proportion of the variance in the dependent variable that is predictable from the independent variable(s).
Bland-Altman analysis was performed to assess the agreement between predicted and actual bladder base displacement values for each machine learning model. This analysis included the calculation of mean differences (bias), 95% limits of agreement, and visualization through Bland-Altman plots. The mean difference indicates systematic bias in predictions, while the limits of agreement (mean difference ± 1.96 standard deviations) represent the range within which 95% of the differences between predicted and actual values are expected to fall.
To gain further insights into the importance and contribution of each predictive variable to the model's performance, we conducted feature permutation importance analysis using the training dataset.20,22 This technique involves randomly shuffling the values of each feature and measuring the resulting increase in the model's prediction error. Features that cause a larger increase in error when permuted are considered more important to the model's predictions based on the RMSE. Additionally, we generated Shapley Additive Explanation summary plots to visualize the importance and direction of each predictive variable's impact on the model's output.20,22 Shapley Additive Explanation values provide a unified measure of feature importance by calculating the contribution of each feature to the model's predictions for individual instances. In the summary plot, the predictive variables are sorted along the y-axis based on their relative importance, with the most influential features at the top. Each point on the x-axis represents an individual participant's contribution to the overall Shapley Additive Explanation value for a given feature, with red points indicating higher feature values or the presence of binary factors. Points further to the right signify larger positive contributions to the model's predictions.
Results
Intra- and inter-rater reliability
Table 3 shows the between-session intra-rater reliability using three repetitions of each maximum voluntary contraction by ESPP for examiner 1. For examiners 1, ESPP had ICC (3, 3) values of 0.881. The within-session inter-rater reliability for ESPP was ICC (2, 3) = 0.967 for ESPP.
Intra- and inter-rater reliability analysis for the extracorporeal surface perineal pressure measurements for examiners 1 and 2.

Relationships between ESPP and bladder base displacement
The correlation coefficients between ESPP and bladder base displacement is presented in Table 4. Significant correlations between the bladder base displacement measured by sonography and middle (r = .619, P < .001) and front vector (r = −.379, P = .002) in the measurements of ESPP (Figure 4). Significant correlations were not confirmed between bladder base displacement and total pressure, front ratio, center, lateral and back vector.

Scatter plot between the bladder base displacement measured by sonography and (A) middle and (B) front vector in the measurements of ESPP.
The correlation coefficients between extracorporeal surface perineal pressure and bladder base displacement.

Predictive models of machine learning
The performance of the six machine learning models for predicting bladder base displacement during model training and testing is presented in Table 5.
Performance metrics of six machine learning algorithms in the training and test set.

The six machine learning models were ranked for their performance (based on RMSE) in predicting bladder base displacement using the training dataset as follows: support vector machine (RMSE, 0.139; R2, 0.542), random forest (RMSE, 0.123; R2, 0.367), AdaBoost (RMSE, 0.123; R2, 0.320), decision tree (RMSE, 0.181; R2, 0.222), linear regression (RMSE, 0.163; R2, 0.119), and extreme gradient boosting (RMSE, 0.172; R2, 0.096) (Table 5 and Figure 1). The six machine learning models were ranked for their performance (based on RMSE) in predicting bladder base displacement using the test dataset as follows: AdaBoost (RMSE, 0.173; R2, 0.537), random forest (RMSE, 0.177; R2, 0.512), support vector machine (RMSE, 0.178; R2, 0.508), decision tree (RMSE, 0.206; R2, 0.340), linear regression (RMSE, 0.216; R2, 0.278), and extreme gradient boosting (RMSE, 0.220; R2, 0.250) (Table 5 and Figure 1).
Bland-Altman analysis revealed consistent agreement patterns across different models (Figure 5). All models showed minimal systematic bias, with mean differences close to zero: SVM (mean difference: 0.001; 95% limits of agreement: −0.290 to 0.293), Random Forest (mean difference: −0.007; limits: −0.323 to 0.309), Linear Regression (mean difference: −0.002; limits: −0.373 to 0.368), AdaBoost (mean difference: −0.036; limits: −0.360 to 0.287), Gradient Boosting (mean difference: 0.066; limits: −0.305 to 0.436), and Decision Tree (mean difference: 0.001; limits: −0.368 to 0.369). The narrow limits of agreement and minimal systematic bias across all models suggest reliable prediction patterns suitable for clinical applications.
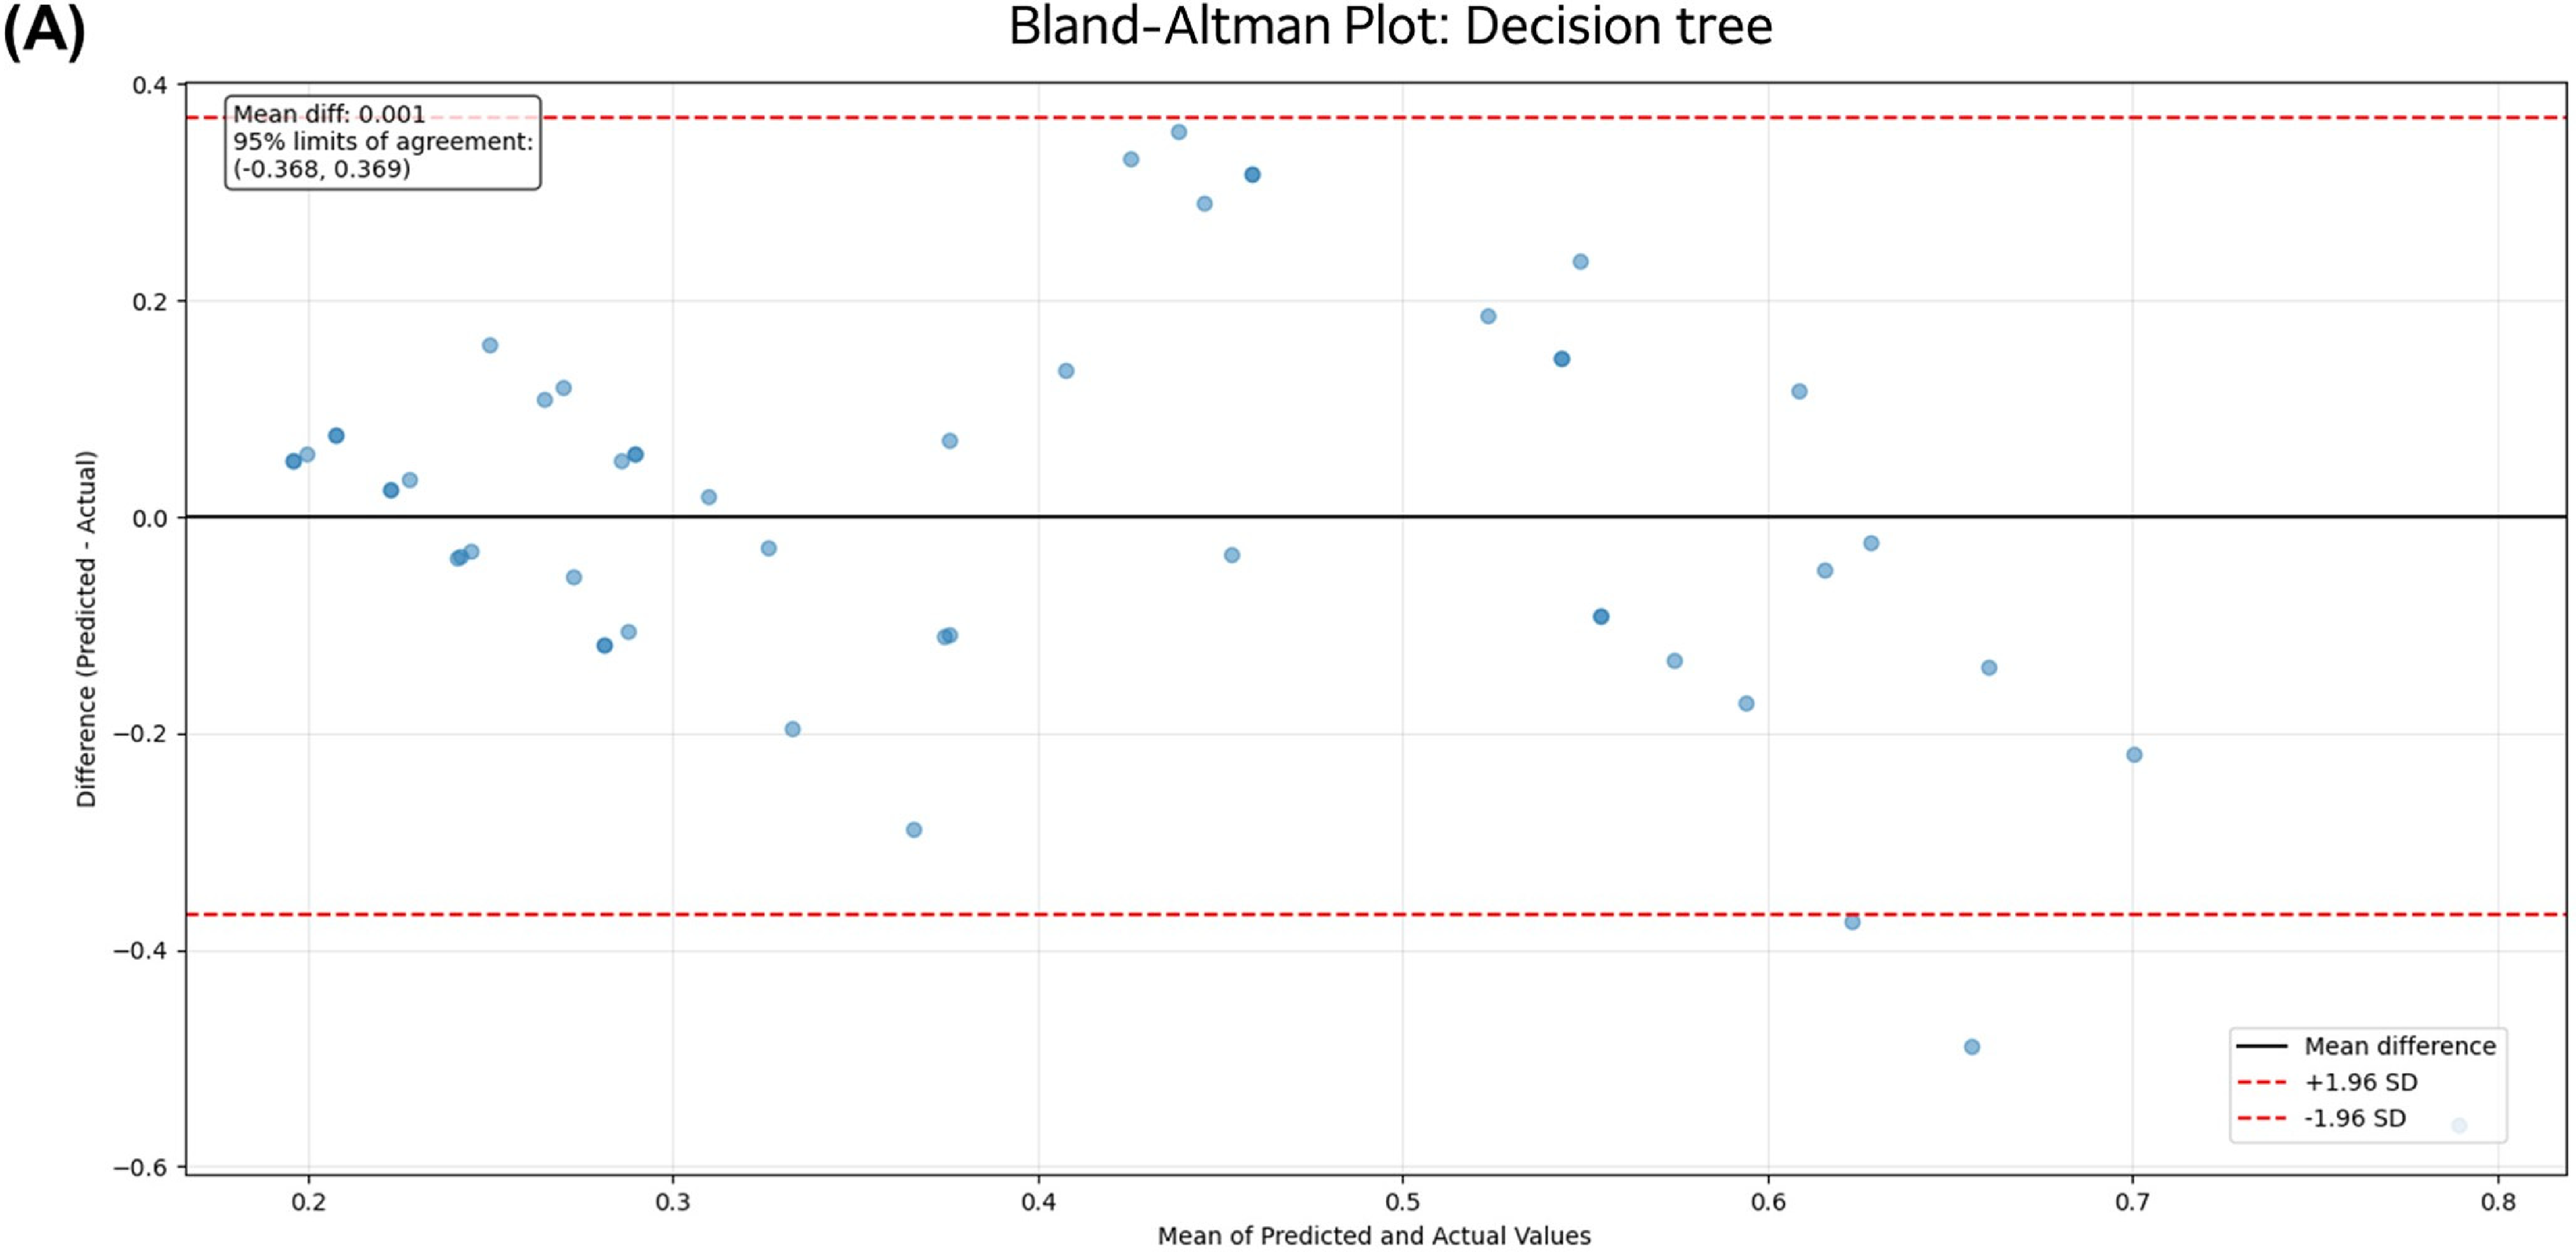
Bland–Altman plots for assessing agreement between predicted and actual bladder base displacement values for different machine learning models. Each plot shows the difference between predicted and actual values (y-axis) against their mean (x-axis). The solid black line represents the mean difference (bias), and the dashed red lines represent the 95% limits of agreement (mean ± 1.96 standard deviations). (A) Decision tree, (B) support vector machine, (C) random forest, (D) linear regression, (E) AdaBoost, (F) extreme gradient boosting.
For feature permutation importance, the most important predictors of bladder base displacement in the support vector machine model in the order of high impact based on RMSE were as follows (Figure 6): middle, back, and front vectors. The most important predictors of bladder base displacement in the random forest model in the order of high impact based on RMSE were as follows: middle vector, front ratio, and back vector. The most important predictors of bladder base displacement in the AdaBoost model in the order of high impact based on RMSE were as follows: middle vector, front ratio, and back vector.

(A) Feature permutation importance of support vector machine model in the training set for predicting bladder base displacement; (B) feature permutation importance of random forest model in the training set for predicting bladder base displacement; (C) feature permutation importance of Adaboost model in the training set for predicting bladder base displacement.
For Shapley Additive Explanation analysis, the most important predictors of bladder base displacement in the support vector machine model in the order of highly important predictors were as follows (Figure 7): high middle vector, high back vector, and low front ratio. The most important predictors of bladder base displacement in the AdaBoost model in the order of highly important predictors were as follows: high middle vector, low front ratio, high back vector.
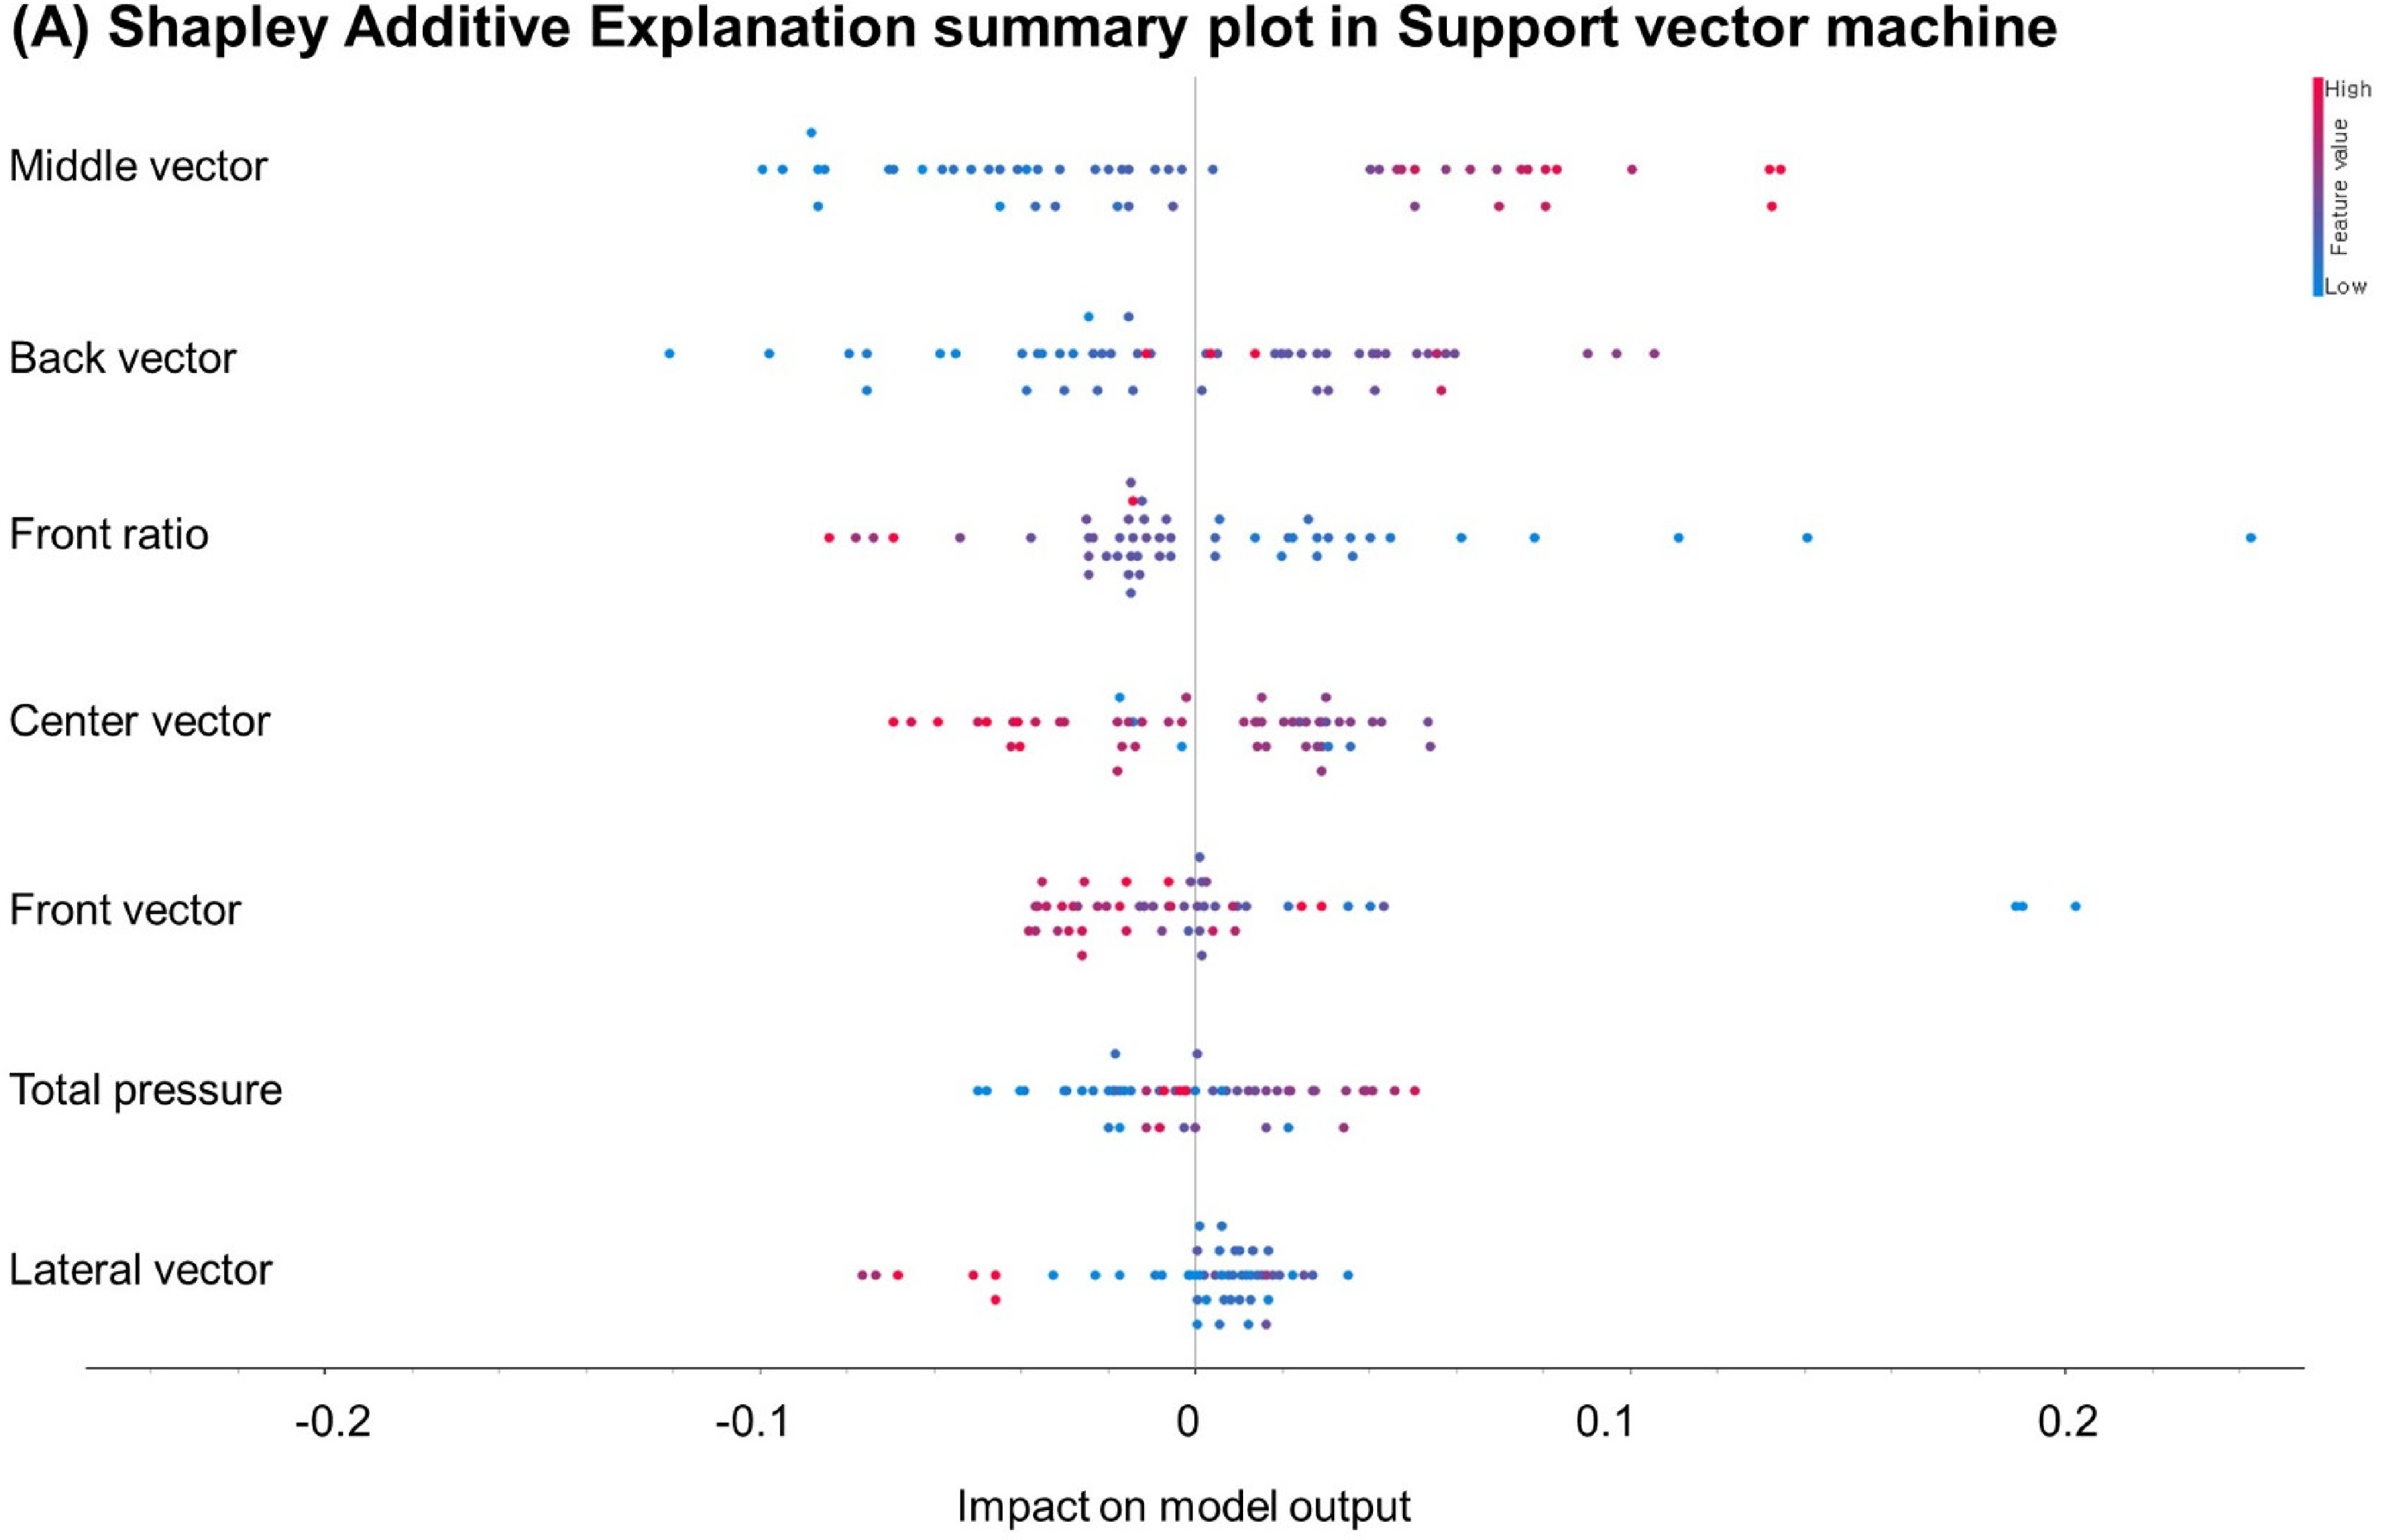
(A) Shapley additive explanation analyses of support vector machine model in the training set for predicting bladder base displacement; (B) Shapley additive explanation analyses of random forest model in the training set for predicting bladder base displacement; (C) Shapley additive explanation analyses of Adaboost model in the training set for predicting bladder base displacement.
Discussion
The present study introduces a novel approach for noninvasive measurement of PFM strength using ESPP measurement and machine learning algorithms. The significance of this study lies in its ability to evaluate PFM strength without the need for invasive vaginal probes, instead relying on ESPP measurements. This noninvasive method not only reduces patient discomfort but also has the potential to encourage more women to seek measurement and treatment for pelvic floor disorders. Previous studies have highlighted the importance of proper PFM contraction technique in the treatment and prevention of pelvic floor dysfunction. Bo et al. (2017) emphasized the role of verbal instructions and imagery in promoting effective PFM contractions, describing the action as a “lifting and squeezing” motion. 23 Our findings support this concept, demonstrating that the directionality of PFM contractions, as measured by ESPP vectors, is a significant factor in assessing PFM strength. The strong correlations between the middle and front vectors and bladder base displacement suggest that the inward and upward movement of the perineum during PFM contraction is a key indicator of muscle strength.
The intra-(ICC = 0.881) and inter-(ICC = 0.967) rater reliability for measurements of PFM maximum voluntary contraction using our novel ESPP measurement, indicating good to excellent reliability. In the previous studies, various PFM strength measurement methods have demonstrated a wide range of ICC values. Czyrnyj et al. (2020) reported within-day ICC values from 0.84 to 0.95 and between-day ICC values from 0.76 to 0.94 for PFM force measurements using the Elvie Trainer. 17 Cacciari et al. (2020) reported ICC values from 0.78 to 0.98 for intravaginal pressure measurements using the FemFit device. 24 Differences in experimental methods and devices make direct comparisons challenging, the high ICC values observed in our study indicate that the ESPP device can be considered a reliable tool for quantifying PFM function, similar to other methods reported in the literature. These findings support the potential application of the ESPP device as a reliable method for assessing PFM function in both research and clinical settings.
Previous studies have demonstrated the effectiveness of extracorporeal biofeedback devices for PFM training. Lee et al. (2013) reported a 52.1% objective cure rate and significant improvements in incontinence symptoms and quality of life after a 12-week PFM training program using an extracorporeal biofeedback device in women with stress urinary incontinence. 12 Oh et al. (2020) found that patients who received PFM training with a personalized extracorporeal biofeedback device after robot-assisted radical prostatectomy had significantly less urine loss at the 1-month follow-up compared to the control group receiving only verbal and written instructions. 25 Kang et al. (2020) demonstrated the immediate effectiveness of a mobile game-based instruction with an extracorporeal biofeedback device in improving PFM contraction, with results comparable to transabdominal ultrasonography biofeedback. 11 Similarly, Jung and Oh (2020) reported significant increases in the activity of the transverse abdominis/internal oblique (TrA/IO) and multifidus (MF) muscles immediately after and 10 min following indirect PFM activation using a pressure biofeedback unit. 13 Ko et al. (2022) found that pressure biofeedback training resulted in a greater elevation of the bladder base compared to verbal feedback training. 14 However, our study found that total pressure measured by the ESPP showed a weak and nonsignificant correlation with PFM contraction (r = .151, P = .236). This discrepancy can be attributed to incorrect PFM contraction techniques, particularly the Valsalva maneuver, which increases intra-abdominal pressure and can lead to a downward movement of the PFM, thereby increasing the overall pressure. Incorrect PFM contraction techniques, such as the Valsalva maneuver, can exacerbate pelvic floor disorders by increasing intra-abdominal pressure and causing a downward movement of the PFM.19,23,26,27 Therefore, it is crucial to quantify the correct direction of PFM contraction using vectors to ensure that patients perform the contraction in the appropriate upward and inward direction.
The three previous studies using vaginal probes attached pressure arrays on surface to assess PFM function provide valuable insights into the direction and symmetry of contractions. Cacciari et al. (2017a) found that women trained in the Pompoir technique exhibited a more homogeneous pressure distribution, with greater contributions from the latero-lateral planes compared to untrained women, suggesting improved symmetry of contractions. 28 Saleme et al. (2009) reported higher forces in the left anterior to right posterior orientation compared to the reverse orientation, indicating an asymmetry in contraction direction. 29 Similarly, Cacciari et al. (2017b) observed differences in pressure distribution between the anterior and posterior vaginal walls. 30 Our study found a strong and significant positive correlation between bladder base displacement measured by sonography and the middle vector derived from ESPP measurements (r = .619, P < .001), indicating that this vector provides valuable insights into the strength of PFM contraction. Additionally, a moderate and significant negative correlation was observed between bladder base displacement and the front vector (r = −.379, P = .002), suggesting that excessive pressure in the anterior perineal region may be associated with suboptimal PFM contraction patterns. The use of vectors to quantify the direction of PFM contraction allows for a more accurate measurement of muscle function and can help guide patients in performing the correct contraction technique.
Recent advances have made ultrasound devices more accessible for home use, with notable developments in automated assessment capabilities. Muta et al. (2024) demonstrated successful automated classification of PFM contractions from self-performed ultrasound videos, achieving high accuracy (accuracy = 0.73, AUC = 0.91) in their machine learning approach. 31 While such developments are promising for home-based monitoring, our ESPP measurement system offers several distinct advantages in clinical settings. First, our system's use of basic pressure sensor technology makes it considerably more cost-effective than ultrasound equipment, potentially increasing accessibility in resource-limited settings. Second, while ultrasound assessment requires specific expertise in probe positioning and image interpretation, even with automated analysis, our standardized pressure measurement system minimizes operator dependency through its simple positioning protocol. Third, our system's unique ability to measure directional force vectors provides detailed information about PFM contraction patterns that complements traditional ultrasound assessment. Finally, our method does not require specific bladder filling protocols, which are necessary for ultrasound assessment, making it more convenient for both clinicians and patients. These advantages suggest that our system could serve as a valuable complementary tool alongside emerging home-based ultrasound methods, providing clinicians with comprehensive data for more effective PFM strength measurement and training programs.
The integration of machine learning algorithms with ESPP measurements represents a novel approach to the interpretation of perineal pressure data. The high predictive accuracy of the support vector machine (RMSE = 0.139, R2 = 0.542), random forest (RMSE = 0.123, R2 = 0.367), and AdaBoost (RMSE = 0.123, R2 = 0.320) models in estimating bladder base displacement highlights the potential of these algorithms to enhance the clinical utility of ESPP measurements. By identifying complex patterns and relationships within the ESPP data, machine learning can provide a more comprehensive and objective measurement of PFM function compared to traditional methods.32–35
The Bland-Altman analysis provided additional insights into model performance beyond traditional metrics. While RMSE and R2 values suggested varying levels of performance between models, the Bland-Altman plots revealed remarkably consistent prediction patterns across all models. All models demonstrated minimal systematic bias, with mean differences very close to zero (ranging from −0.036 to 0.066), and showed clinically acceptable limits of agreement. This consistency in prediction patterns is particularly noteworthy given that it was achieved using a noninvasive measurement technique. The narrow limits of agreement (typically within ±0.3 to 0.4 units) suggest that all models maintain stable prediction accuracy across the range of measurements, indicating reliable clinical applicability. These findings highlight that while traditional performance metrics showed differences between models, all models achieved clinically acceptable levels of agreement between predicted and actual values, supporting the robustness of our machine learning approach.
Feature importance and Shapley Additive Explanation analyses revealed that the middle vector, front ratio, and back vector were consistently identified as the most influential predictors of bladder base displacement across the top-performing machine learning models. These findings suggest that the pressure distribution in the central and posterior perineal regions, as well as the proportion of pressure in the anterior region, are key determinants of PFM strength. This information can guide the development of targeted interventions and biofeedback protocols that focus on optimizing the activation patterns in these specific areas.
While the predictive performance of our models might appear modest in terms of traditional statistical metrics, their clinical utility should be evaluated in the context of current clinical practice and patient needs. Our machine learning models showed consistent performance with R2 values ranging from approximately 0.51 to 0.54 in the test set, which is noteworthy for several reasons. First, these results were achieved using completely noninvasive measurements, offering a significant advantage over current invasive methods in terms of patient comfort and accessibility. Second, the level of accuracy achieved is comparable to correlations reported between other noninvasive methods and traditional invasive measurements that reported correlations ranging from 0.45 to 0.66 between transabdominal ultrasound and perineometry. 3 Furthermore, Bland-Altman analysis revealed that all models demonstrated remarkably consistent prediction patterns with minimal systematic bias (mean differences ranging from −0.036 to 0.066) and clinically acceptable narrow limits of agreement (typically within ±0.3 to 0.4 units), suggesting their potential utility for initial screening and progress monitoring. The noninvasive nature of our method could significantly improve patient compliance with regular assessment, potentially leading to better monitoring of treatment progress and outcomes. While there is certainly room for improvement in model accuracy, the current performance level, combined with the method's noninvasive nature, suggests that this approach could serve as a valuable screening and monitoring tool in clinical practice.
Limitations
Several limitations of this study should be acknowledged. First, while our sample size (n = 21) was sufficient for demonstrating the reliability and validity of the ESPP measurement technique, it may not be fully representative of the broader population of women with pelvic floor disorders. Future studies should seek to validate these findings in larger and more diverse cohorts, including women of different ages, ethnicities, and pelvic health status. Second, a methodological limitation of our study lies in the model validation strategy. While we performed hyperparameter tuning using 5-fold cross-validation on the training set and evaluated performance on a separate test set, we did not implement a three-way split of the data into training, validation, and test sets due to our limited sample size (n = 63). The similar or slightly better performance observed in the test set compared to the training set, while verified to not be due to data leakage, suggests potential limitations in our validation strategy given our small sample size. This means that the hyperparameter optimization was performed without a dedicated validation set, which could potentially lead to some degree of optimization bias in our final model evaluations. Future studies with larger datasets should consider implementing a more robust validation strategy with separate training, validation, and test sets to ensure completely unbiased evaluation of model performance. Third, our study focused on healthy women, and the performance of the ESPP measurement system and machine learning models needs to be validated in women with various pelvic floor disorders. The predictive accuracy of our models might differ in populations with pathological conditions or varying degrees of pelvic floor dysfunction. Fourth, while we demonstrated good reliability of ESPP measurements, the moderate R2 values (ranging from 0.508 to 0.537) in our machine learning models suggest that there is room for improvement in predicting bladder base displacement. This might be addressed in future studies by incorporating additional relevant features or exploring more advanced machine learning architectures. Finally, our study was conducted in a controlled laboratory setting. The practical implementation of this technology in clinical settings may face additional challenges related to measurement standardization, patient positioning, and environmental factors that could affect the pressure measurements.
Conclusion
The present study demonstrates the potential of ESPP measurement and machine learning algorithms as a noninvasive, reliable, and valid approach to assessing PFM strength. The high-reliability coefficients (ICC > 0.88) indicate excellent measurement consistency. The machine learning models demonstrated robust performance, with the support vector machine and AdaBoost models achieving R2 values of 0.54 and 0.54 in the training and test sets, respectively. Notably, Bland–Altman analysis revealed remarkably consistent prediction patterns across all models, with minimal systematic bias (mean differences ranging from −0.036 to 0.066) and clinically acceptable limits of agreement. This consistent performance, particularly in the context of a noninvasive measurement technique, suggests that our approach could serve as a reliable alternative to traditional invasive methods. While the overall predictive accuracy was moderate, the combination of reliable noninvasive measurements and consistent prediction patterns with minimal bias suggests this approach could serve as a valuable clinical tool. The noninvasive nature of this approach has the potential to improve patient comfort and adherence to PFM strength measurement and treatment, ultimately leading to better outcomes for women with pelvic floor disorders. Further research is needed to refine the ESPP measurement protocol, optimize the machine learning models, and explore the clinical applications of this innovative measurement method in diverse populations.
Footnotes
Acknowledgments
We would like to thank all participants in our study for their active participation and cooperation.
Contributorship
UJH contributed to conceptualization, methodology, and writing—original draft and visualization. MJJ and UJH contributed to supervision and project administration. SHA, HJL, and URJ contributed to data curation, validation, and software. SHA and HJL contributed to data curation and formal analysis.
Declaration of conflicting interests
The authors declared no potential conflicts of interest with respect to the research, authorship, and/or publication of this article.
Ethical approval
The present study conformed to the ethical guidelines of the 1975 Declarations of Helsinki. The study protocol was approved by the Yonsei University Mirae Campus Institutional Review Board (approval no. 1041849-202204-BM-070-03). Before participating in the study, we explained all experimental procedures to the subjects, and they provided written informed consent.
Funding
This research was supported by the Basic Science Research Program through the National Research Foundation of Korea (NRF) funded by the Ministry of Education (2021R1I1A1A01048463).
Guarantor
UJH.