
Abstract
Objective
The COVID-19 outbreak has significantly impacted human lifestyles and life patterns. Therefore, data related to human social life may tell us the increase or decrease in the number of confirmed COVID-19 cases. However, although the number of confirmed cases is affected by social life, it is difficult to find studies that attempt to predict the number of confirmed cases using various lifestyle data. This paper attempted an exploratory data analysis to see if the number of confirmed cases could be predicted more accurately by including various lifestyle data.
Methods
We included taking public transportation, watching a movie at the cinema, and accommodation at a motel in the lifestyle data. Finally, a ‘lifestyle addition’ set was constructed that added lifestyle data to the number of past confirmed cases and search term frequency data. The deep learning algorithms used in the analysis are deep neural networks (DNNs) and recurrent neural networks (RNNs). Performance differences across data sets and between deep learning models were tested to be statistically significant.
Results
Among metropolitan cities in South Korea, Seoul (9.6 million) with the largest population and Busan (3.4 million) with the second largest population had the lowest error rate in ‘lifestyle addition’ set. When predicting with the ‘lifestyle addition’ set, in Seoul, the error rate was reduced to 20.1%, and in Busan, the graph of the actual number of confirmed cases and the predicted graph were almost identical.
Conclusions
Through this study, we were able to identify three notable results that could contribute to predicting the number of patients infected with epidemic in the future.
Keywords
Introduction: pre- and post-COVID-19 pandemic
During the COVID-19 pandemic, the frequency with which social communication occurs online has increased significantly. The Government of South Korea also prohibited gatherings of more than five people, restricted dining time at restaurants to 9 PM and asked for restraint in various leisure activities. Moreover, people refrained from using public transportation. The reason for the decrease in face-to-face interaction is that COVID-19 infection spreads due to a virus that enters the respiratory tract through contact. 1 However, after easing such social distancing policies in November 2021, there was a significant increase in the number of confirmed cases in South Korea. The government returned to the previous strong control policy again after about a month, and in early 2022 the contagion had been managed within the scope of the medical system. It was a clear real-life example that a lot of face-to-face contact affects the increase in confirmed cases.
The average COVID-19 incubation period is 5–6 days. 2 For example, if someone is infected by COVID-19, symptoms will appear after 5–6 days. More importantly, even if someone is infected by COVID-19, because there may be no symptoms for at least 4 days, the infected person can partake in social life, including going to work. However, COVID-19 is contagious during the incubation period as well. 3 If the number of confirmed COVID-19 cases can be expected to increase sharply after 5 days, the government will be able to caution the public or preemptively implement a stricter ban on contact.
Researches that predict the number of confirmed cases using artificial intelligence have been published continuously for the past four years since the pandemic started. Many studies using artificial intelligence for time series forecasting predicted the number of confirmed cases in the future using one feature, the number of confirmed cases in the past, as in traditional time series analysis..4–10 There are also a number of papers that have attempted to predict the number of confirmed cases using various lifestyles, 11 different health states,12–14 confirmed cases and government policies, 15 population movement by vehicles,16–18 temperature and humidity measurements, 19 or search indexes (keywords).16,20,21 However, it is not easy to find papers that predict the number of confirmed cases by integrating search term frequency, various lifestyles, and the near past number of confirmed cases. 22
In preparation for the occurrence of new infectious diseases such as COVID-19 variants in the future, we wanted to develop a model that proactively predicts the number of confirmed cases. As mentioned earlier, the COVID-19 outbreak has had a significant impact on all human lifestyles and life patterns. It is highly expected that it significantly affected not only medical data but also ordinary human social life-related data.
Therefore, we built a model to predict the number of confirmed COVID-19 cases using lifestyle data rather than clinical data, which records symptoms that appear only when contracting COVID-19. If a pandemic like COVID-19 occurs again, people will change their lifestyles, such as avoiding face to face contact again. So, the model used in this study can be fully applied to future pandemics.
The objective of the study is to determine whether the inclusion of lifestyle data can improve predictions of the number of confirmed COVID-19 cases. We also checked how such data affects the prediction of the number of confirmed cases with respect to the number of populations in different cities.
Predictions through such a model will be able to significantly reduce the number of confirmed cases, as well as the period during which the number of confirmed cases increases. 23 It is necessary to accurately and quickly predict the number of confirmed cases to prepare hospital beds and medical staff in advance and distribute vaccines appropriately in each region.24–26
Methods
A more accurate forecast would be possible if we possessed more time series data4,27,28 but we wanted to build a forecasting model that could accurately function even with approximately one year of time series data. Therefore, in this paper, we conducted a study using the COVID-19 outbreak cases that occurred in 2020 and lasted for more than a year as input data rather than the currently occurring infectious disease. The data used in this study are time-series data for three cities, including the capital, Seoul, from January 30, 2020, to February 28, 2021. We conducted a time-series analysis because we have time-series data.
During the data check process before starting the full-scale analysis, we found that the probability structure of the training data (2020.01.30–2021.01.20) and test data (2021.01.21–2021.02.28) would be clearly different (see Figure 1). Moreover, the observation period was too short to determine a certain trend or seasonality, hence, the application of time-series analysis could be limited.
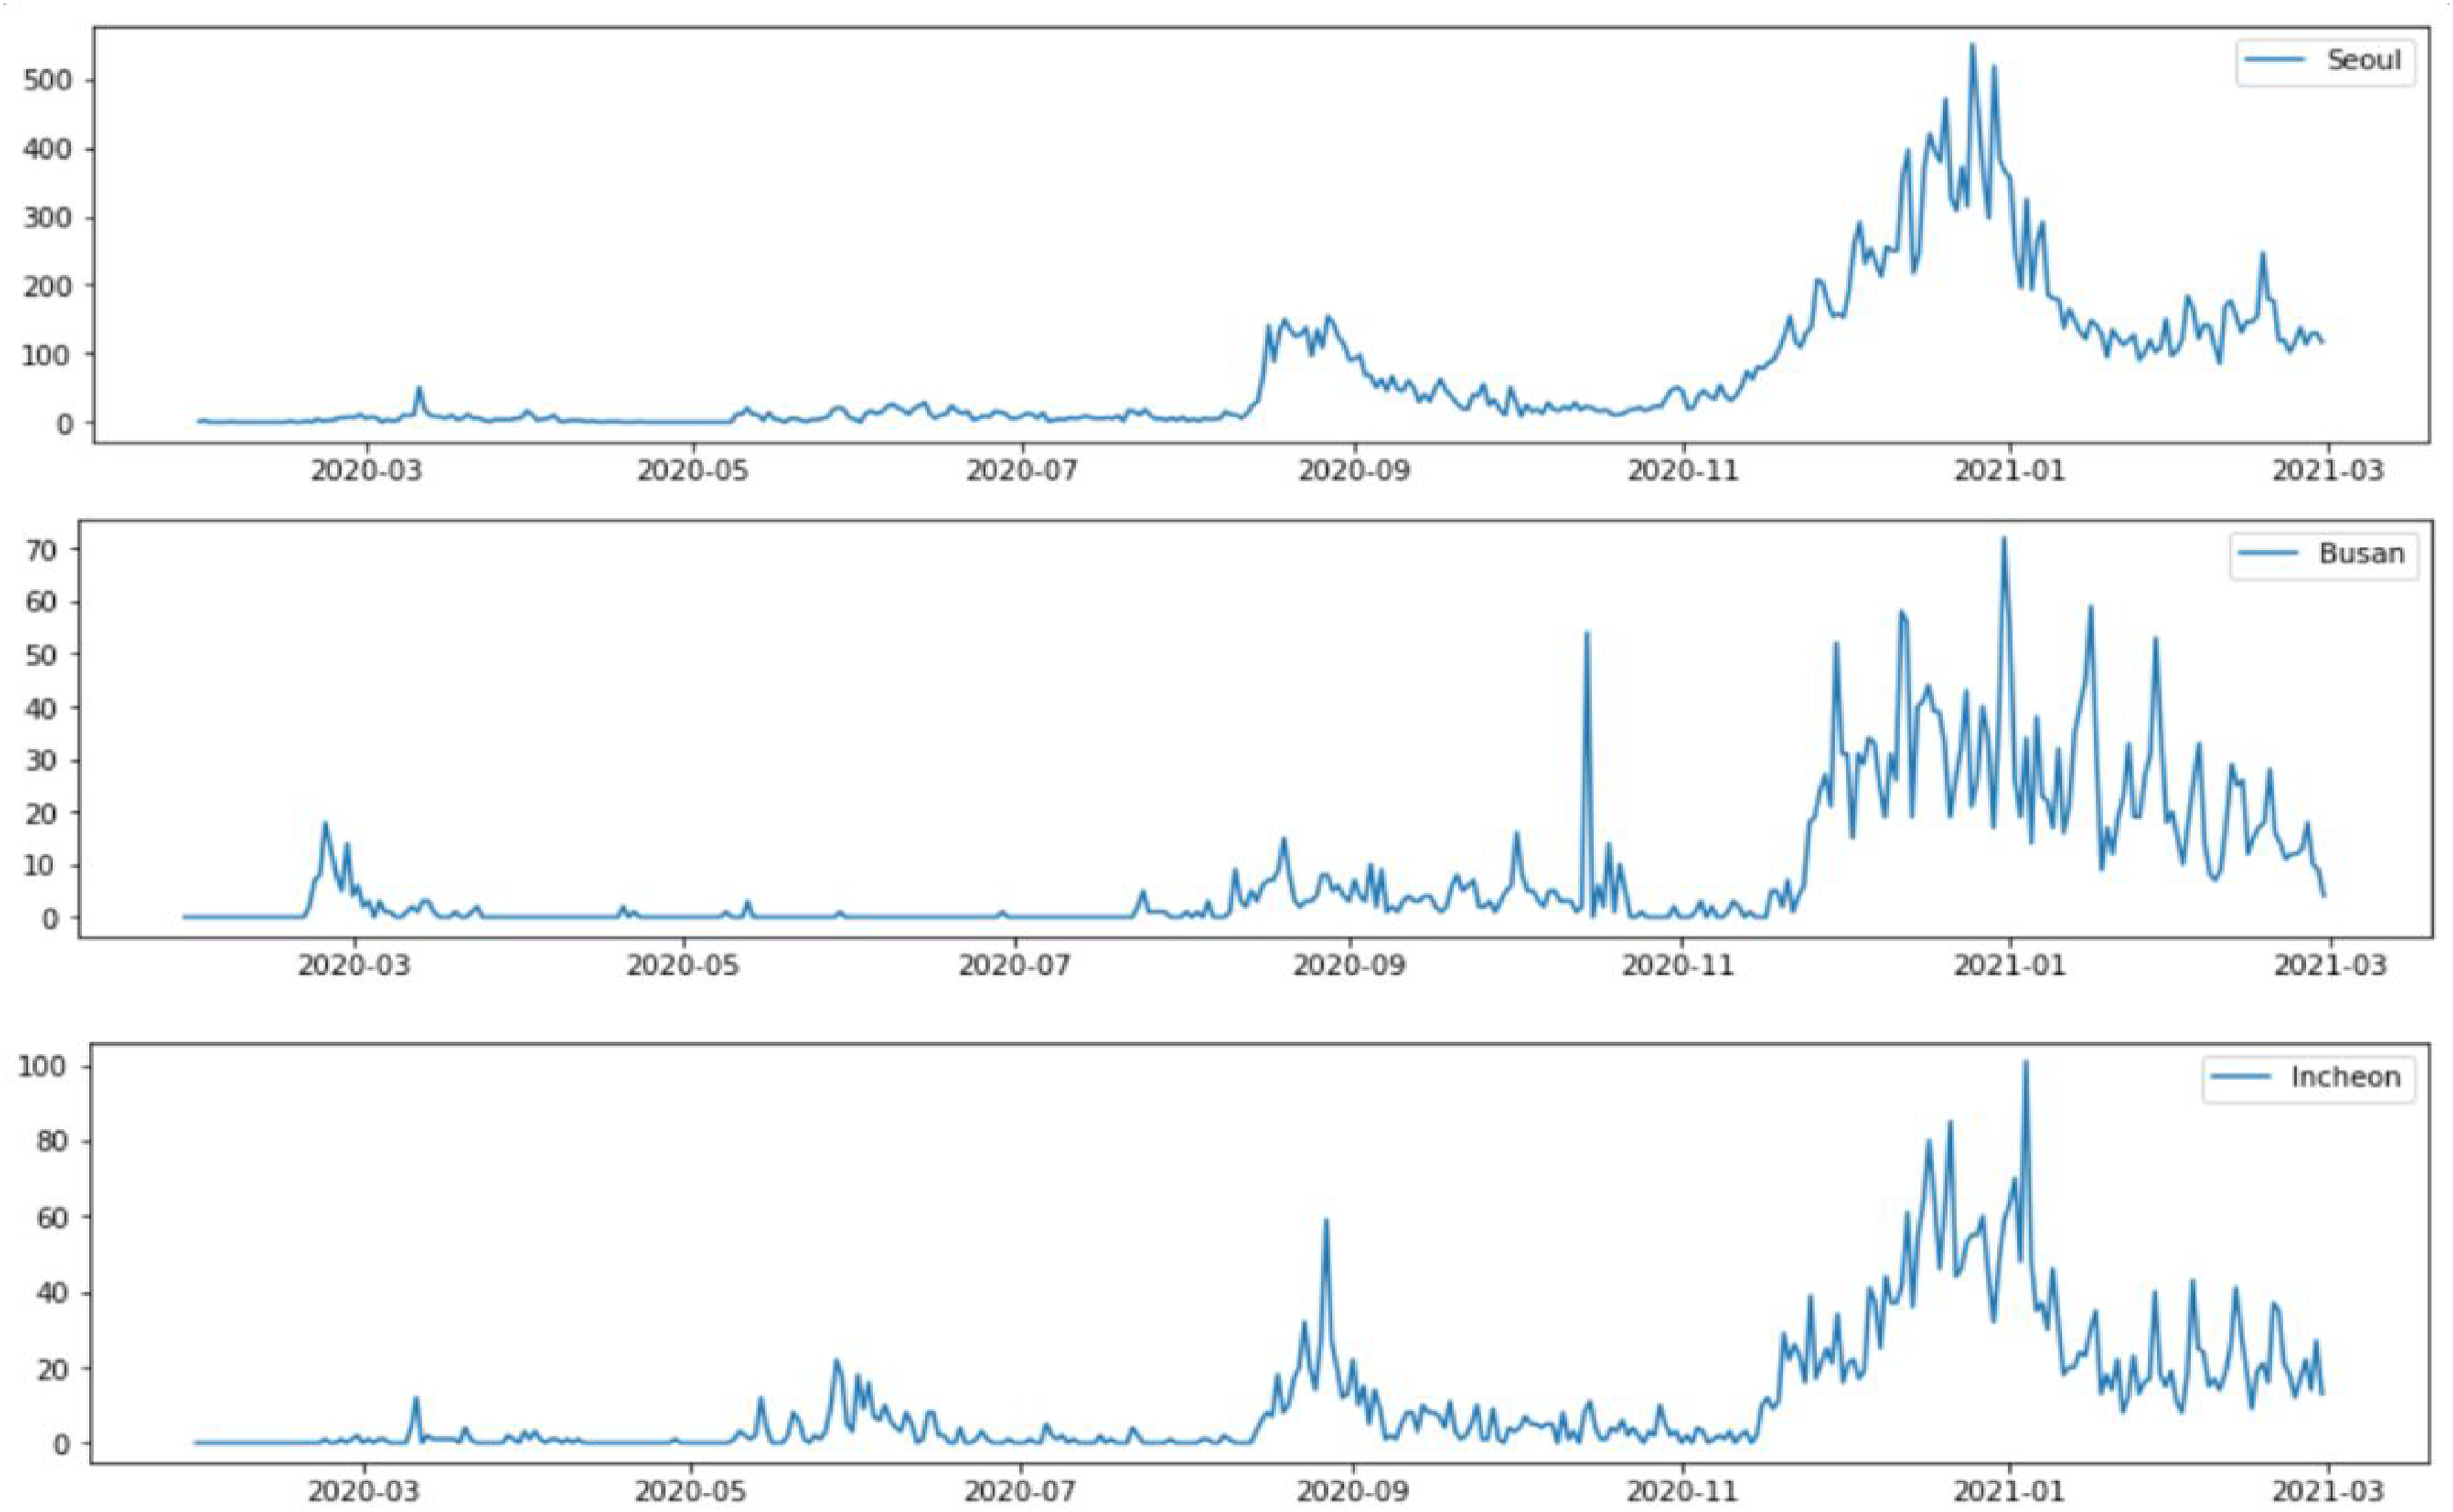
Actual number of confirmed cases in 3 cities from January 30, 2020, to February 28, 2021.
Machine learning methods were not originally developed specifically for time series data, but they also demonstrate useful performance in time series. There are several machine learning models that are often used for time series prediction. First, DNN(deep neural network) is a core technology of deep learning and shows excellent performance in various fields. Next, there is RNN(recurrent neural network), a model specialized for time series prediction. RNNs have been used in various tasks related to sequences, such as time series analysis and forecasting, speech recognition or natural language processing, 29 and they have been demonstrated to achieve state-of-the-art performance. Random forest (RF) is also useful in time series prediction by compressing and transforming the time series characteristics of raw data. Random Forest is one of the most popular supervised learning models due to its high flexibility and ease of implementation.30,31 Ensemble learning is also widely used in time series forecasting. Ensemble learning is the process in which two or more ML models are combined to create a more accurate and robust predictive model. 32 The Network Inference-based Prediction Algorithm (NIPA), which combines various approaches from basic curve fitting methods and traffic interaction models to machine learning, is also useful in time series prediction. Network-based approaches are known to perform well in predicting confirmed COVID-19 cases, especially by considering the interactions between different regions. 33
In this study, the number of confirmed cases was predicted using the DNN model, which has become a core technology in deep learning, and the RNN model, which specializes in time series data. These two prediction models were trained to forecast the number of confirmed COVID-19 cases for the month of February 2021.
Data collection
Many studies have demonstrated that search activity can be used to manage and predict infectious disease outbreaks.34–36 In particular, Google Flu Trends (GFT) has drawn much attention as a system that can detect the activity of diseases, such as influenza, because the data generated by GFT reflect the behavior of humans. Consequently, in areas where such search keywords are trending, having a new onset of flu can be considered; real cases are proving this phenomenon. 37 However, it is also true that there was a significant difference between the prediction of flu by GFT and actual number of patients measured by the Center for Disease Control and Prevention.38,39 Early GFT predictions suffered from several major methodological problems; in particular, the most important aspects, such as selection and exclusion of search keywords, were not based on empirical evidence. 40 Moreover, the average trend of 45 search terms most related to flu was predicted through only one explanatory variable, and words, which simply represent a general interest in infectious diseases, were included in these 45 terms (with the exact terms unknown). These were pointed out as the reasons for the significant decrease in prediction accuracy. 40
However, prediction through search terms is still considered necessary as the initial information. The head of the CDC Influenza Surveillance and Outbreak Response Team stated that GFTs are monitored “all the time” because any data is more helpful than no data. 39
Therefore, in this study, the daily increase and decrease in the frequency of search term were collected through Google Trends using only one search term ‘COVID-19 symptoms,’ which is a must-search word if people are worried that they are infected with COVID-19 after becoming in contact with COVID-19 patients. As symptoms of COVID-19 are widely known through SNS and news over time, even if COVID-19 infection is suspected, people may no longer search for ‘COVID-19 symptoms’ using Google. Thus, although frequency of searches for ‘COVID-19 symptoms’ may increase temporarily, the overall trend will remain downward. Therefore, only information about search term frequency is insufficient, and we examined related studies and real cases of infection to clarify what kind of data should be added to predict the number of confirmed COVID-19 cases.
Broadcasting and newspapers reported that people should avoid going to work if they can work from home, avoid weekend trips, and find hobbies they can do at home 41 ; the key to dealing with COVID-19 is to break the chain of contact. 42
Hence, it is expected that people who are frequently in face-to-face contact, take public transportation, enjoy cultural life, and stay in accommodation are more likely to be infected by COVID-19 than those who do not. In fact, COVID-19 infection cases stemming from public transportation, cultural life, and accommodation occurred almost every day during the pandemic. Existing studies have shown that the spatial distribution of COVID-19 cases in China is explained well by travel data, and travel restrictions substantially mitigate the spread of COVID-19.43,44
Fortunately, in South Korea, it is possible to obtain data that indirectly express how often people have been in crowded places and how many contacts they have had with people. 36 Although it is limited to certain credit card (BC card) users and not cash users, the amount paid by people who frequently took public transportation, watched a movie at the cinema, or stayed at a motel using cards, is summarized and disclosed daily by the Korea Tourism Data Lab (https://datalab.visitkorea.or.kr/). Since only the total amount of card usage by category is disclosed, individuals cannot be identified. Anyone can register as a member of the site and retrieve the necessary data. So there is no need to get permission.
If payments increased in three categories (taking public transportation, watching a movie at the cinema, and accommodation at a motel) over a given period, there would have been a lot of people involved in these activities. It is predictable that face-to-face contact has increased. Thus, it can be assumed that the number of confirmed COVID-19 cases will increase if the amount of credit card usage in these three categories increases.
Recently, many clinical-related data have been released worldwide to prevent the spread of COVID-19.26,32,45 However, clinical data has the potential to violate privacy. Therefore, it is important to analyze whether predictive power can be increased using publicly available data.
Advances in computer technology and ICT have enabled artificial intelligence to analyze and process unprecedented amounts of big data. 45 Blue Dot, a startup company operating in Toronto, is known to have detected the disease, using AI-based surveillance systems, for the first time in hours after a patient broke out in Wuhan, the initial COVID-19 epicenter. 46 In this study, we conducted an exploratory data analysis to see if the number of confirmed COVID-19 cases could be predicted more accurately by combining search term frequency data and lifestyle data, such as taking public transportation, watching a movie at the cinema, and accommodation in a motel, with the number of confirmed cases.
Therefore, three input data sets were formulated, such as ‘coronics i alone’ set including only the number of confirmed cases, ‘search term addition’ set adding ‘search term frequency’ data based on coronics, and ‘lifestyle addition’ set adding lifestyle data based on ‘coronics’ and ‘search term frequency.’ Furthermore, the day-of-week related variables were included as dummy variables ii for all input datasets to increase the periodicity.
We determined which of these data sets was best at predicting the number of confirmed cases and, as explained later, compared the prediction performance between deep learning models.
Deep neural network
Because COVID-19 is an infectious disease, the latest infection trends are likely to help predict the number of confirmed cases in the near future. To predict the number of confirmed cases on February 1, 2021, data for the past week from January 27 (five days before February 1) was used (see Figure 2). Predicting the number of confirmed cases after 5 days took into account the incubation period, as discussed in the introduction. Consequently, the data from January 21 to February 28, 2021, was the test set (using 90% of the data for training and 10% for test). The deep learning model was trained using data from January 30, 2020, to January 20, 2021(training set).

Prediction of the number of confirmed cases 5days after January 27 and time step.
Using these data, a deep neural network (DNN) model based on Keras, a deep learning framework, was built. In this study, the DNN model used a sequential method to stack a total of six dense layers: five hidden layers and one output layer generating one predicted value. Except for the first hidden layer, the ReLU function was used as the activation function in all other hidden layers, which is the most popular activation function in deep learning and can fully benefit from deepening the hidden layers. 47
Once a model has been built, the next step is to set up a specific process for training by using a compile function. In the compile function, three major aspects, namely, loss function, optimizer, and evaluation metric, should be specified. 47 In this study, the mean squared error (MSE) is used as the loss function. As shown in Figure 3, through the learning process, the deep learning model continuously compares the predicted values with the actual values and finds a combination of weights (w) and biases (b) that minimize the difference. 48 Therefore, the smaller the loss function is, the better the performance of the model is. In this study, Adam was used as an optimizer. The metric is an indicator set to monitor whether the training process is successful. In this study, training process was monitored using the MAE (Mean Absolute Error). Then, early stopping, a method to prevent overfitting of the data, was used on the output. In this study, training was set to repeat a total of 400 times(epochs). However, if the predicted value did not improve during training an additional 40 times (early stopping), training was stopped even before 400 times.
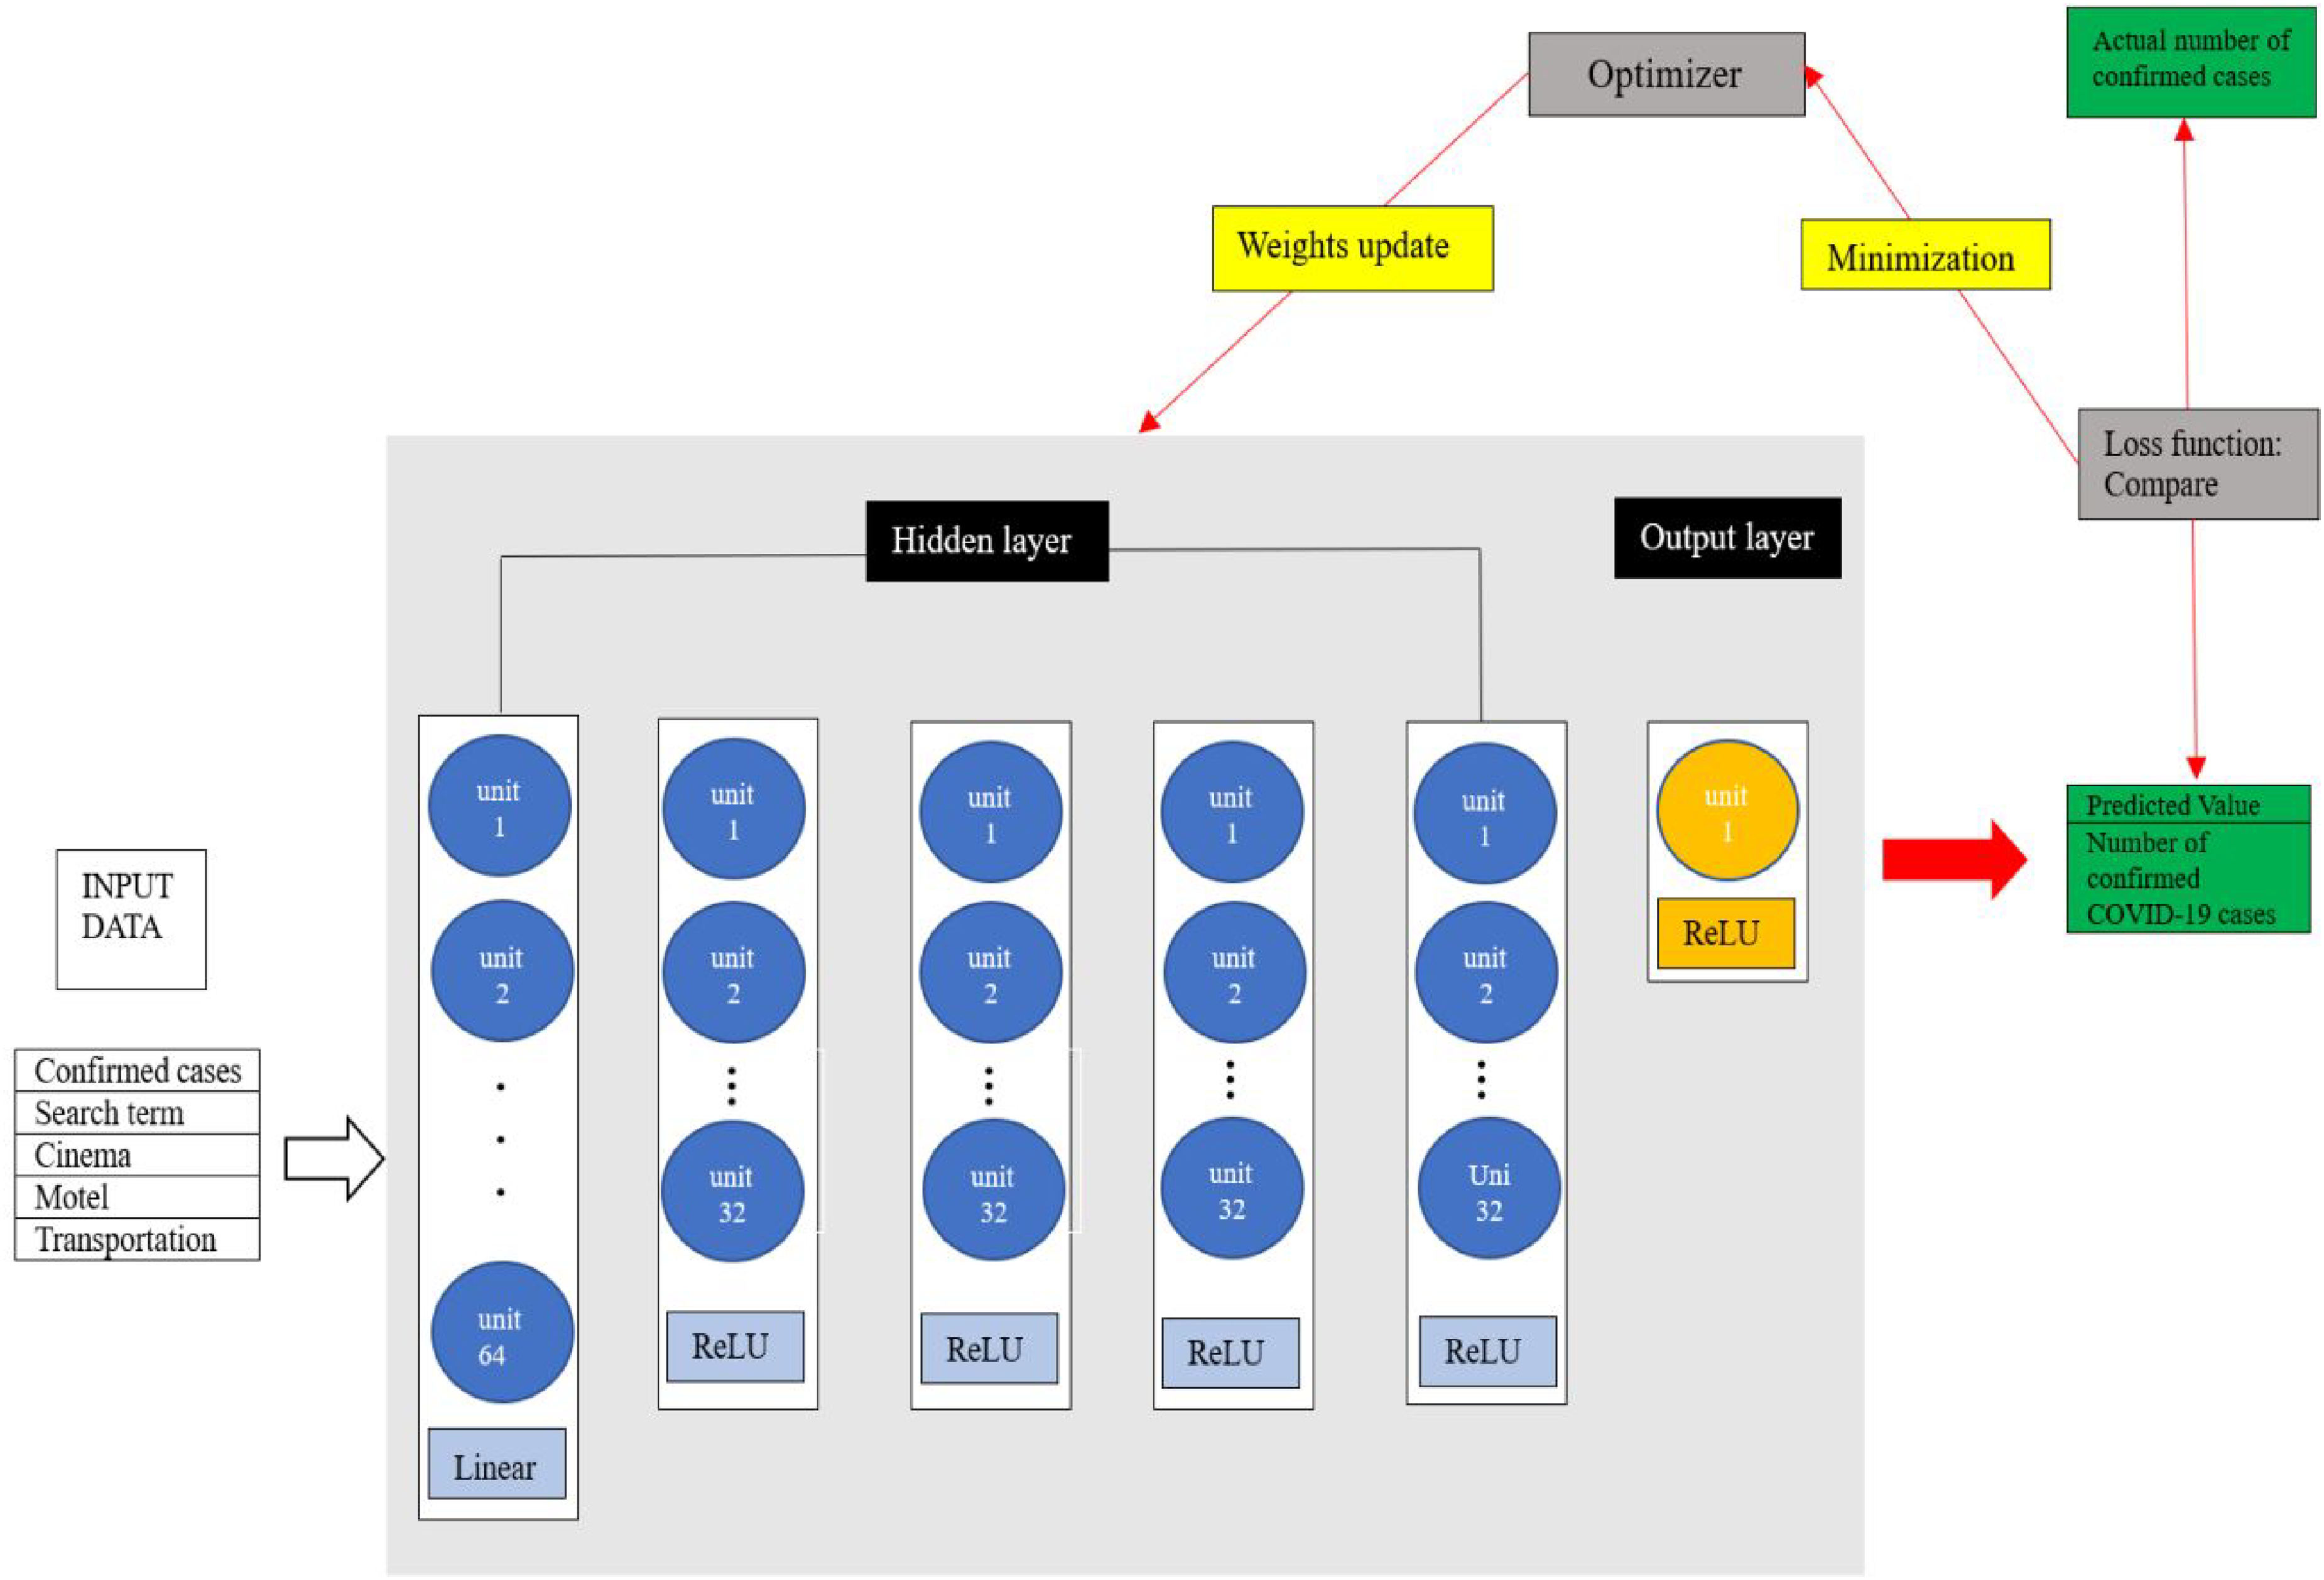
The learning process of the DNN model used in this study.
Finally, to evaluate the accuracy of such predictions, the mean absolute percent error (MAPE) was used in this study as a key metric. RMSE and MAE were used as auxiliary metrics to compare prediction errors. 49
The mean absolute percentage error is as defined in Equation (1).

Recurrent neural network
An RNN, which can produce good results when used for handling sequential data, is an algorithm that applies a DNN and is characterized by an inner recurrent structure.47,51 In DNNs, the result values of each layer are directed only toward the output layer (feed-forward neural networks). 52 Contrarily, in RNNs, the result values are directed toward the output layer, while they are used in the next calculation of the current layer using the recurrent structure. 53 This is because RNNs have a hidden state ‘hs’ (a vector of real numbers) that can memorize all information in the past. 54 RNN models generate an output by considering the previous hidden state and the current input, and ‘hs’ is updated every time new data are processed in this way (see Figure 4).

The structure of RNN.
In this study, the RNN model is constructed to have five hidden layers between the input and output layers by separately creating an input layer that specifies the input data. In the first hidden layer, a neural network with a recurrent structure was placed inside, and the remaining hidden layers consisted of dense layers. In the dense layers, the ReLU function was used as the activation function as in the DNN model. That is, the RNN model was formed with one recurrent layer and five feed-forward layers. As shown in Figure 5, at each time step of the input sequence, the recurrent layer updates its hidden state to hs1 by considering the previous hidden state, hs0, and current input data, [xa, xb, xc, xd, xe]1. hs1 is then sent to the next layers to predict the number of confirmed cases for that time step. When the next sequence of data ([xa, xb, xc, xd, xe]2) enters the recurrent layer, the updated hs1 is combined with [xa, xb, xc, xd, xe]2, generating the next hidden state hs2.
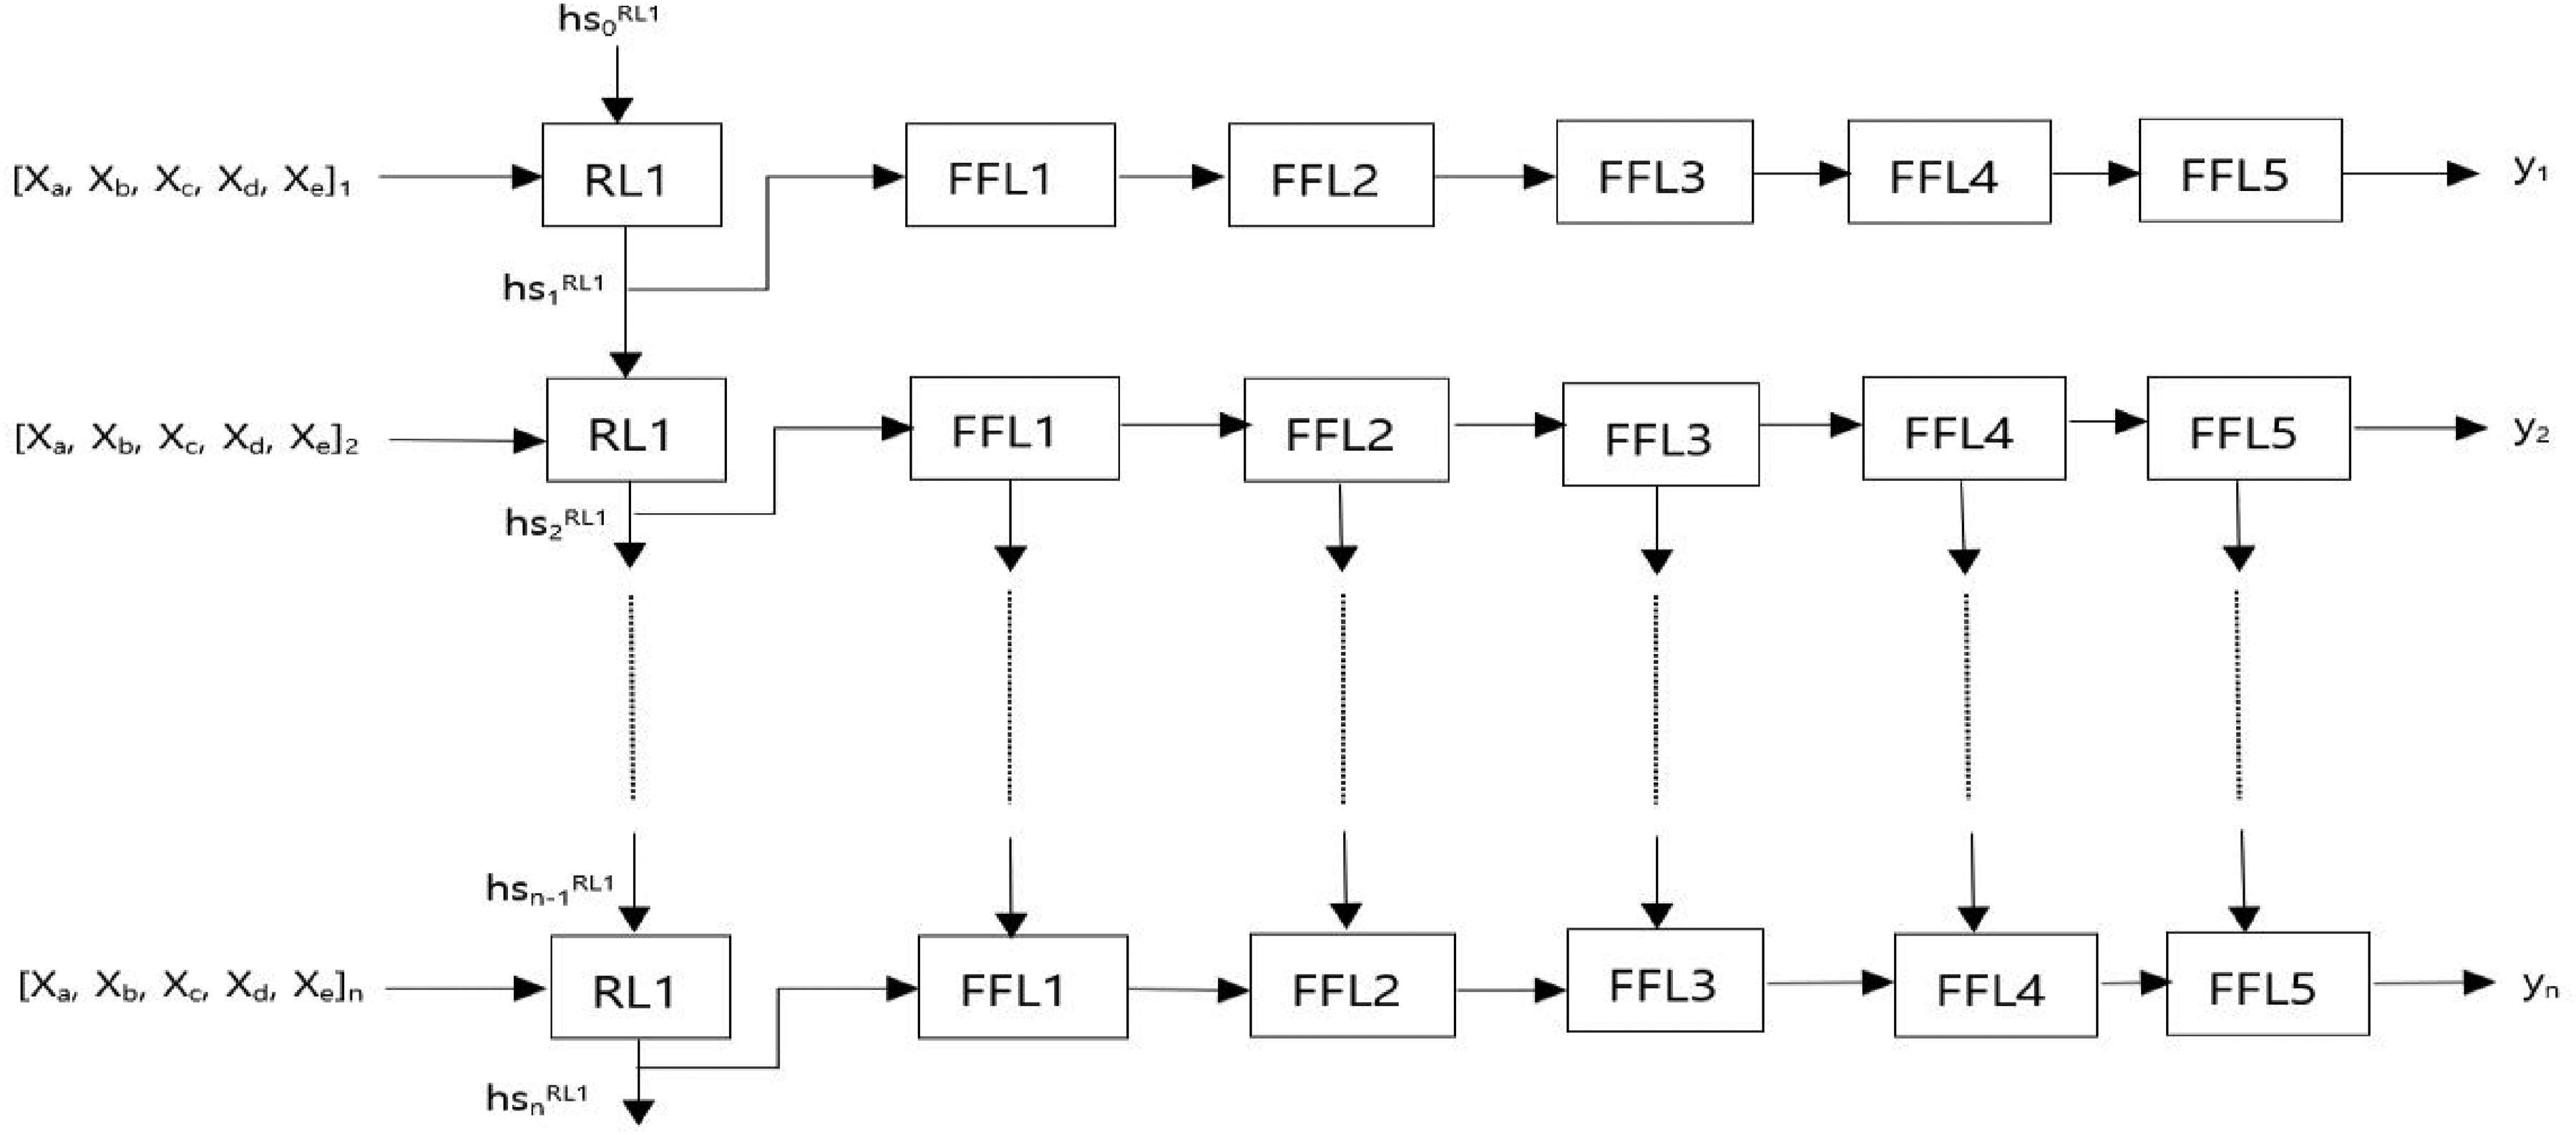
The RNN model architecture used in this study. Five features ([xa, xb, xc, xd, xe] n ) come in. Then, they pass through one recurrent layer and five feed forward layers. Subsequently, the number of confirmed cases (yn) is generated as an output value.
Although RNN is theoretically a powerful model for processing sequential data, the vanishing gradient problem is often encountered when learning long-term time-series data.47,55 Therefore, to solve this problem, LSTM or GRU networks, in which some modifications are added to the RNN, are used. 56 Because there had not been shown any significant difference between the performance of LSTMs and GRUs in the literature,56,57 the LSTM network was used as the recurrent layer in this study.
Next, to call a compile function, we use the MSE as the loss function, Adam as the optimizer, and MAE as the metric. Hyperparameters such as epochs and early stopping were set to be the same as those of the DNN model. The error rate for predicting the number of confirmed cases was calculated using MAPE in the same way as the DNN model.
Results
Prediction of the number of confirmed cases
It is the core concern of this paper to analyze which of predicting the number of confirmed cases ①based on the number of confirmed cases alone, like most existing papers, ②by combining search term frequency data with the number of confirmed cases or ③using all data (five features) has the lowest error rate.
Among metropolitan cities in South Korea, Seoul (9.6 million) with the largest population and Busan (3.4 million) with the second largest population had the lowest error rate in ‘lifestyle addition’ set (see the bold text in Table 1). In these two cities, the error rate was the lowest in the ‘lifestyle addition’ set regardless of the model applied (see the Figure 6). However, in Incheon, the third largest city, the error rate was the lowest in ‘lifestyle addition’ set, except when the DNN model was applied. In the DNN model, a lot of data is processed at once rather than one by one in order. Therefore, there are bound to be limitations in applying the DNN model to time series data. In Incheon, lifestyle data may have acted as noise or overlap in relation to search term frequency data or coronics, unlike in the other two cities, but the DNN model can be considered to have failed to remove such noise or overlap, and thus the error rate has increased to 76.8%. However, in the LSTM model, because such noise was removed, the error rate in the ‘lifestyle addition’ set can be considered reduced to 33.6% (see Figure 6).
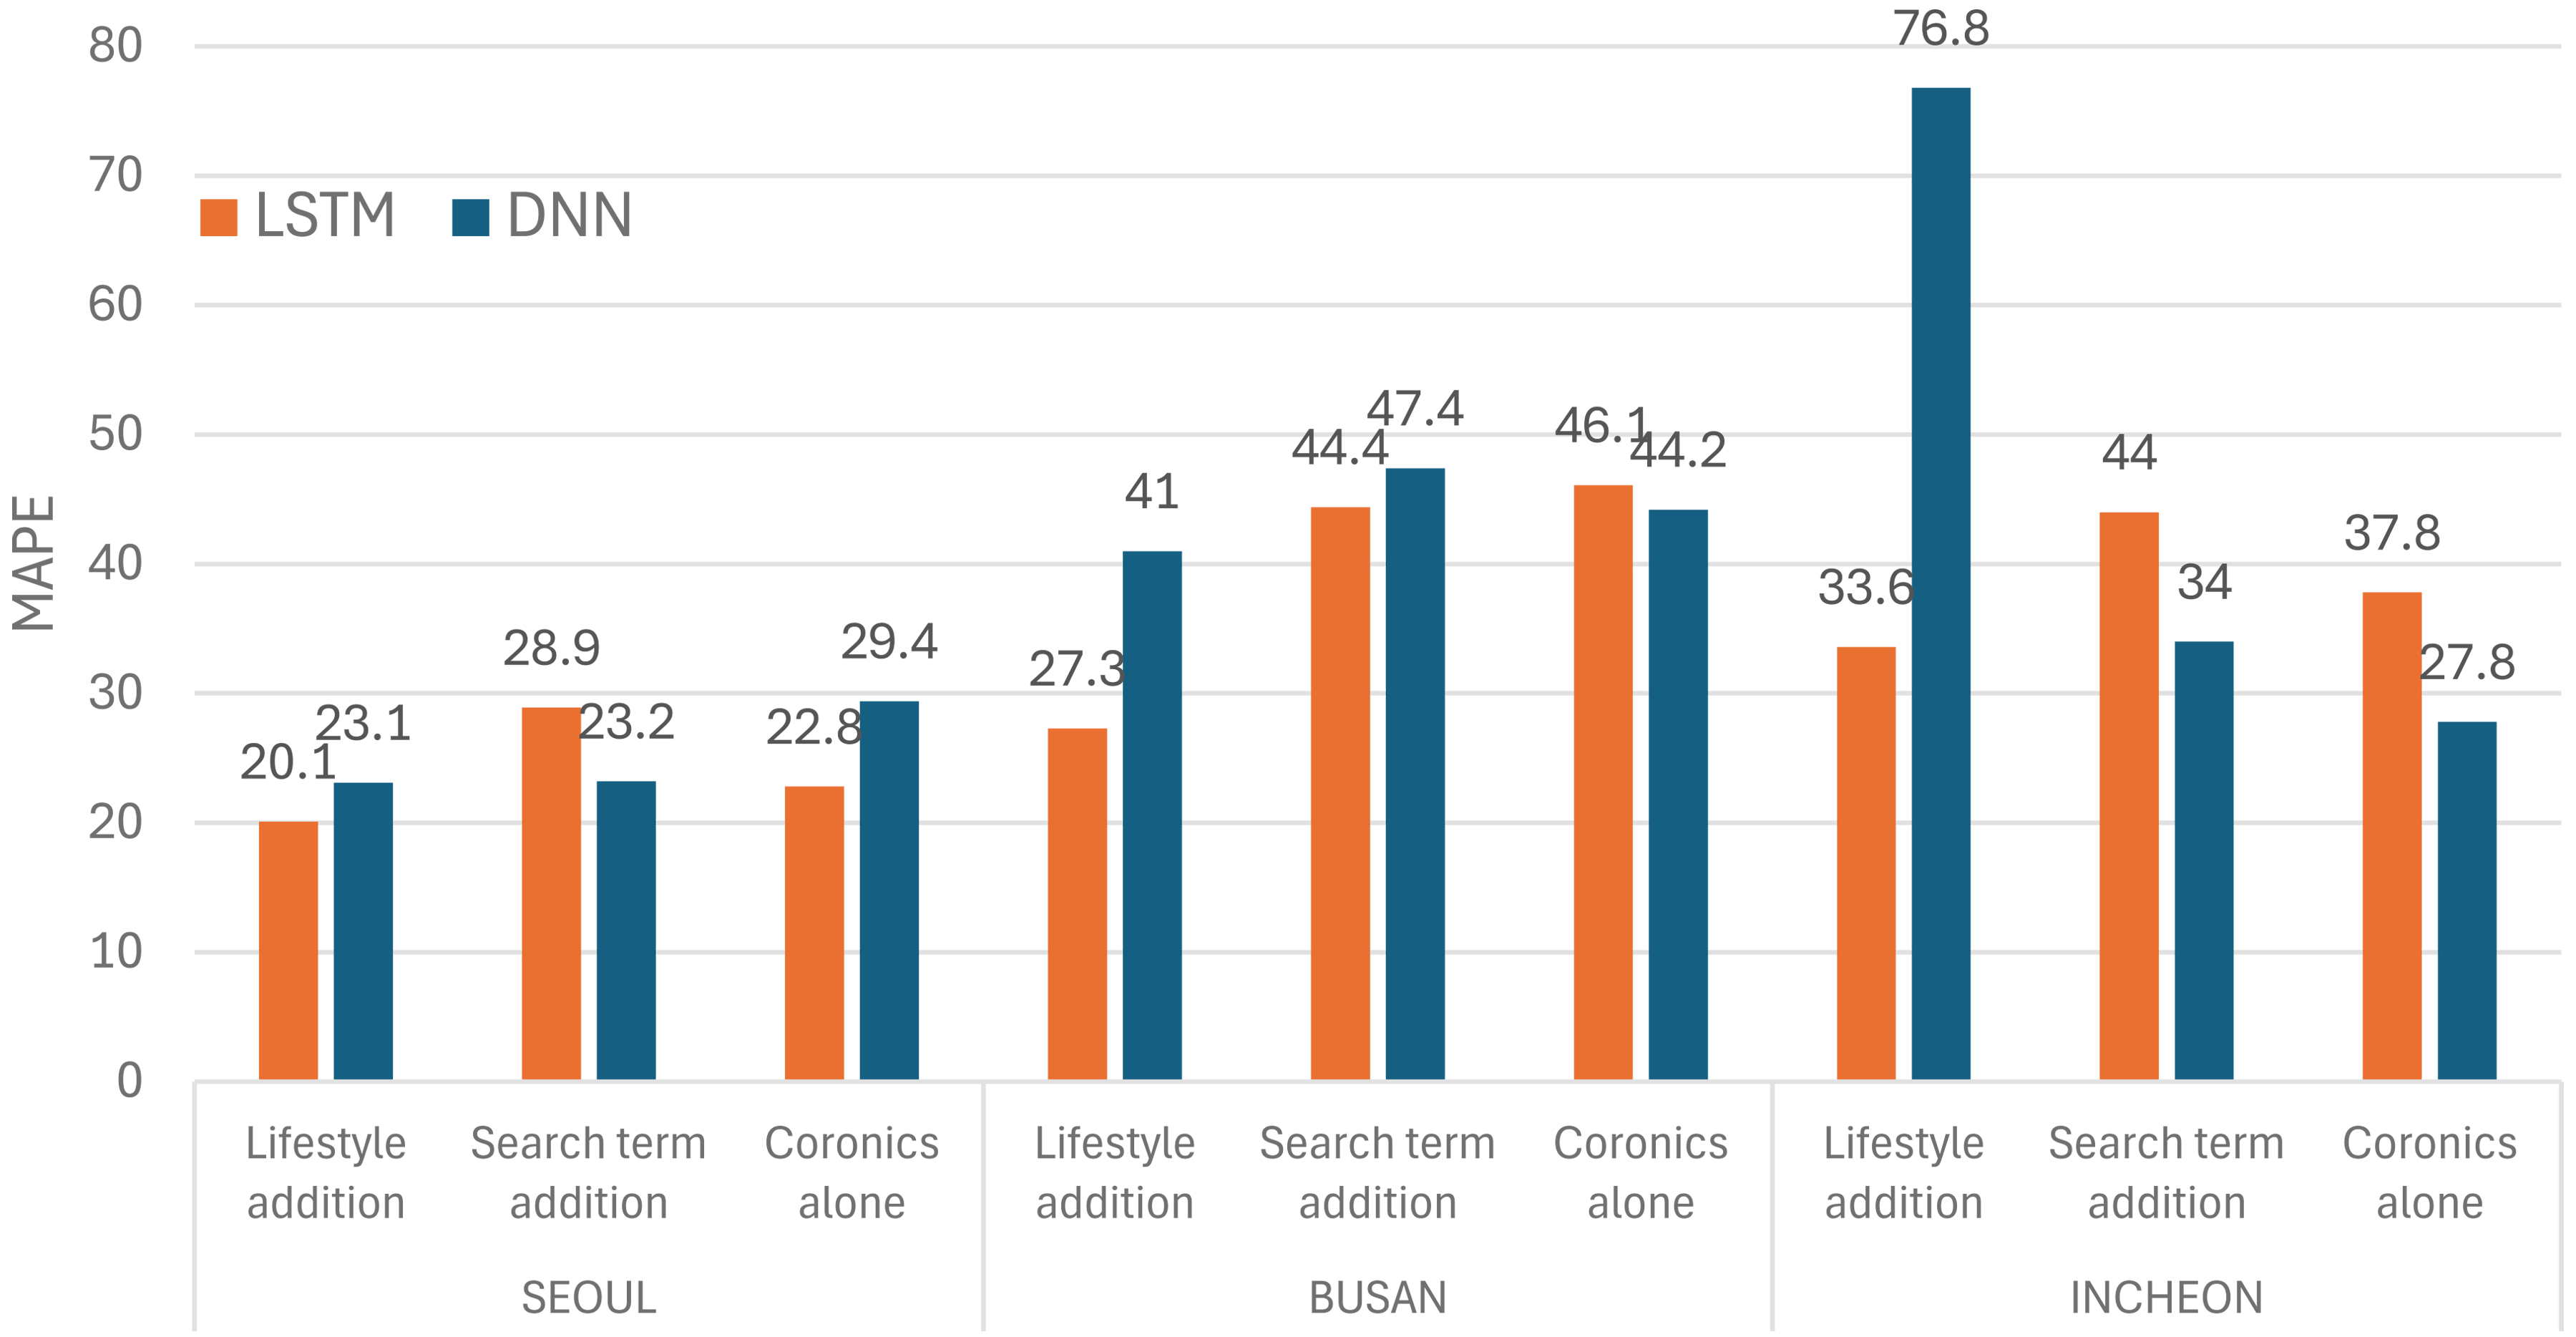
MAPE comparison of DNN and LSTM on each data set.
MAPE, MAE, and RMSE for each data set.

Prediction errors across data sets were also compared through MAE and RMSE. Among a total of 6 cases(3(cities)×2(models)= 6), the MAE showed the lowest value in 4 cases when lifestyle data was added (see Figures 7 and 8), and the RMSE showed the lowest value in 3 cases when lifestyle data was added (see Figures 7 and 8).

MAE and RMSE for each data set when applying the LSTM model.
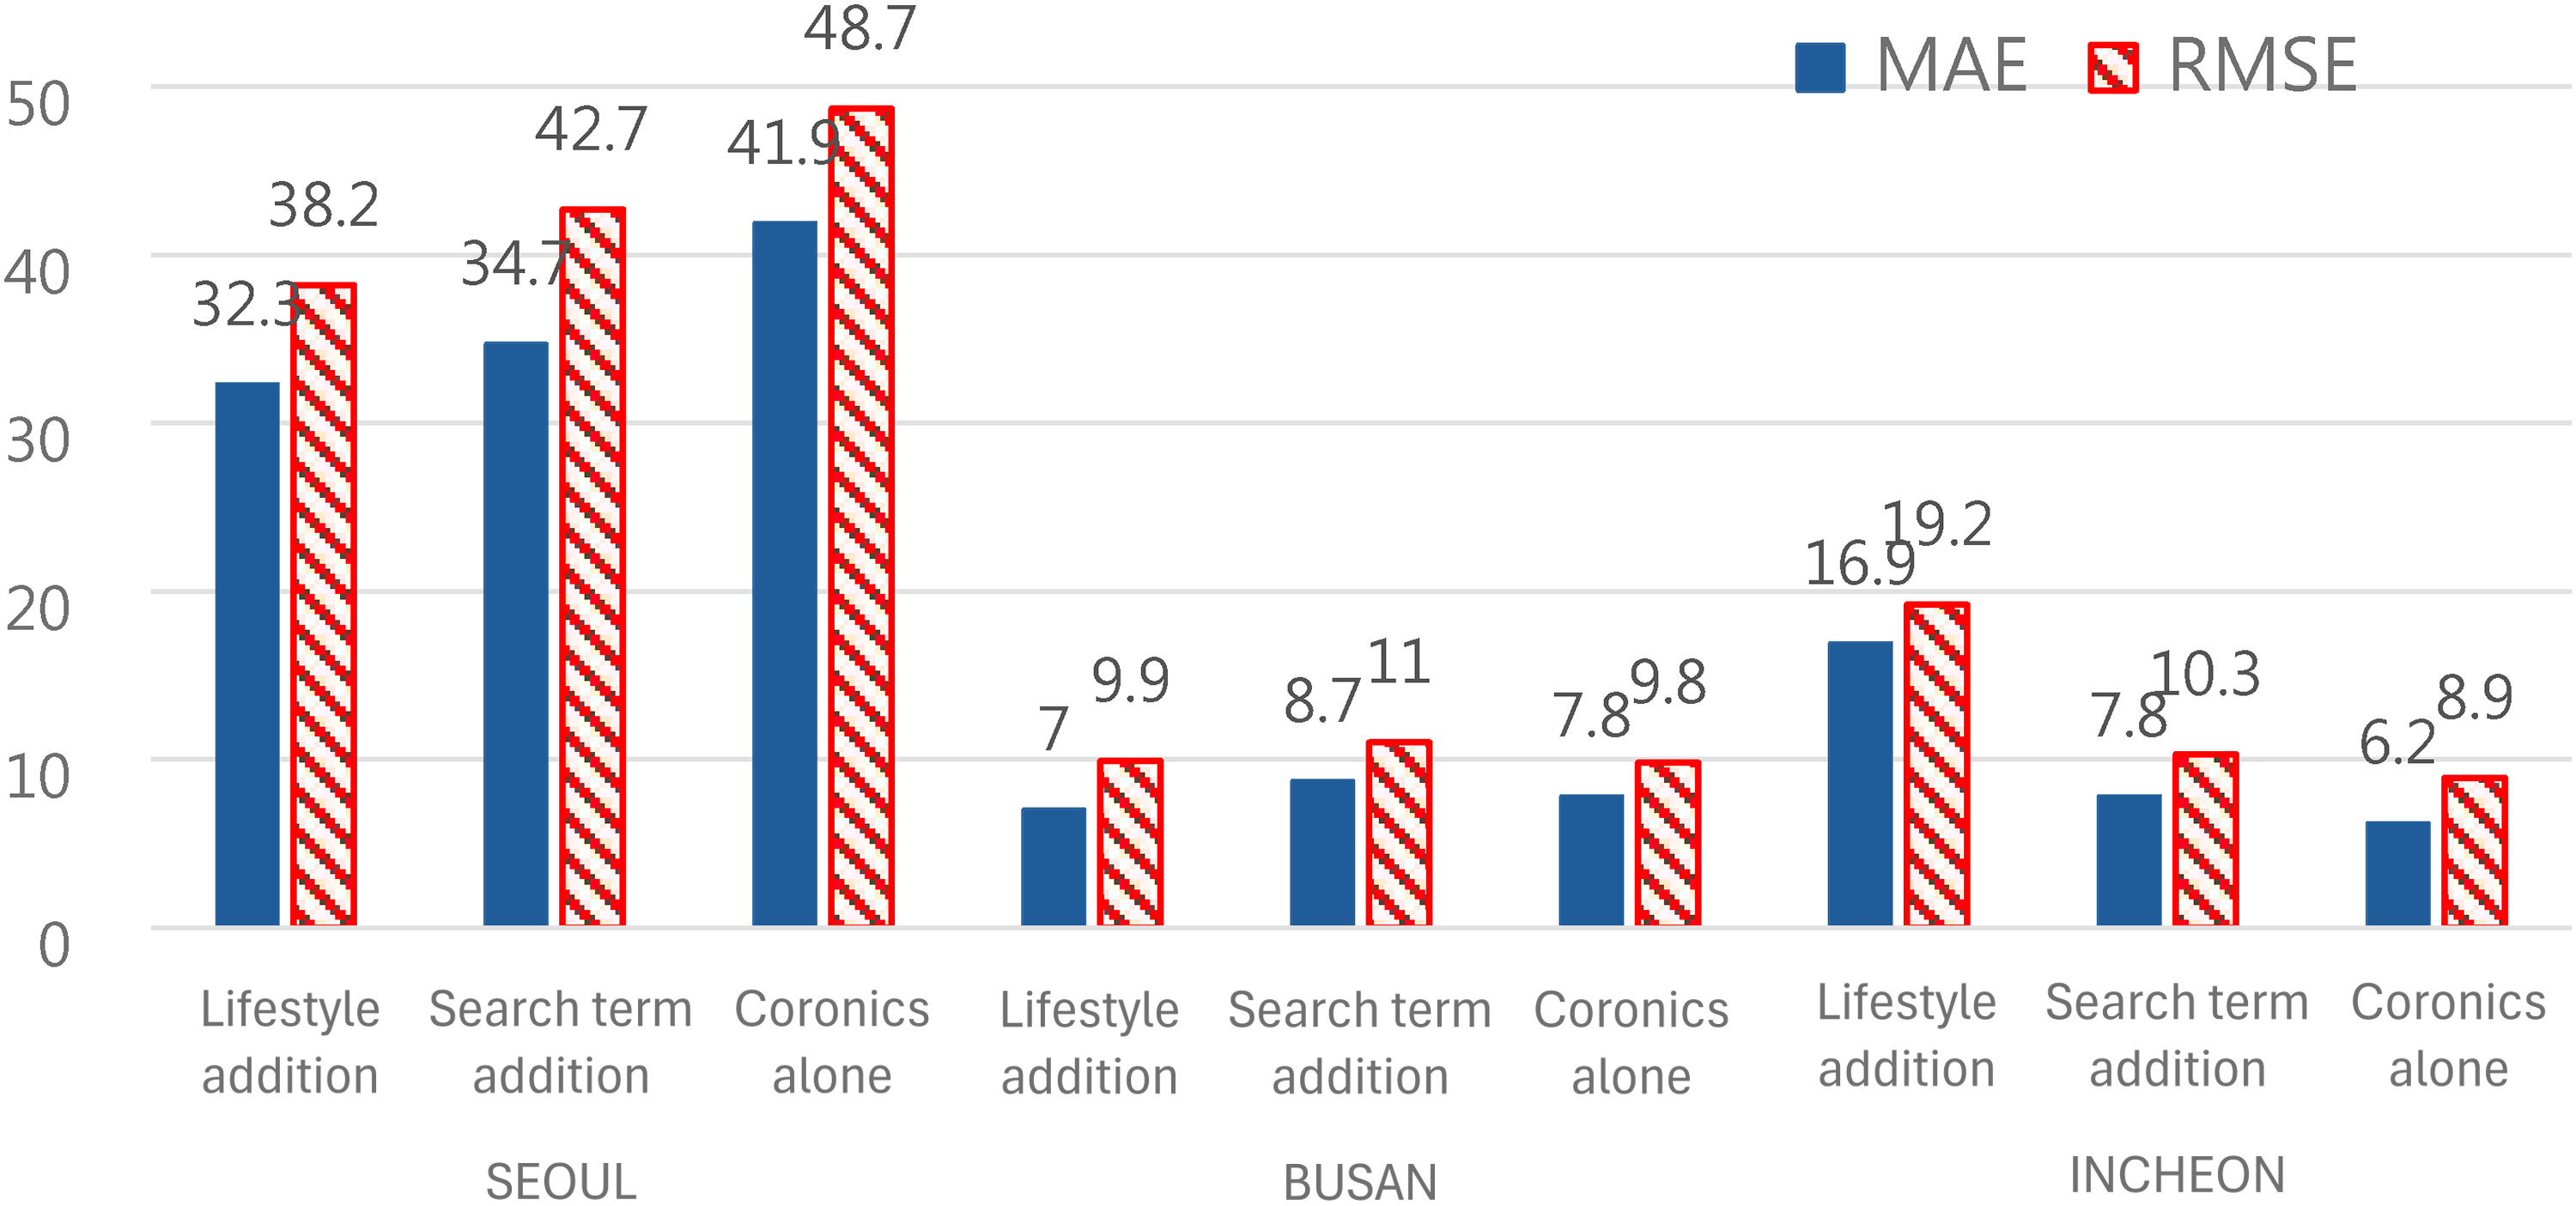
MAE and RMSE for each data set when applying the DNN model.
We also compared the performance between the two models (LSTM vs DNN) on the ‘lifestyle addition’ set. When predicting by applying the DNN model, Figure 6 shows that the error rate (MAPE) is higher in all three regions compared to LSTM due to these limitations (Seoul: 20.1(LSTM) ↔ 23.1(DNN); Busan: 27.3(LSTM) ↔ 41.0(DNN); Incheon: 33.6(LSTM) ↔ 76.8(DNN)).
It is also important to accurately predict the number of confirmed cases, but also how similarly predictive models follow increasing and decreasing trends. Figures 9 to 11 show the predicted and actual number of confirmed cases for one month in February for each data set in three cities.

Predictions for each data set on the actual number of confirmed cases in the Seoul region.

Predictions for each data set on the actual number of confirmed cases in the Busan region.

Predictions for each data set on the actual number of confirmed cases in the Incheon region.
Figure 9 shows that the graph of the ‘search term addition’ set in Seoul is almost similar to the change trends of the actual graph. The number of confirmed cases in Seoul hit a total of four high points during the month of February 2021, including the 3rd, 11th, 17th, and 24th. Looking at the ‘search term addition’ graph, it can be seen that the high point days (4th, 11th, 18th, and 24th) match the high point days of the actual graph or only have an error of only one day.
Looking at the graph of the ‘lifestyle addition’ set in Busan, it can be noticed that the number of confirmed cases on the high point days as well as the high point days almost coincides with the actual graph (See Figure 10).
Incheon hit five high points during the month of February in 2021, which include the 4th, 12th, 19th, 25th, and 27th. The graph of the ‘lifestyle addition’ set shows that high point days(4th, 11th, 18th, 25th, and 27th) match the high point days of the actual graph or only has an error of only one day (See Figure 11).
To numerically know the degree of agreement between the actual graph and the predicted graph (‘lifestyle addition’ set) in Busan, we calculated the Pearson correlation coefficient (R2) between the predicted and actual values of the number of confirmed cases. 58 R2 recorded 0.82, which shows that the relationship between the two numbers is so deep that the actual number of confirmed cases can be determined quite accurately using only the predicted number.
Therefore, we were able to confirm the empirical results that ‘lifestyle’ data can have a great influence not only in predicting the number of confirmed cases, but also in predicting the trend of increase or decrease in the number of confirmed cases.
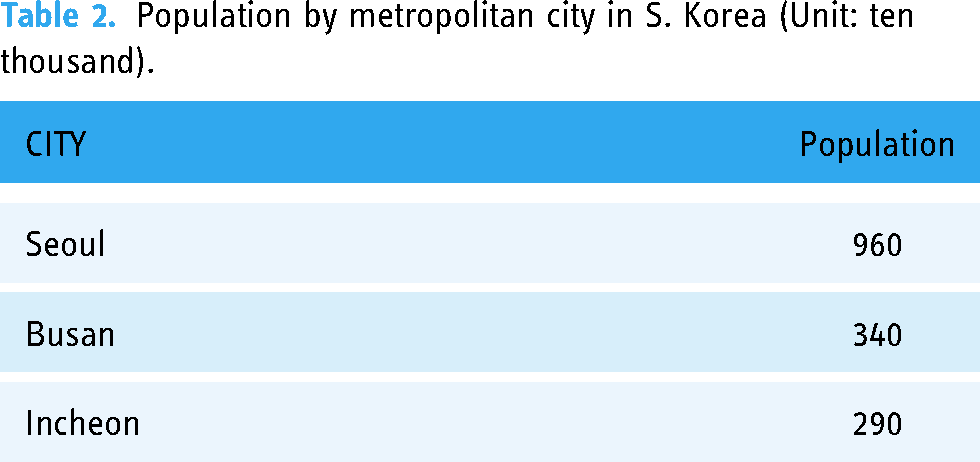
It was also confirmed that the error rate decreases as the population size increases. In Seoul, the most populous city(See the Table 2), the error rate was 20.1 to 23.1%, in Busan, the second most populous city, the error rate was 27.3 to 41.0%, and in Incheon, the error rate jumped to 33.6 to 76.8%.
Population by metropolitan city in S. Korea (Unit: ten thousand).
Statistical analysis
The objective of this chapter is to statistically validate whether the performance differences between three data sets are significant based on their predictions. Given the small sample size of 28, the Resampling-Bootstrap method was employed to test the statistical significance of differences in evaluation metrics between the three data sets. Specifically, block bootstrap was applied to ensure the temporal continuity of the time-series data in the bootstrap samples, with a block size of n1/3. We commonly resampled 1000 bootstrap samples for each bootstrap method.
To compare the evaluation metrics in detail, two approaches were used:
Confidence intervals for metric differences: method 1
Resampling was applied to the differences in evaluation metrics, and the confidence intervals for the differences were calculated using the percentile method. A 95% confidence interval was used.
The differences were calculated by subtracting the evaluation metric of the comparison data set from that of the target data set (i.e., the data set deemed superior in performance), without taking absolute values.
Confidence Intervals of Each data set's Error (the actual value - predicted value): method 2
Resampling was applied to each data set's error to examine the degree of separation between the bootstrap samples and the extent of overlap between the confidence intervals for each data set.
Confidence intervals were computed in the same manner as described in Method 1.
Interpretation of results
This methodological framework was used to analyze and compare the performance of different data sets statistically.
Comparison of metrics across data sets in Seoul
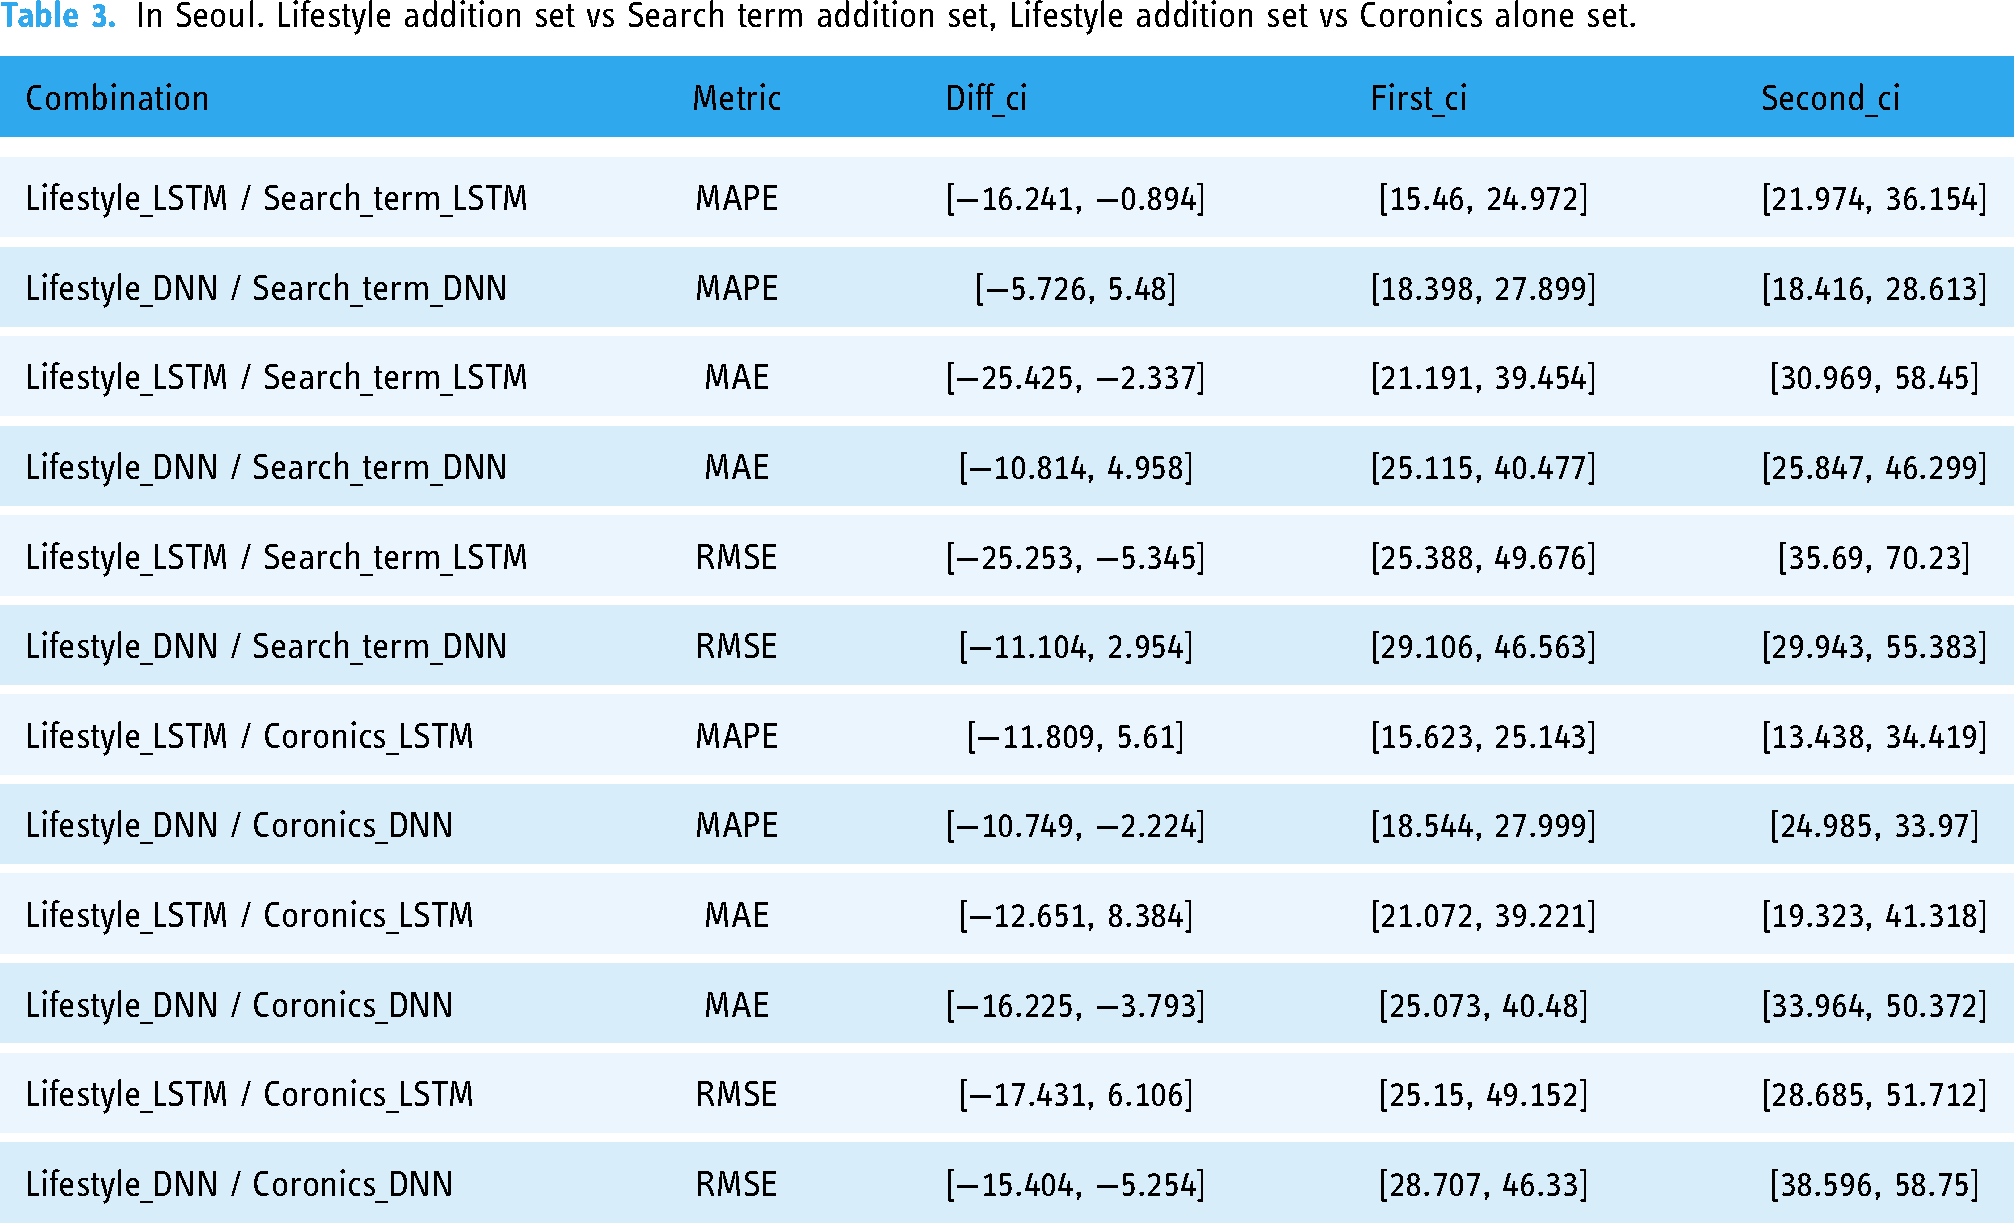
As shown in Table 1, in Seoul, all three evaluation metrics show the lowest error rates in the ‘lifestyle addition’ set regardless of the model applied (see the bold text in Table 1). Therefore, in the ‘lifestyle addition’ set, there are six cases with the lowest error rates (applied deep learning model:2 X evaluation metrics:3). We tested whether the lowest error rates in six cases were statistically significant using block bootstrap. As a result of the significance tests, in the LSTM model, the lower error rate of the ‘lifestyle addition’ set was statistically significant compared to the ‘search term addition’ set for all three evaluation metrics (See Table 3 & Figure 12). However, in comparison with the ‘coronics alone’ set, the lower error rate was not found to be statistically significant (See Table 3 & Figure 13). Conversely, in the DNN model, the lower error rate of the ‘lifestyle addition’ set for all three evaluation metrics was statistically significant compared to the ‘coronics alone set’ (See Table 3 & Figure 14), but not statistically significant compared to the ‘search term addition set’ (See Table 3 & Figure 15). These findings suggest that the ‘lifestyle addition set’ has significant strengths depending on the comparison, providing meaningful performance advantages.

Lifestyle vs Search term / LSTM.

Lifestyle vs Coronics / LSTM.

Lifestyle vs Coronics / DNN.

Lifestyle vs Search term / DNN.
In Seoul. Lifestyle addition set vs Search term addition set, Lifestyle addition set vs Coronics alone set.
Comparison of metrics across data sets in Busan
As shown in Table 1, it can be seen that Busan has the lowest error rate in the ‘lifestyle addition’ set, excluding the RMSE of the DNN model. Therefore, in the ‘lifestyle addition’ set, there are five cases with the lowest error rates (see the bold text in Table 1). We tested whether the lowest error rate in five cases was statistically significant using block bootstrap. As a result of the significance tests, in the LSTM model, the lowest error rate of the ‘lifestyle addition’ set was statistically significant in all three evaluation metrics (See the Table 4). However, it was not statistically significant in the DNN model (See the Table 4).
In Busan. Lifestyle addition set vs Search term addition set, Lifestyle addition set vs Coronics alone set.

Comparison of metrics across data sets in Incheon
As shown in Table 1, it can be seen that the error rate is the lowest in the ‘lifestyle addition’ set only in MAPE of the LSTM model (see the bold text in Table 1). As a result of the significance tests, the lower error rate of the ‘lifestyle addition’ set was statistically significant compared to the ‘search term addition’ set, but not statistically significant compared to the ‘coronics alone’ set (See the Table 5).
In Incheon. Lifestyle addition set vs Search term addition set, Lifestyle addition set vs Coronics alone set.

Comparison of metrics between models
In addition to the statistical significance across data sets, we also tested whether the performance difference between LSTM and DNN models was statistically significant. Comparison between deep learning models was conducted only on the ‘lifestyle addition’ set, which is the target data set of this study. As shown in Table 1, all three metrics in Seoul show that the prediction error are lower when the number of confirmed cases is predicted using LSTM than when predicted using DNN. In Busan and Incheon, the error rates are also lower when predicted using LSTM.
First, in seoul, when testing the significance of the metric differences between the LSTM and DNN models in the ‘lifestyle addition’ set, the confidence intervals (CIs) for the differences all include zero (See the Table 6 & Figure 16). Additionally, the bootstrap samples for each model's metrics are not well-separated, and their confidence intervals overlap. Therefore, it is difficult to conclude that there is a significant performance difference between the two models.

Comparison of metrics between models in Seoul – LSTM vs DNN.
Comparison of metrics across models in Seoul.

In Busan, the difference in evaluation metrics between the LSTM and DNN models in the ‘lifestyle addition’ set is generally significant. This can be confirmed by the confidence intervals (CIs) for the differences shown in the Table 7 & Figure 17 below. Except for MAPE, which is constrained to a range of 0 to 100 due to its percentage-based nature, the 95% confidence intervals for the other metrics do not include zero. Additionally, the histograms of the bootstrap sample distributions for each model demonstrate that the confidence intervals of the two models rarely overlap, and their distributions are well-separated. These findings suggest that the differences in evaluation metrics between the LSTM and DNN models in the ‘lifestyle addition’ set are statistically significant, with the LSTM model showing slightly superior performance.

Comparison of metrics between models in Busan – LSTM vs DNN.
Comparison of metrics across models in Busan.

In the case of Incheon, the difference in evaluation metrics between the LSTM and DNN models in ‘lifestyle addition’ set similar to those observed in Busan can be confirmed. The confidence intervals (CIs) for the differences in metrics in Incheon do not include zero, indicating a clear performance gap between the two models (See the Table 8 & Figure 18). The histograms of the bootstrap sample distributions for each model in Incheon show that the confidence intervals are extremely well-separated, with no overlap, highlighting a stronger distinction compared to Busan. These results confirm that the LSTM model in Incheon demonstrates significantly superior performance compared to the DNN model.

Comparison of metrics across models in Incheon – LSTM vs DNN.
Comparison of metrics across models in Incheon.

On the whole, the LSTM model attained better predictive performance
Discussion
We conducted an exploratory data analysis to see if the number of confirmed cases could be predicted more accurately by including lifestyle data. Deep learning models were used for such predictions. When predicting with the ‘lifestyle addition’ set, the error rate(MAPE) was the lowest in all cases except for the case where the DNN model was applied in Incheon. In Seoul, the error rate was reduced to 20.1%, and in Busan, the graph of the actual number of confirmed cases and the predicted graph were almost identical.
On December 1, 2022, the South Korean government and academia released a report titled ‘COVID-19 Epidemic Forecast Analyzed by Mathematical Modeling’, predicting the number of confirmed cases two weeks later, on December 14, 2022. 59 These research teams predicted the number of confirmed cases in two weeks by considering the amount of movement between regions aggregated from KT mobile communication data and the number of past confirmed cases. The National Institute for Mathematical Sciences (NIMS) predicted that the number of new confirmed cases would decrease from 67,415 on November 30 to 25,000 in two weeks, Ulsan Institute of Science and Technology (UNIST) to 48,401 and Soongsil University's research team to 65,666. This predicted value corresponds to 22.3% to 70.4% when calculated using the error rate (MAPE) used in this study (See the Table 9).
Error rate when predicting the number of confirmed cases by applying mathematical modeling.

Of course, it is not appropriate to compare the prediction performance of the government and academia with that of this study based solely on the results. This is because the characteristics of the data, Length of time series data, the timing of the prediction, and the methodology used for the prediction are all different. However, the error rate of around 20% to low 30% range recorded in Seoul, Busan, and Incheon, especially with only about one year of data, is considered a level of predictive power that policy makers can sufficiently refer to.
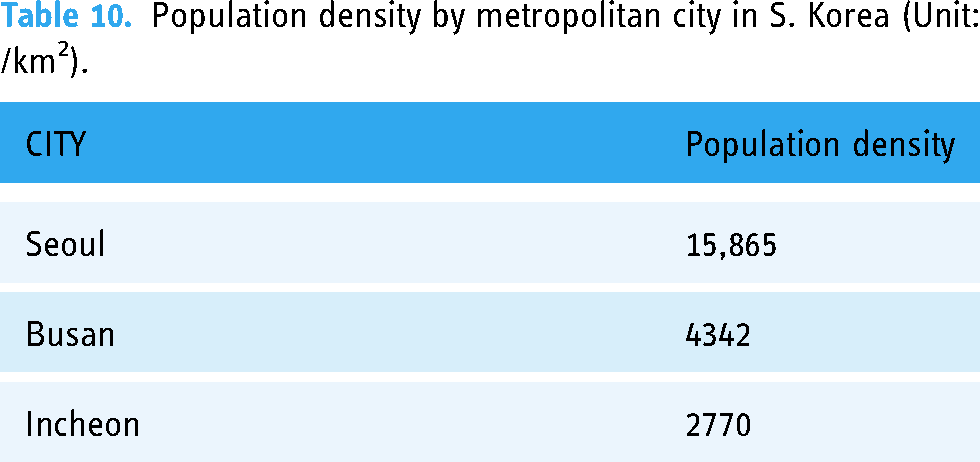
In sequence, why did the ‘lifestyle addition’ set fail to reduce the error rate when the DNN model was applied in Incheon? First, as shown in Table 10, notice that Seoul and Busan have higher population densities than Incheon. Even if the number of people watching a movie at the cinema double equally in three cities, the frequency and intensity of contact in Seoul will be higher than in other cities, which is a condition that increases the likelihood of being infected with COVID-19. It can be interpreted that it is because such a condition can be created for lifestyle data to have an effect only when the population density is to a certain extent. Existing papers also prove that the larger the population, the easier it is to capture many useful trends regarding the spread of infectious diseases.60,61 It has been found that the search terms related to influenza are highly correlated with the number of state-level populations. 62 Population size could be a hidden driver of lower error rates.
Population density by metropolitan city in S. Korea (Unit: /km2).
In Seoul, the most densely populated city, more useful information could be found through the ‘lifestyle addition’ set and thus the error rate was the lowest compared to other cities. Whereas in Incheon, which has a relatively small population density, the ‘lifestyle addition’ set did not emit useful information but rather acted as noise or overlap with other data, so it can be interpreted that the DNN model failed to capture useful information, resulting in an increased error rate.
Then, why was the error rate the lowest in the ‘lifestyle addition’ set when the LSTM model was applied in Incheon? This can be seen as due to the characteristics of the LSTM model, which is specialized for time series data analysis, as mentioned earlier. As the LSTM model sequentially analyzed time series data, it succeeded in removing noise and finding useful information in ‘lifestyle addition’ set.
In addition, to further reduce the error rate in follow-up research, it is necessary to more accurately forecast the possibility of contact with a confirmed case using the GPS-location data of the smartphone or to develop the current model, such as deepening the hidden layer or adding various techniques.
Infections caused by COVID-19 are still ongoing. In South Korea, the number of hospitalized COVID-19 patients increased nearly five-fold as of August 3, 2024, compared to four weeks ago, 63 and at the 2024 Paris Olympics, as the COVID-19 spread mainly in the swimming event, an infected athlete withdrew the women's 1500 m freestyle event. 64 Vaccines and treatments to cope with COVID-19 are being released, yet simultaneously, many variants emerge, continuing to hinder our efforts to return to normal life. We focused on predicting the number of confirmed cases of COVID-19. Still, as mentioned in the introduction, the new approach used in this paper can also be applied to other future epidemic outbreaks. So, we believe that the LSTM model and ‘lifestyle addition’ set used in this study could be sufficiently used to provide policymakers with timely and reliable estimates of new infectious disease activity.
Limitation
This study had two limitations. First, as mentioned earlier, we collected data for about a year after the COVID-19 pandemic began. This is because a certain amount of data must be accumulated in order to train and verify a deep learning model. 58 Therefore, with the model used in this study, immediate prediction is impossible once a pandemic begins. Second, the fact that the study was conducted by selecting only three cities in South Korea in order of population may affect the quality of the data and the generalizability of the results. However, the study results were consistent with previous research. The larger the population, the more useful information was released, and the deep learning model was able to lower the error rate by capturing this information. Therefore, the results of this study firmly confirmed the results of previous studies.
Conclusion
Through this study, we were able to identify three notable results that could contribute to predicting the number of patients infected with epidemic in the future. First, we demonstrated a new approach using lifestyle data for analysis, which helped us uncover hidden meanings and predict future contagion trends. In all cases except one case, i.e., applying the DNN model in Incheon, the error rate was lowest when prediction was made with the ‘lifestyle addition’ set.
Second, even without applying the latest deep learning technology, a powerful prediction performance was achieved through a prediction model tailored to the time series data. The low error rate in Seoul and Busan was achieved through the addition of lifestyle data, rather than through technological advancements such as the development of new algorithms. Therefore, we are confident that prediction accuracy will be further improved if the latest deep learning technology is applied.
Third, such predictive power could be achieved using public data that anyone can access. Many studies predicting the number of confirmed cases of infectious diseases, including COVID-19, are using clinical data. However, such clinical data is highly controversial due to the possibility of invasion of privacy. Therefore, in this study, we wanted to check whether the error rate could be lowered by using publicly available data that had no concerns about personal information infringement and confirmed that it could actually be lowered.
Footnotes
Acknowledgements
The author would like to thank the MBN reporter, Hyukjun Lee for providing data on the number of confirmed COVID-19 cases in 3 cities in South Korea.
Contributorship
The primary author, SWJ, designed, conceptualized, and conducted the study, including data curation, deep learning model building, analysis, and writing.
Declaration of conflicting interests
The author declared no potential conflicts of interest with respect to the research, authorship, and/or publication of this article.
Ethical approval
Ethical approval was not sought for the present study because it used public data that anyone can access.
Funding
This work was supported by the Institute of Communication Research, Seoul National University and the National Research Foundation of Korea [NRF-2021S1A5B8096358]
Patient consent statements
The authors confirm that no Patient Consent Statement was required during the study because no subject or patient was involved in the present study as the study relied public data that anyone can access.