
Abstract
Background
Generating high-quality data at health facilities is fundamental for effective decision making, which helps to strengthen health system performance and promote better health outcomes. Previous studies have revealed inconsistent findings and design-related drawbacks regarding the quality of routine health data. This study, therefore, aimed to assess the level of data quality and associated factors in the routine health information system among health workers in public health institutions of Gofa zone, Southern Ethiopia.
Methods
An institution-based quantitative cross-sectional study was mixed with a phenomenological qualitative study. Data collection was executed from April 1 to 30, 2023. Samples of 304 health workers were randomly selected. A total of six in-depth interviews and three focus group discussions were also done. Multilevel linear regression and thematic analysis were applied.
Results
The perceived level of good data quality was 59.5% (95% CI = 53.8, 65.1). The report timeliness, data accuracy, and the data completeness were 53.3%, 89.4%, and 93.5%, respectively. Factors that were significantly associated with data quality include culture of information utilization (β = 0.23, 95% CI = 0.20, 0.40), perceived skill of data management (β = 0.10, 95% CI = 0.03, 0.18), and electric power access (β = 0.11, 95% CI = 0.01, 0.21). The data quality was decreased in health posts by −0.20 (95% CI = −0.371, −0.030).
Conclusion
The overall quality of routine data among health workers was lower. Improving the skills of data management, cultivating a habit of data use, and enhancing the capacity of health workers are the potential interventions for ensuring data quality in health institutions.
Keywords
Introduction
A health information system (HIS) is defined as an integrated effort to collect, process, report, and use health information and knowledge to influence policymaking, program action, and research, which are essential to the effective functioning of health systems. 1 A routine health information system (RHIS) comprises data that are generated at regular intervals from public, private, and community-level health facilities. 2 A RHIS has two interlinked functions: the production of quality routine health data and the effective utilization of the data for decision making. 3 Data quality is a state of data accuracy, completeness, and timeliness that make data appropriate for use in identifying gaps, setting targets, making various decisions, and providing evidence-based feedback. 4 Producing high-quality data at health facilities is fundamental for effective decision making, which helps to strengthen health system performance, improve service delivery, and promote better health outcomes.5,6
In both developing and developed nations, many resources have been invested to enhance national RHIS, but the system remains fragmented, poorly coordinated, and burdened with parallel reports, which might impede the country's ability to manage the quality of routine health data.7,8 In these nations, particularly in developing countries, the use of RHIS data has been questioned due to missing values, biases, data classification issues, and entry errors. 9
The key problem of RHIS in African countries like Lesotho, Mauritius, Sudan, and Tanzania was the disintegrated management of data due to program-specific demands by different vertical partners.
10
In these countries, the quality of routine health data, measured through metrics like the accuracy, timeliness, and completeness of data
In Ethiopia, only 30% of the Antenatal Care (ANC) data reported was consistent with the source documents in health facilities. The study also revealed that 16% of malaria and 15% of pentavalent three-dose data were overreported at the district level. 16 In the Jimma Zone of Ethiopia, the completeness of data ranged from 34% to 75% and timeliness from 32% to 70% in 8 of the indicators assessed. 17 The completeness of registers and reports was 54% and 56%, respectively, whereas the consistency was only 39% according to the findings in Tigray of Ethiopia. The study also revealed that the lot quality assurance sampling (LQAS) system of routine report was 61%. 18 An assessment in Southern Ethiopia reported that the average data accuracy level of health centers was 76%. 11 The findings were lower than the 90% standard of the Ministry of Health in Ethiopia. 19
Ethiopia has undertaken a comprehensive reform of the RHIS through the implementation of the reformed health management information system (HMIS) since 2008, with a primary emphasis on producing high-quality data and ensuring its effective utilization. 20 The reform aimed to standardize, integrate, and simplify the data management system. 21 The information revolution, an initiative implemented since 2016, is one of Ethiopia's five key agendas of the Health Sector Transformation Plan II (HSTP II) (2021–2025). 22 The initiative was designed to improve the data management process and influence decision making through the adoption of new digital innovations in RHIS, like district health information system 2 (DHIS2). 23
Currently, the quality of health data in Ethiopia is poor, especially at the health facilities, which bear primary responsibility for the production of routine data. The basic reasons underlying poor quality of data in RHIS were not adequately addressed in Ethiopia. In the previous studies, the level of data quality in RHIS had inconsistent findings. The studies also have design-related drawbacks, such as a lack of accounting for institutional-level variation in data quality. Failing to account for institutional-level variation in data quality can lead to inaccurate assessments and misleading conclusions. There is very limited existing evidence that considers the qualitative aspects, as data quality is a complex construct influenced by personal perspectives and beliefs. Although there are studies conducted at the district, health center, and hospital level, there has been limited evidence regarding the quality of data at the health post level.
For the description of variables, this study applied the Performance of Routine Information System Management (PRISM) framework, which encompasses behavioral, technical, and organizational determinants of data quality. 24 The behavioral determinant included was data management skills; technical determinants encompassed data collection and reporting forms and designs; and organizational determinants included the information use culture, performance monitoring meetings, training, supervision, feedback, and infrastructure resources such as computer availability, electricity supply, and internet access. These variables were selected because they provide a holistic view of aspects of data quality that have been inadequately understood in previous studies. Data quality is a complex construct that may not be easily understood through quantitative measurement alone; instead, it requires exploring health workers’ experiences, beliefs, and perspectives.
Therefore, the hypotheses of this study are:
The level of data quality in RHIS is not lower than the Ethiopian national standard.
There is no significant association between the factors and data quality practice in RHIS.
The level of data quality does not significantly vary among different health institutions.
Overall, this study aimed to assess the level of data quality and associated factors in the RHIS among health workers in public health institutions of Southern Ethiopia.
Methods
Study setting
This study was implemented in the public health institutions of Gofa Zone, located 526 km south of Addis Ababa, the capital of Ethiopia. It also has 11 districts (7 urban and 4 rural) and 196 kebele (the smallest administrative units). Currently, the zone has 1510 health workers serving in 179 health posts, 26 health centers, 2 governmental hospitals, and 11 district health offices.
Study design
A mixed methods design was adapted. An institution-based cross-sectional quantitative study was combined with a qualitative study design to integrate the two approaches and develop a comprehensive understanding of the aspects of data quality. One of the qualitative research designs, phenomenology, was applied to assess the lived experiences and knowledge of health workers regarding data quality. Combining the two sources of data enables us to benefit from the detailed, contextualized insights of qualitative interview and the generalizable, externally valid results of quantitative data. 25 In this way, the strengths of one type of data mitigate the weaknesses of the other. 26 We used a mixed-methods approach because the data quality is a complex phenomenon that encompasses both subjective and objective viewpoints, which need to be addressed in an integrated manner. One of the mixed-methods design typologies, concurrent triangulation design, was adopted to collect both sets of data simultaneously and analyze them separately. 27 Then, the two data sources were given equal priority and integrated through triangulation during the presentation of findings, interpretation, and discussion. 28 The data collection was executed from April 1 to 30, 2023.
Study participants
All health workers and public health institutions in the study area constitute the source population. Randomly selected districts and respective health institutions were considered as the study population. Similarly, heads of health institutions and departments, HMIS unit leaders, and randomly sampled health workers who are directly involved in the recording and reporting process were considered for inclusion (quantitative). In the qualitative interview, a purposive sample of health workers were included, comprising heads of the institutions, department leaders, health service providers from the outpatient and maternal and child departments, and health extension workers. Newly employed health workers with less than 6 months of experience and privately owned health institutions were excluded.
Sample size determination
In determining the sample size, the study applied the assumptions of confidence level of 95%, power of 90%, nonresponse rate of 10%, and marginal error of 5%. The intracluster correlation coefficient (ICC) of a previous related report was 0.35, with an average cluster size of 4.3 and a design effect of 2.16. 29 The percent of unexposed with an outcome was 33%, and the odds ratio was 3.42. 3 By applying all the assumptions, a total of 309 health workers were planned to be sampled. Regarding clusters, 6 from 11 districts of the zone were randomly selected, constituting a total of 72 public health institutions (6 districts, 18 health centers, 2 hospitals, and 46 health posts).
In the qualitative interview, both purposive sampling and maximum variation sampling techniques were applied. We selected health workers whom we believe are appropriate and capable of providing accurate information for the study. Additionally, we applied a judgmental approach to select participants, considering a range of variations in their backgrounds and experiences related to data quality. Accordingly, a purposive sample consisting of 3 focus group discussions (FGDs) and 6 in-depth interviews (IDIs) was conducted, involving a total of 18 informants. Data collection was determined to end once we felt that no new information was being obtained across all expected themes.
Data collection procedures and tools
A total of 8 data collectors and 3 supervisors were deployed for data collection after receiving 3-day intensive training on data collection protocol. Standardized questionnaires, adopted from the PRISM series, were utilized.24,30 The PRISM tool is designed by the WHO and MEASURE Evaluation. This standard tool is the most common, widely accepted, and frequently utilized standard data collection instrument in the existing literature for HIS in general and RHIS in particular. The questionnaire was developed in an English version and translated to the Amharic language for better understanding of respondents.
For the qualitative interview, semistructured, open-ended, and nondirective Amharic version interview guides were designed. Individual (IDIs) and group-based (FGD) face-to-face approaches were organized and facilitated by trained and experienced data collectors. An audio recording was done, and field notes were taken. The research team did not have any prior contact or experience with the participants before the beginning of the data collection process. On average, each FGD took about 85 minutes, while each IDI lasted about 40 minutes. Precautions were taken to ensure that there were no distractions during the conversation, with all IDIs and FGDs conducted in private rooms at the participants’ respective working institutions.
Variable measurement
Since data quality is a multidimensional construct, it is a function of different dimensions commonly including data accuracy, completeness, and timeliness. 4
Other predictor variables, such as perception of data management skills and attitudes toward information utilization culture, were also measured using a Likert scale structure computed in a similar procedure.
Data analysis
Data were collected by electronic data collection software, with the Kobo Collect application and exported to SPSS Version 26 for analysis after being checked for completeness and consistency. Descriptive statistics like frequencies, proportions, mean, and standard deviation were computed.
Principal component analysis with orthogonal varimax rotation was conducted to assess the underlying structure of the 11 variables related to data quality practices. The assumption of absence of multicollinearity was met, with a determinant score of 0.035 (greater than 0.00001). The measure of sampling adequacy was satisfied with a Kaiser-Meyer-Olkin (KMO) test value of 0.64 (greater than the recommended value of 0.6). Additionally, Bartlett's Test of Sphericity was significant, p < 0.001 (χ2 = 999.29, df = 55, n = 304). An eigenvalue criterion of component extraction was utilized, resulting in a four-factor solution with a cumulative variance of 70.73%. No items were removed; therefore, all 11 items were deemed eligible for the final score calculation. Three variables, such as good documentation practices, sufficiency of routine health data, and accurate data compilation, are loaded onto the factor pertaining to the first construct. On the other hand, data quality review, encouraging integrity in data management, and assurance of data completeness are loaded onto the second factor. A good data recording and reporting system, effective data communication, and appropriateness of data content are loaded onto the third factor. Similarly, quality information and decision-making systems, along with report timeliness, are loaded onto the fourth factor.
Multilevel linear regression analysis was adopted. In conventional regression analysis, individual data records are considered independent, or the data are assumed to have no correlation with each other. 34 However, this assumption may not be valid in analyses of multi-institutional studies for constructs like data quality, because data from the same clusters or institutions are often correlated. There is existing evidence that data quality in RHIS varies among health institutions. 3 Therefore, multilevel analysis is an appropriate and recommended approach for accounting for the clustering effects for this outcome. 35
Before employing the main analysis, the ICC of the data was calculated. The results of the no-predictors model indicate that the building of a multilevel model was warranted. This is because (1) the intercepts varied significantly across health institutions (Wald Z = 3.69, p < 0.001) and (2) the ICC suggested that about 36.7% of the total variation in data quality occured among public health institutions. The result is much higher than the expected satisfactory ICC of 5% or more. 36
Variables with a p
The audio-recorded interviews and the field notes were transcribed in Amharic and translated into English. Coding and categorizations of themes and subthemes were done based on the similarity of responses. To ensure a fair interpretation of the data, the coding was done by two independent authors (BKD and DHK), who compared their results and reached an agreement on each theme. Thematic content analysis was employed using ATLAS ti 7.5 software, and themes were developed among the codes after the codebook was prepared. The themes were primarily derived from the data in an inductive manner.
Data quality control
Three-day training was provided to the survey team on the data collection protocol for both qualitative and quantitative approaches. The pretesting of the questionnaire was conducted on 33 health workers sampled from health institutions in the adjacent district of Uba Debretsehay. The pretest data was analyzed to obtain Cronbach's alpha, with a reliability coefficient of 0.70 or higher considered reliable for multivariate variables. 37 Standardized quantitative questionnaires were applied.
In the qualitative interview, the data collector conducted one in-depth interview during the pretest process to test the interview protocol, identify issues, and incorporate additional feedback. The audio-recorded files were translated and transcribed into the English language carefully by a trained investigator. The transcripts were then reviewed and validated by the other co-authors. An experienced qualitative expert from Hawassa University also reviewed the transcript and provided feedback on its quality.
Results
Characteristics of the study participants
A total of 72 public health institutions were assessed. Among these institutions, 304 health workers participated in the study, with a response rate of 98.4%. Among the respondents, about 194 (63.8%) were males, and 239 (78.6%) participated from rural health institutions. Of the 304 health workers, 198 (65.1%) were diploma holders, and 177 (58.2%) were selected from health centers (Table 1).
Distribution of the characteristics of the health workers in Gofa Zone, Southern Ethiopia, 2023 (n = 304).
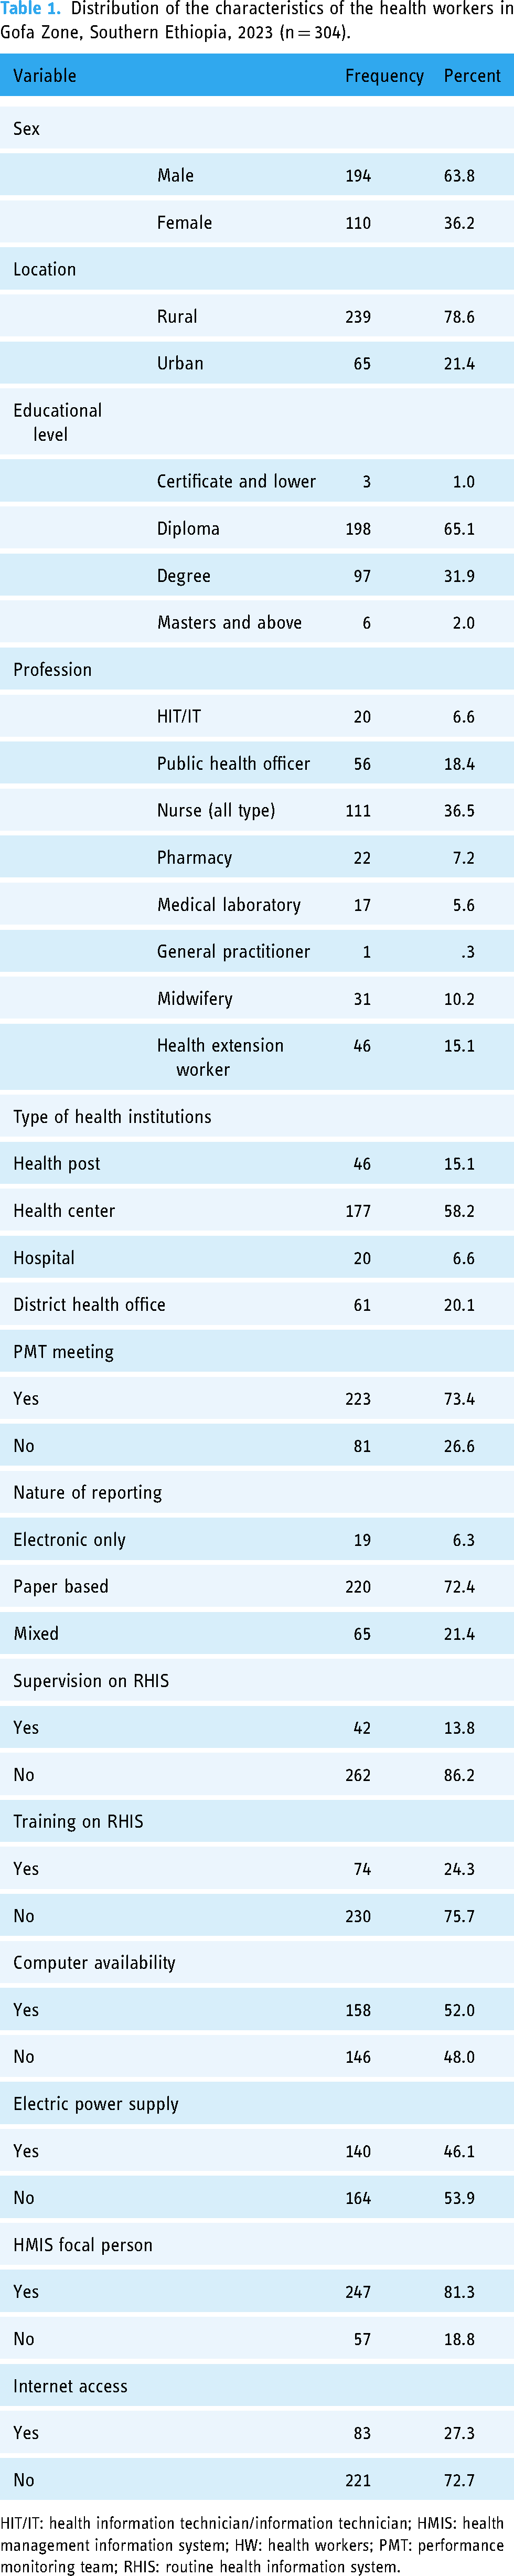
HIT/IT: health information technician/information technician; HMIS: health management information system; HW: health workers; PMT: performance monitoring team; RHIS: routine health information system.
The average age of health workers was 30.07 years with a standard deviation (SD) of 3.77. The median monthly income and work experience of the participants were 6193.00 Ethiopian Birr and 6.69 years, respectively. The mean levels of information utilization culture and data management skill were 2.26 and 2.30, respectively.
In the qualitative interview, a total of 18 informants participated. The median age of participants was 30 years, with a standard deviation of 3.9. The median work experience was 9.5 years. A total of 13 participants (72.2%) were females. Regarding the institutions from which the participants were selected, 4 (22.2%) were from the district health office, 7 (38.9%) health centers, and 7 (38.9%) health posts. A total of 12 (66.7%) of the participants were rural residents, while the remaining 6 (33.3%) were from urban areas.
The level of data quality by dimensions
Completeness and timeliness
The average report completeness of the health institutions is found to be 96.2% and timeliness is 53.3% (Figure 1). On the other hand, the average data completeness of the health institutions is 93.5%, where the lowest is recorded in health posts (92.1%) (Figure 2). In the qualitative interview, the theme entitled “Challenges Related to Data Quality” highlighted problems associated with completeness and timeliness, particularly at the health post level. According to an informant in the IDI, the routine reports were not submitted within the expected timeframe due to a shortage of reporting and recording tools at the health post level, as stated below: “In terms of completeness and timeliness, delays are particularly notable in health post reports. At the health post level, there is a shortage of standard documentation tools and training for health extension workers on the HMIS program.” (HMIS unit director)

Report completeness and timeliness by the health institutions in Gofa Zone, Southern Ethiopia, 2023 (n = 24).

Data accuracy and data completeness by the health institutions in Gofa Zone, Southern Ethiopia, 2023 (n = 72).
Data accuracy
The mean data accuracy, explained by the verification factor of the institutions, was 89.4%. A total of 15 health institutions (20.8%) overreported, while 3 institutions (4.2%) underreported the data (Figure 3). As mentioned in the theme “How to Maintain and Keep Documentation” from the qualitative interviews, there are numerous challenges in maintaining the accuracy of routine health data. For example, an IDI participant described the situation as follows: “Sometimes, registries or tally sheets have missing or incomplete data, which makes the LQAS process difficult. Additionally, there may be instances of overreporting or underreporting.” (Head of district health office)

Data verification among health institutions of Gofa Zone, Southern Ethiopia, 2023 (n = 72).
Perception of respondents on data quality
The mean perception of data quality was 2.32 (95% CI = 2.29, 2.35, SE = 0.02). A total of 181 (59.5%) (95% CI = 53.80, 65.10, p < 0.001) of the respondents were categorized as having “good” perception on data quality practice (Figure 4).
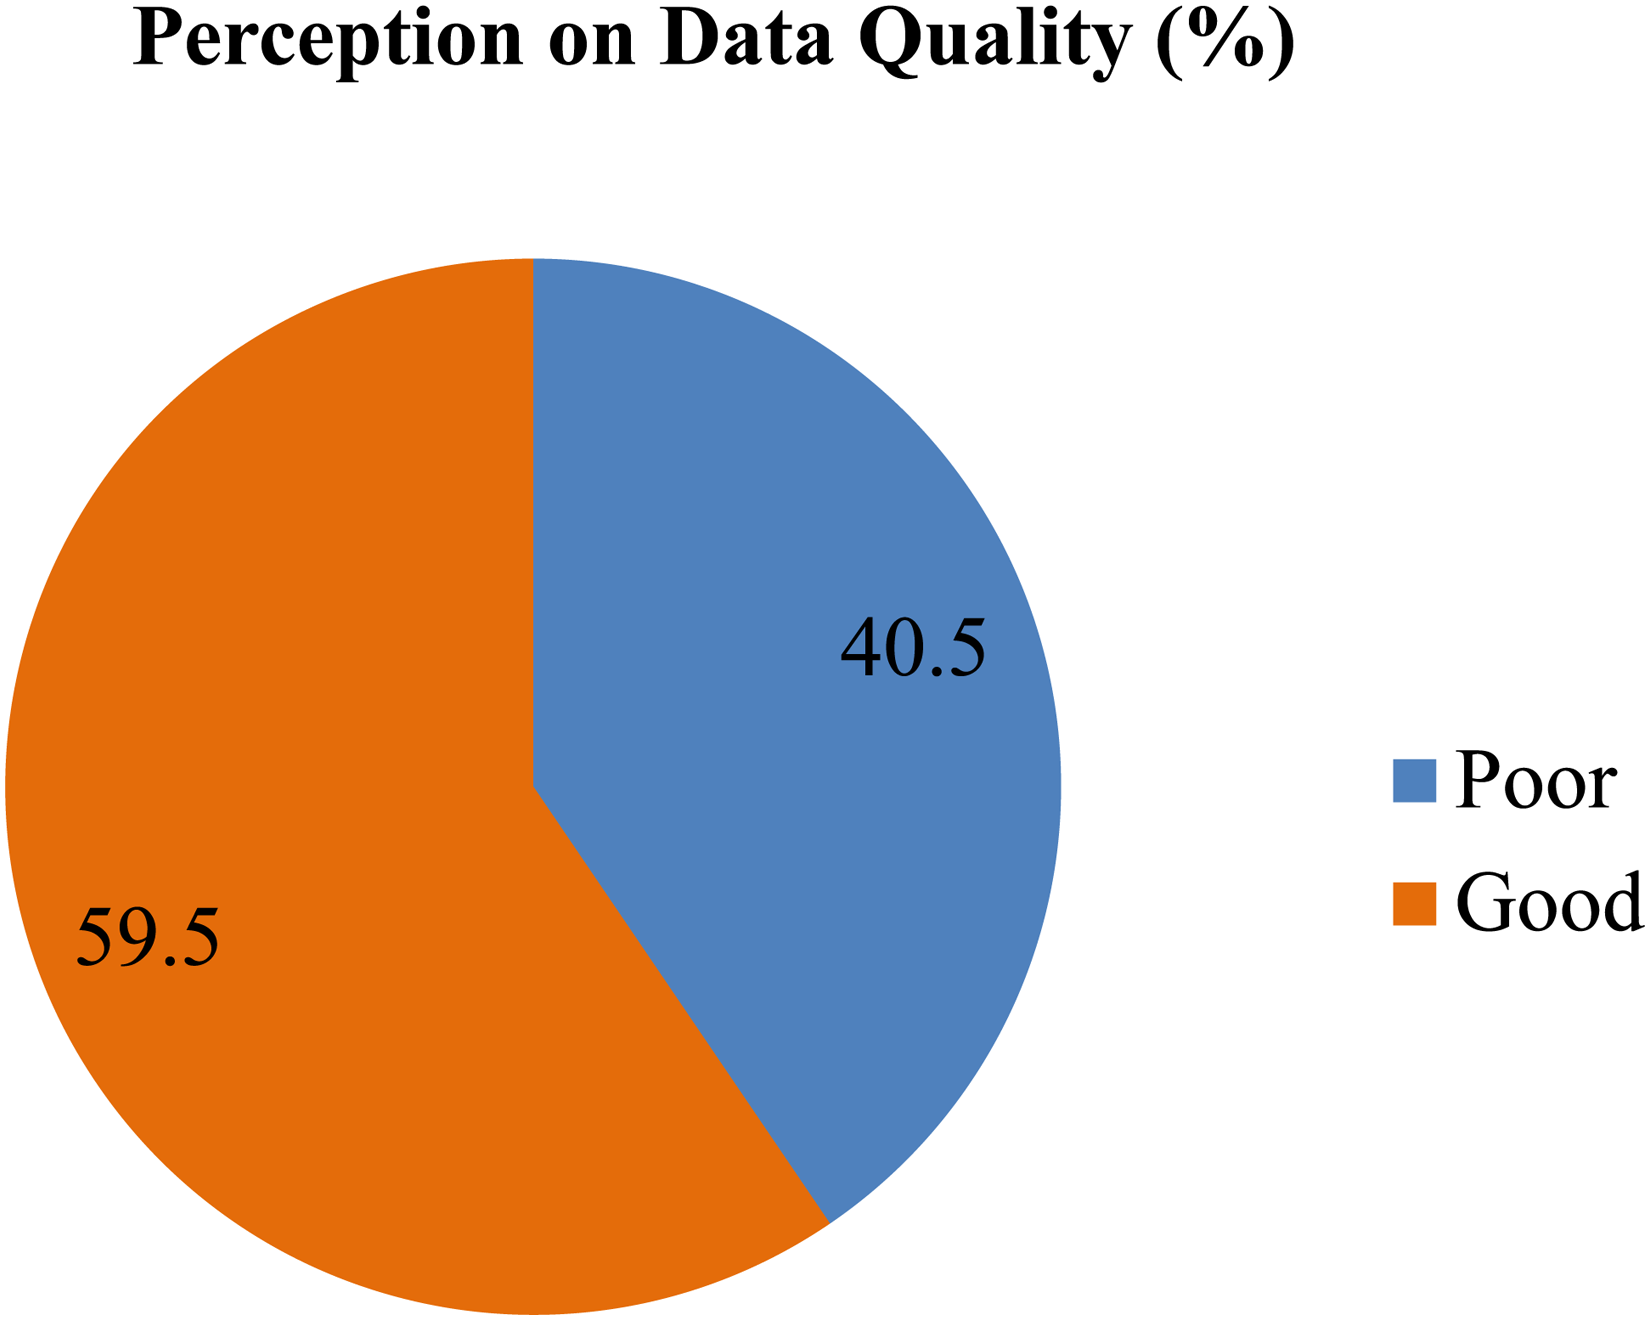
Perception of respondents on data quality in Gofa Zone, Southern Ethiopia, 2023 (n = 304).
Factors and themes associated with data quality practice
In the bivariate multilevel analysis, type of health institutions, receiving feedback, providing feedback, computer availability, availability of electric supply, presence of HMIS focal person, information utilization culture, and perceived skill of data management are significantly associated with the outcome variable, perception of respondents on data quality. However, only information utilization culture, perceived skill of data management, type of institutions, and availability of electric power supply were significantly associated with the outcome in multilevel multivariate analysis (Table 2).
Multilevel multivariate analysis of predictors on the perception of data quality among public health institutions in Gofa Zone, southern Ethiopia, 2023 (n = 304).

CI: confidence interval; DHO: district health office; HMIS: health management information system; Model 1: individual level variables; Mode1 2: institutional level variables; Model 3: both individual and institutional level variables.
Type of health institution
As compared with district health office, the data quality decreases in health post by −0.20 (95% CI = −0.371, −0.030, p < 0.05). “Data quality and institutional practices” was a theme that emerged from the interviews, where differences in routine data quality among health institutions and related challenges were discussed. The quality assessment practice of data collected or reported at lower-level health institutions (health posts) is lower than that at higher-level health institutions (district health offices). This finding is supported by the IDI interview, as exemplified below: “At the health post level, DQA is poor. However, at the health center level, it is mostly practiced, at about 90 to 95%. At the office level, we have a team of routine DQA, which often plans and conducts data assessment at the facility level.” (Head of district health office)
Information utilization culture
Every unit increase in information utilization culture increased data quality by 0.23 (95% CI = 0.195, 0.402, p < 0.001). In the theme “Habit of Data Use and Experience,” the qualitative informants explained their experiences and the rationale behind using routine health data for the decision-making process: For instance, one of the IDI informants explained the situation as follows: “We use data for different purposes. We collect and analyze data, ensuring its quality before presenting it for various decisions.” (Head of district health office)
Data management skill
Having data management skill improves the data quality by 0.103 (95% CI = 0.026, 0.180, p < 0.001). In the qualitative interview, “Skill-Related Perception in the Data Management Process” was a theme related to the data management skill construct. In this theme, the interview informants emphasized the importance of collective skills in data management for enhancing the quality of routine health data, as represented by the explanation below: “Currently, all other departments have become responsible for data management as we gradually improve our experience through practice. Therefore, the skills and initiative of all staff are important for achieving success on data quality.” (Head of MCH department)
Availability of electric power supply
When the health institution have an electric supply, data quality increases by 0.11 times (95% CI = 0.010, 0.211). In explaining the theme “Basic Infrastructure Used for HMIS Implementation,” the qualitative participants also highlighted technology infrastructure as a critical factor for streamlining health service delivery and improving the outcome. According to most participants, without access to electricity, it is impossible to install computers in health facilities, which means that automation cannot be achieved and, therefore, ensuring the quality of routine data is very difficult. “Electric access is the basic infrastructure required for the implementation of HMIS services. If the facility has access to electricity, it has a higher possibility of owning an HMIS computer. The availability of a computer is an important tool for automating routine service data and reporting systems.” (Head of OPD department)
Discussion
This study aimed to assess the level of data quality and associated factors in the RHIS. Data quality in terms of data accuracy, report completeness, data completeness, and timeliness was 89.4%, 96.2%, 93.5%, and 53%, respectively. The perceived level of good data quality was found to be 59.5%.
The report timeliness was found to be 53.3%. An almost similar finding was reported from public health centers of Addis Ababa in Ethiopia (56%). 38 But the result is lower than other studies conducted in Côte d’Ivoire (85%), 14 Harari region of Ethiopia (93.7%), 3 and the national report timeliness standard of Ethiopia (90%). 39 The possible explanation for the difference could be the availability of the remotest health facilities in this study area. Shortage of electric power supply (53.9%) and poor internet access (27.3%) in health institutions of this study could be other possible reasons for delayed reports. 40
Report completeness was 96.2% and data completeness was 93.5%. A similar finding of data completeness was reported in Harare (93%) 3 and Addis Ababa (93%) of Ethiopia. 41 However, the finding of data completeness is higher than the reports observed in Côte d’Ivoire (85%) 14 and Eastern Ethiopia (75.8%). 42 On the other hand, the report completeness of the study was also higher than that of a survey conducted in Southern Ethiopia (86%). 19 The possible reason might be that, in the current health system, the submission of reports is highly encouraged even after the due dates of the reporting schedule. In addition to this, recently, the monitoring and evaluation system of recording and reporting has been gradually improved. 43
The data accuracy of this study was 89.4%, which is consistent with the study conducted in Eastern Ethiopia (88.1%) 42 and Rwanda (94.7%). 44 But it is below the verification factor standard interval (0.90–1.10). 45 That means overreporting is a typical feature of this study. About 20.8% of the health institutions have overreported. Possible explanation for factors associated with over-reporting were that data are not documented or kept, incomplete source documents, manipulation of figures for competition, reporting false achievements, and lack of tools such as tally sheets, registers, guidelines, and standards.45,46
The perceived level of good data quality among health workers was 59.5%. An almost similar finding was reported in Addis Ababa of Ethiopia (57.9%). 47 However, the finding is lower than the study from Southern Ethiopia (83%). 19 The possible reason might be, in this study, the majority of the health workers (76%) did not receive training on RHIS. A shortage of program-specific supportive supervision (13.8%) and feedback, as well as limited data management skills of the staff, might be another reason for lower data quality. 48
Improving the habit of information utilization increased data quality by 0.23. A similar qualitative finding was reported in Northwest Ethiopia, where valuing data is an important facilitator to improve the quality of routine health data. 49 The more positive experiences a decision maker has in using information to support a decision, the stronger will be the commitment to improving the quality of routine data and data collection systems. 50 This strengthens the theoretical understanding of how attitudes toward data utilization affect data quality practices.
As compared with the district health office, the data quality was decreased in the health post by −0.20. Similar evidence was reported from the Harare Region of Ethiopia, where health centers were 2.5 times more likely to have good quality data as compared to the health posts. 3 A possible reason might be that most staff working in the lower levels of the health systems, involved in the HMIS process, have limited capacity in data quality management. 51 This is due to limited training on RHIS 5 and a shortage of program specific supportive supervision and assessment system for the RHIS in general and data quality in particular. 52 Therefore, a multilevel analysis approach advances theoretical knowledge by highlighting the variability of data quality outcomes across different contexts and institutions, which leads to more reliable conclusions of the associated factors.
Perceived skill of data management is a significant predictor of data quality. The finding is consistent with a study carried out in the Oromia regional state of Ethiopia 5 and in Northwest Ethiopia. 39 When the health workers have a required skill in the data management process, their confidence levels and motivation for reporting and recording of routine data improve, so that the performance of maintaining data quality increases. 11 This finding supports and extends existing evidence of how human factors, such as skills and confidence, influence data quality performance.
When a health institution has an electric power supply, data quality increases by 0.11 times. Similar evidence was reported from Dire Dawa City of Ethiopia. 53 Without the availability of electricity, there would be no chance of using DHIS2 software. 23 In a resource limited settings, expansion of electric power supply in health institutions enables reliable access to the routine data and timely dissemination of reports via offline or online DHIS2 reporting system that motivates the health workforce to maintain data quality. 54 This empirical evidence builds upon the knowledge of how infrastructural factors play a significant role in improving data quality performance.
Strength and limitation of the study
As a strength, the study employed a mixed methods approach. By applying complementary strengths and triangulation, a mixed-method approach can provide a more comprehensive understanding of the research question and improve the validity and reliability of the study findings. This study also applied a multilevel analysis approach, which allows for the modeling of variation at individual and health institution levels, capturing both within-group and between-group variability of data quality. In contrast, excluding privately owned health institutions limits the generalizability of the study findings only to the public health institutions, and the status of private facilities remains unknown. The primary limitation of cross-sectional studies is that determining the temporal relationship is difficult as the outcome and the exposure were measured at the same time. Small samples of health institutions were used to compute the proportion of data quality dimensions.
Conclusion
The level of data quality in RHIS in the public health institutions is found to be below the target of the national standard. Perceived skills of data management, culture of information utilization, availability of electric power supply, and types of health institutions were significantly associated with data quality. Improving the skill of data management for health workers, maintaining culture of data use in the health institutions, and expansion of the electric power supply in the health institutions are the potential interventions for assuring the quality of data in the RHIS. Enhancing the capacity of health extension workers at the health post level through the provision of training and maintaining data quality assessment practice were important actions for improving data quality at the health post level.
Supplemental Material
sj-docx-1-dhj-10.1177_20552076241297227 - Supplemental material for Assessment of data quality and associated factors in the routine health information system among health workers in public health institutions of Gofa Zone, Southern Ethiopia: A mixed methods study
Supplemental material, sj-docx-1-dhj-10.1177_20552076241297227 for Assessment of data quality and associated factors in the routine health information system among health workers in public health institutions of Gofa Zone, Southern Ethiopia: A mixed methods study by Bedilu Kucho Doka, Abebaw Gebeyehu Worku, Keneni Gutema Negeri and Dejene Hailu Kassa in DIGITAL HEALTH
Supplemental Material
sj-docx-2-dhj-10.1177_20552076241297227 - Supplemental material for Assessment of data quality and associated factors in the routine health information system among health workers in public health institutions of Gofa Zone, Southern Ethiopia: A mixed methods study
Supplemental material, sj-docx-2-dhj-10.1177_20552076241297227 for Assessment of data quality and associated factors in the routine health information system among health workers in public health institutions of Gofa Zone, Southern Ethiopia: A mixed methods study by Bedilu Kucho Doka, Abebaw Gebeyehu Worku, Keneni Gutema Negeri and Dejene Hailu Kassa in DIGITAL HEALTH
Footnotes
Acknowledgements
We would like to thank Hawassa University, College of Health and Medical Sciences, School of Public Health; former Southern National Nationalities and Peoples Regional Health Bureau and the funding organization, Doris Duke Charitable Foundation for giving us the opportunity to conduct this study.
Availability of data
The data sets utilized in this study are available from the corresponding author and provided on reasonable request of authorized personnel.
Contributorship
BKD conceived the study, designed the work, coordinated the data collection process, conducted statistical analysis, interpreted the data and wrote the manuscript. AGW, KGN, and DHK contributed to the conception and design of the work, analysis and interpretation of the data, and revision of the manuscript. DHK was the main advisor for the manuscript. All the authors have revised and approved the final version of the manuscript.
Declaration of conflicting interests
The authors declared no potential conflicts of interest with respect to the research, authorship, and/or publication of this article. The funding source has no role in data collection, analysis, and publication.
Ethical Approval
Ethical approval of the protocol for this study was received from the institutional review board of the College of Medicine and Health Sciences, Hawassa University, with the Reference Number of IRB/183/14 and date 08/06/2022. Official letter permission was received from the former Southern National Nationalities and Peoples Regional Health Bureau. Permission letters were also obtained from the Gofa Zone Health Department, District Health Offices, and each of the respective health facilities.
Funding
The authors disclosed receipt of the following financial support for the research, authorship, and/or publication of this article: The fieldwork of this study was supported by the Doris Duke Charitable Foundation granted through the Hawassa University project. The mission of the Doris Duke Charitable Foundation is to improve the quality of people’s lives through grants supporting the performing arts, environmental conservation, medical research and child well-being, and through preservation of the cultural and environmental legacy of Doris Duke’s properties.
Guarantor
BKD
Informed Consent
Informed written consent was obtained from each study participant. Information about the study purpose was provided to each participant and their anonymity and confidentiality of responses and right to withdraw were emphasized. All procedures were conducted based on their voluntary participation.
Supplemental material
Supplemental material for this article is available online.
References
Supplementary Material
Please find the following supplemental material available below.
For Open Access articles published under a Creative Commons License, all supplemental material carries the same license as the article it is associated with.
For non-Open Access articles published, all supplemental material carries a non-exclusive license, and permission requests for re-use of supplemental material or any part of supplemental material shall be sent directly to the copyright owner as specified in the copyright notice associated with the article.