
Abstract
Objective
The objective of this study was to assess the predictability of admissions to a MH inpatient ward using ML models, based on routine data collected during triage in EDs. This research sought to identify the most effective ML model for this purpose while considering the practical implications of model interpretability for clinical use.
Methods
The study utilised existing data from January 2016 to December 2021. After data pre-processing, an exploratory analysis revealed the non-linear nature of the dataset. Six different ML models were tested: Random Forest, XGBoost, CatBoost, k-Nearest Neighbours (kNN), Explainable Boosting Machine (EBM) using InterpretML, and Support Vector Machine using Support Vector Classification (SVC). The performance of these models was evaluated using various metrics including the Matthews Correlation Coefficient (MCC).
Results
Among the models evaluated, the CatBoost model achieved the highest MCC score of 0.1952, demonstrating superior balanced accuracy and predictive power, particularly in correctly identifying positive cases. The InterpretML model also performed well, with an MCC score of 0.1914. While CatBoost showed strong predictive capabilities, its complexity poses challenges for clinical interpretation. Conversely, the InterpretML model, though slightly less powerful, offers better transparency and is more practical for clinical use.
Conclusion
The findings suggest that the CatBoost model is a compelling choice for scenarios prioritising the detection of positive cases. However, the InterpretML model's ease of interpretation makes it more suitable for clinical application. Integrating explanation methods like SHAP with non-linear models could enhance model transparency and foster clinician trust. Further research is recommended to refine non-linear models within decision support systems, explore multi-source data integration, understand clinician attitudes towards ML, and develop real-time data collection systems. This study highlights the potential of ML in predicting MH admissions from ED data while stressing the importance of interpretability, ethical considerations, and ongoing validation for successful clinical implementation.
Introduction
Suicide and self-harm are global public health concerns with devastating consequences for individuals, families, and communities. 1 Approximately 5% of the adult world population have depression, 1 and approximately 700,000 people die by suicide each year. 1 In Australia, there was an average of nine deaths by suicide each day in 2021. 2 Many people seek initial, acute or emergency mental health (MH) assistance at their local hospital emergency department (ED) with recent research identifying three main themes that characterise help-seeking dynamics for MH conditions in ED: First Nations MH, suicidal ideation (SI), and access and egress pathways.3,4 EDs are busy environments populated by clinical, administrative, security, visiting staff (ambulance, police and other agencies), and with patients typically arriving by their own means, via ambulance, police, carers, or family. They are characterised with loud noise, bright lights, busy activity and usually open every day across the 24 h period. 5 ED staff frequently express feeling unequipped to provide care for MH patients, 5 with longer waiting periods common following arrival to ED for MH presentations 6 leading to dissatisfaction among many MH patients in ED. 7 For those unwell enough to require admission or transfer to an inpatient facility, the stay in the ED is generally more extended than those discharged from ED. 8 One potential approach to detect MH presentations earlier in the ED experience is to enhance the analysis and interpretation of regularly collected data pertaining to patient presentations in EDs. It involves the application of Machine Learning (ML), which has emerged as a powerful tool in healthcare, offering promising avenues for predicting significant risks such as suicide and self-harm.9–13 Therefore, the aim of this research is to assess the predictability of admissions to a MH inpatient ward using ML modelling from routine data collected at the point of triage in the ED.
However, the usage of ML is not without its challenges and ethical considerations. One of the crucial issues is the potential for bias in ML models when dealing with vulnerable populations and the possibility of producing further discrimination. 14 Ensuring transparency and interpretability of ML models is equally important, as it is essential for gaining support among clinicians and patients. 15 Previous research into the use ML in MH for the prediction of SI and self-harm behaviours has yielded positive results, for example, Reale, Novak 13 researched the development of an intervention that used predictive analytics to inform care teams about their patient's risk of suicide attempts. Iorfino, Ho 11 developed self-harm monitoring ML models, which helped identify a large subpopulation that would benefit from targeted interventions and helped identify factors that contribute to self-harming behaviours. Similarly, research has been undertaken into the use of ML for the prediction of admission by Hong, Haimovich 10 testing three different ML models in the ED setting that used a combination of triage and patient history data. Raita, Goto 12 tested four machine learning (ML) models that all outperformed the benchmark set in the study. The models were built to predict outcomes related to critical care and hospitalisation, and improved clinicians’ decision-making process. 12 In a recent systematic review of clinical decision support systems (CDSS) in ED, Fernandes, Vieira 9 reported that the use CDSS improved decision-making by health professionals and led to better clinical management and patient outcomes. However, Fernandes, Vieira 9 go on to state that more than half of the studies lacked clear implementation and performance measures. Contrasting the previous studies, this research will use a minimal dataset collected at the point of entry to the ED where only triage diagnostics have occurred. This study seeks to determine if basic presentation information can be used to predict the need for admission to an acute inpatient unit. However, recent research has demonstrated the reluctance of clinicians to trust ML due to the inability to understand the underlying mechanisms of the prediction.15,16 This research will test six different ML models, including interpretable ML (InterpretML using Explainable Boosting Machine (EBM) is a tree-based, cyclic gradient boosting Generalized Additive Model) and traditional models such as Support Vector Machine using Support Vector Classification (SVC) with Radial Bias Function Kernel.
Importance of trust and transparency
Trustworthiness in ML innovations is a priority for governments, researchers and clinicians; however, trust and confidence have been highlighted as significant barriers to the acceptance of ML within a clinical setting. 15 The exclusive emphasis on demonstrating trust without ensuring reliability and validity during practice may lead to negative experiences for clinical users and hinder acceptance. 16 It is essential that ML interventions be described in terms of competence, reliability and validity as would be expected of other clinical tools where the quality of care and the safety of a person are the highest priority. 16 Clinicians should be presented with treatment recommendations that describe the validity and confidence of prediction, with the final decision for care always made by a clinician. 16
Method
This study utilises a retrospective cohort analysis 17 combined with predictive modelling using ML techniques 18 and aims to assess the predictability of MH inpatient admissions using various ML models. The study was conducted in two public EDs within the Central Coast Local Health District of New South Wales, Australia. The population and sample included all ED presentations where a MH issue was recorded as the primary presenting problem. The primary data collection for this study involved reviewing existing records from January 1, 2016, to December 30, 2021 resulting in an initial dataset of 26,681 records. Missing records in this dataset were determined to be missing completely at random (MCAR), and the standard listwise deletion approach was applied. 19 This method led to the removal of 515 rows and reduced the final dataset to (n = 26,166) records. A second round of data collection was conducted to determine if the patient's presentation was linked to current or past treatment with the service, which is referred to as “MH history” in the research. The study received ethical approval from the Hunter New England Human Research Ethics Committee, under the reference number 2022/ETH01597, on November 18, 2022. Additionally, site-specific approval was obtained from the Central Coast Local Health District on December 14, 2022. The requirement for informed consent to participate has been waived by the Hunter New England Human Research Ethics Committee, where it has been deemed that consent would be impossible or impracticable to obtain. The initial data investigation used SQL, Python, Excel, and Seaborne. 4 Data were cleaned, and missing data was handled as per. 4 Further information on the data collection and extraction methods can be found in 4 and exploratory analysis of the data. 4 Pearson's correlation coefficient 20 was used to determine the lineal/nonlinear nature of the data, the correlation coefficient and linear regression r-squared with a lineal/non-linear tolerance set at 0.01. The tolerance value represents the minimum threshold for the R-squared value of the linear regression model to be considered as indicating a linear relationship. 20 The R-squared value measures the proportion of the variance in the dependent variable explained by the independent variable(s). If the R-squared value is above the specified tolerance threshold, the code concludes that the relationship is linear; otherwise, it is considered non-linear. The resulting test concludes that the dataset is non-linear in nature due to the small number (11/120) of correlations.
This research will test six different types of ML models, Random Forest, XGBoost, CatBoost, k-Nearest Neighbours (kNN), Explainable Boosting Machine (EBM) as InterpretML, and Support Vector Machine using Support Vector Classification (SVC) with Radial Bias Function Kernel to provide a comprehensive evaluation due to the inherent differences in their underlying methodologies, strengths, and limitations. This approach ensures that various aspects of the data and the problem are addressed, leading to a more robust and well-rounded understanding of overall model performance in the context of the research.
Random forest
Random Forest is an ensemble learning method primarily used for classification and regression tasks. Developed by Breiman, 21 it constructs a multitude of decision trees during training and outputs the mode of the classes for classification or the mean prediction for regression. Each tree in the forest is built using a subset of the data and a subset of features, which helps to ensure that the trees are not highly correlated. The randomness introduced in the selection of data samples and features leads to model diversity, thereby improving the overall prediction performance and robustness against overfitting compared to a single decision tree. 22 The algorithm works by splitting nodes in each decision tree using the best among a subset of predictors randomly chosen at that node. This random selection of features leads to a decrease in variance without increasing bias, resulting in a model that performs well on unseen data. The method's efficiency and accuracy in handling large datasets and its ability to model complex interactions make it a popular choice in various applications, including healthcare and finance. 23
XGBoost
XGBoost, or eXtreme Gradient Boosting, is an efficient and scalable implementation of gradient boosting frameworks. 24 It is designed to be highly efficient, flexible, and portable. The model builds trees sequentially, where each new tree corrects the errors made by the previous ones. This iterative process aims to minimise a loss function by using a gradient descent algorithm. XGBoost incorporates a regularisation term in its objective function, which helps prevent overfitting, making it a robust choice for both classification and regression problems. It also supports parallel and distributed computing, which significantly speeds up the learning process, making it suitable for large datasets. Additionally, XGBoost provides functionalities for cross-validation and automatic handling of missing data, further enhancing its versatility and application in a wide range of ML tasks. 25
Catboost
CatBoost is another gradient boosting framework that stands out for its ability to handle categorical features natively. 26 Traditional ML algorithms often require categorical variables to be converted into numerical values, which can lead to information loss. CatBoost, developed by Yandex, addresses this by using an ordered boosting process and incorporating category-specific transformations to capture the information contained in categorical features effectively. 26 The model uses an innovative method of calculating leaf values during the boosting process, which helps in reducing the prediction shift caused by biased leaf value estimation. CatBoost's ability to handle categorical data without preprocessing steps, along with its robust regularisation techniques, make it a powerful tool for a variety of applications, including those with structured and unstructured data. 27
k-Nearest neighbours (kNN)
The k-nearest neighbours (kNN) algorithm is a simple, yet effective, instance-based learning method used for classification and regression. Proposed by Cover and Hart in 1967, 28 it is a non-parametric method that predicts the output for a query instance based on the majority class (for classification) or average outcome (for regression) of its k nearest neighbours in the feature space. One of the primary advantages of kNN is its simplicity and ease of implementation. However, it can be computationally expensive for large datasets because it requires calculating distances between the query instance and all other points in the dataset. Moreover, kNN is sensitive to the local structure of the data and the choice of k, where a small k can lead to overfitting, while a large k may result in underfitting. Despite these challenges, kNN is widely used in various fields, including pattern recognition, data mining, and image processing, due to its effectiveness in scenarios where the data distribution is unknown. 29
Interpretml
InterpretML 30 is a framework for creating interpretable models that can assist clinicians with making informed decisions about patient care using algorithms such as Explainable Boosting Machine (EBM), a tree-based, cyclic gradient boosting Generalized Additive Model (GAM). Traditional ML models, such as deep neural networks, can be very accurate but are often considered “black boxes” because it can be challenging to understand how they arrive at their predictions. 31 This lack of transparency can be an obstacle in healthcare, where patients have the right to understand decision-making. 32 InterpretML allows visualising models and their predictions via feature importance, partial dependence, and individual conditional expectation plots. 33 These plots can help identify the impact of each feature on the outcome and areas for improvement. 32 For additional information pertaining to the use of InterpretML on this dataset, please refer to. 34
Support vector machines for classification
Support Vector Machines (SVM) are ML algorithms that can be used for classification, regression and clustering.35–37 In the case of two-class classification, SVMs’ fundamental goal is to establish a hyperplane that maximises the margin of separation between the two classes, taking noise and outliers into account. By using kernel functions SVMs can produce non-linear decision boundaries and, with a suitable kernel, can also handle non-vectorial data. Due to their training based on constrained optimisation they can be applied also in cases where little data is available. This makes them a versatile tool for analysing the often relatively small but complex datasets that can be encountered in healthcare research. This research will use an SVM for classification using the SVC with a Radial Bias Function Kernel.
Data description
The ED presentations related to MH and suicidal behaviour between January 1, 2016, and December 30, 2021. The ED data were selected based on specific terms in the presenting problem, such as ‘%suici%’, ‘%MH%’, ‘%self harm%’, ‘%psych%’, or ‘%Mental%’. Additionally, data from electronic medical records were extracted to link the ED presentations with MH service data, indicating whether the individual received current or previous care. The dataset contained the following features: age, active/previous service user, presenting problem, facility identifier, first nations status, source of referral, marital status, model of arrival, gender, triage category, time of the day, day of the week, month, referred to on departure (including admission) and mode of separation.
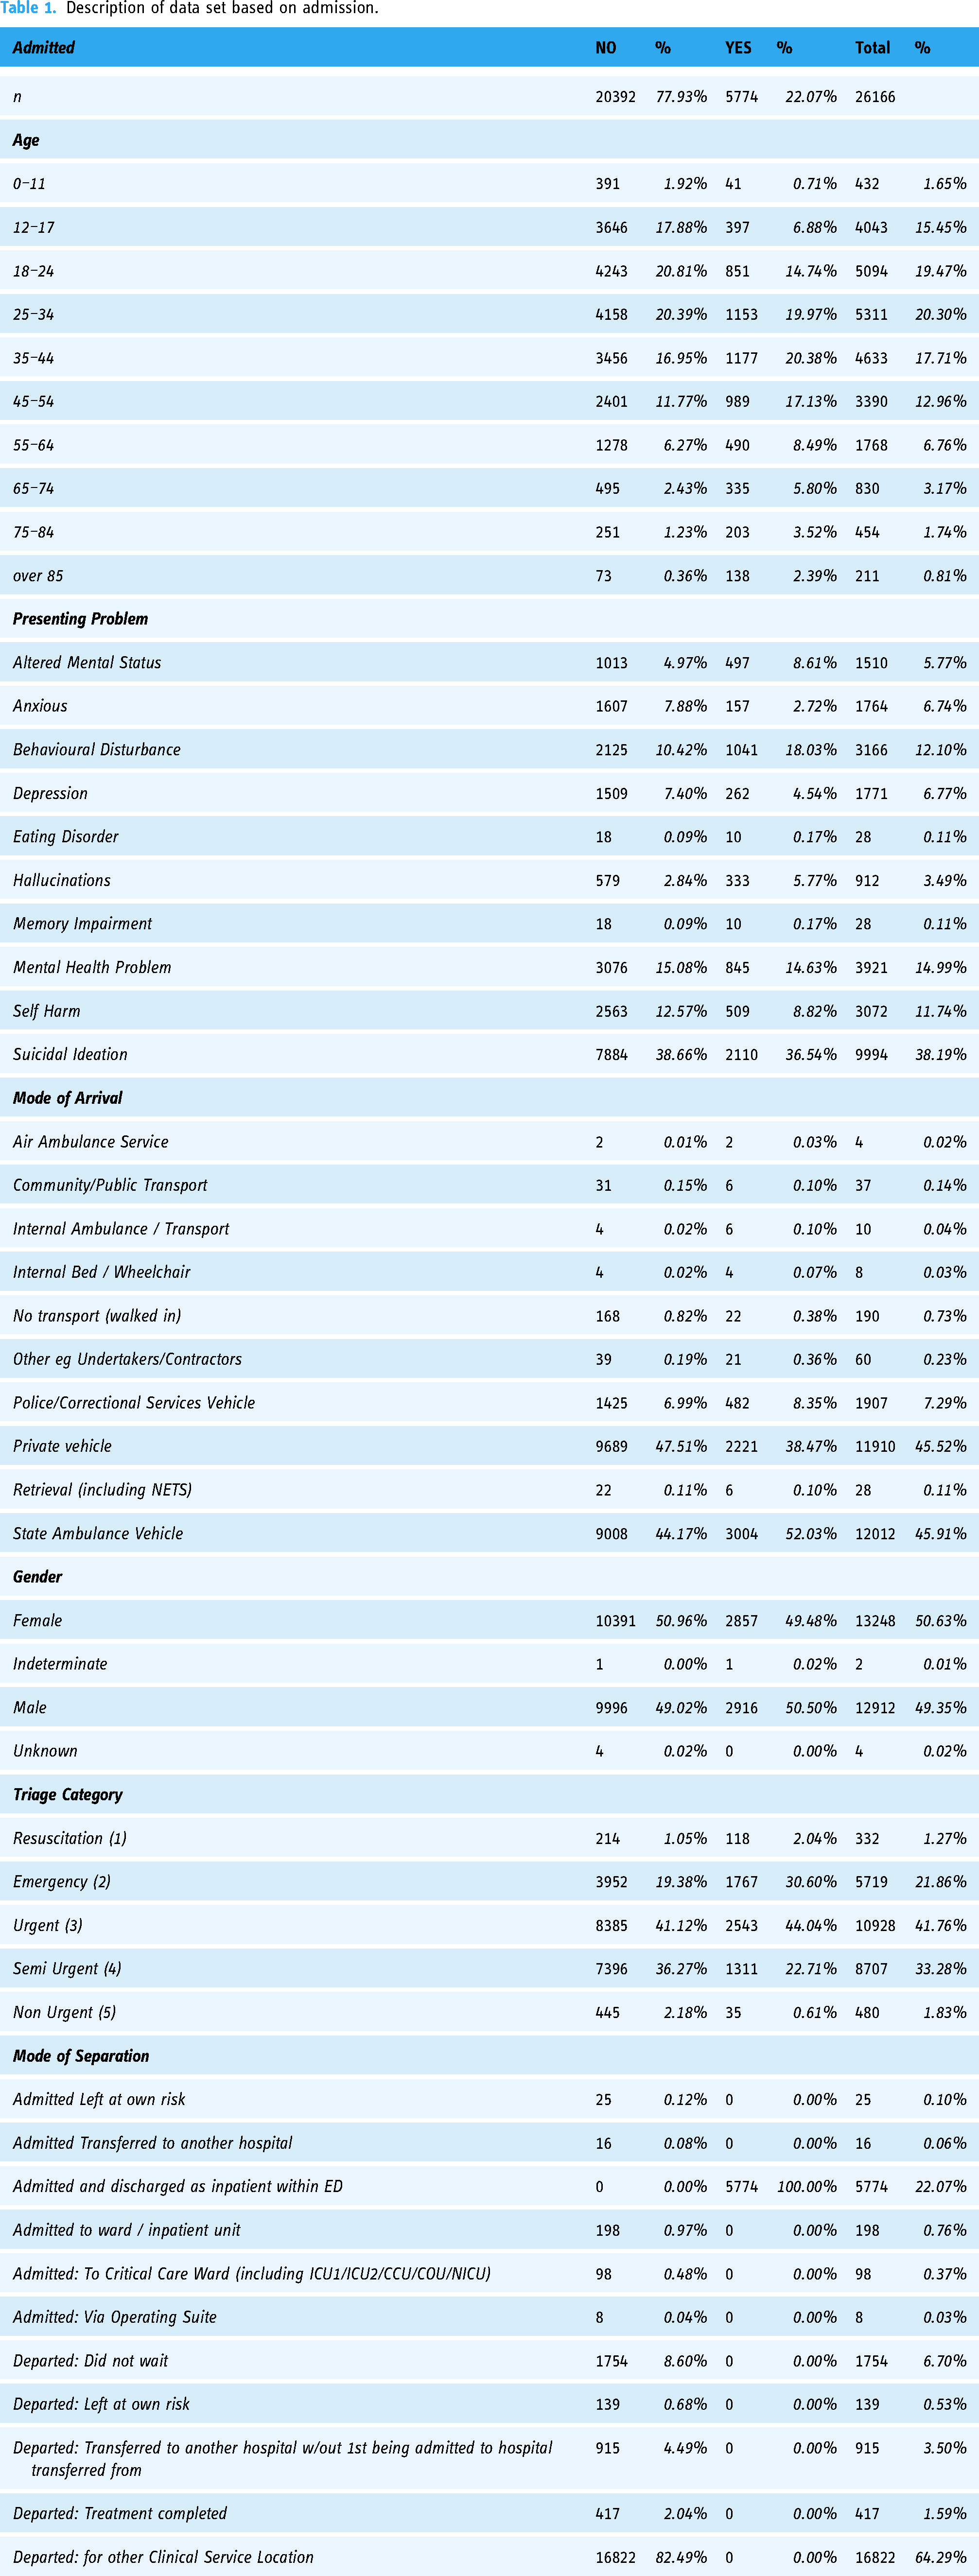
The extracted dataset contained 26,681 records, with a relatively small proportion of missing data for various variables, such as ED source of referral, mode of separation, marital status, mode of arrival, and referred to on departure. Although small amounts of missing data can impact study results, the missing data in this case were considered missing completely at random (MCAR). The most straightforward approach, listwise or case deletion, was employed, resulting in the removal of entire missing records from the dataset. This approach reduced the final record count to 26,166, with a loss of 515 records (1.93%). 34 The final data set contained 26,166 records of people who presented to ED with MH as their primary presenting problem; however, there was a significant class imbalance in the target of admission (Yes, n = 5774, No, n = 20392). The baseline characteristics for these presentations are described in Table 1.
Description of data set based on admission.
Data transformations for modelling
The following steps were taken to prepare the data set for ML modelling. Logarithmic transformation was applied to the data to calculate the natural logarithm of each element, allowing for a compressed range of values. 38 The logarithmic transformation process is used to address issues related to skewed data distributions and variations in magnitude and is required when handling variables with varying dynamic ranges. 38 The pandas function pd.get_dummies() is employed with the pandas DataFrame 39 to perform one-hot encoding on categorical variables. This transformation results in the creation of binary columns indicating the presence or absence of specific categories within the original dataset. Notably, the parameter drop_first = True is specified, leading to the exclusion of one dummy column for each categorical variable to mitigate multicollinearity concerns. Scaling was performed using Standard Scaler from scikit-learn to standardise specific columns using to_scale within the pandas DataFrame. The fit_transform method is applied, wherein the scaler computes the mean and standard deviation necessary for standardisation and then transforms the selected columns. This process ensures that the numerical features in the specified columns have a standardised distribution with zero mean and unit variance. 39 A test/train split was executed using the train_test_split function from scikit-learn, with a specified test size of 20%. This division allocates 80% of the data for training the model and reserves the remaining 20% for evaluating the model's performance on unseen data. The choice of a 20% test size is a common practice in model evaluation. 39 This strategic split allows for robust training and assessment of the model's generalisation capabilities, providing valuable insights into its performance on new, previously unseen observations. 40 To address the class imbalance in the dataset, the RandomOverSampler from the imbalanced-learn library was employed with the parameter sampling_strategy='minority’ after the test, train split to ensure that the oversampled data is not present in the test dataset, which is not appropriate for testing the model and leaves the final testing data unchanged. This oversampling technique focuses on the minority class, generating synthetic samples to balance the class distribution. 41 The fit_resample method is then applied to the feature matrix and target variable, efficiently handling the oversampling process. Implementing random oversampling on the minority class mitigates the impact of class imbalance, preventing model bias towards the majority class and enhancing overall predictive performance. 41
Machine learning models
Given the previous indication of the nature of the lineal data, it was decided to train both linear and non-linear models on the data and compare their performance. Models were built using InterpretML and SVC, GridsearchCV was used to establish parameters, with the resulting models being evaluated using F1, recall (sensitivity), precision, a confusion matrix, receiver operating characteristic (ROC), negative predictive value (NPV), false positive rate, false discovery rate, and false negative rate. A confusion matrix is used in classification problems to evaluate the performance of a machine-learning model by summarising the outcomes of predictions 39 and represents the number of correct and incorrect predictions made by the ML model being tested. The matrix has four main components: True Positive (TP), which is an instance where the model correctly predicts the positive class; True Negative (TN), instances where the model correctly predicts the negative class. False Positive (FP), instances where the model incorrectly predicts the positive class (Type I error), and False Negative (FN), instances where the model incorrectly predicts the negative class (Type II error). 42 The confusion matrix is useful for understanding the model's performance across different classes by providing insights into the model's strengths and weaknesses. Performance metrics such as accuracy, precision, recall (sensitivity), specificity, and the F1 score can be derived from these values. 39 The ROC curve is a graph that displays the relationship between the recall (sensitivity) and the false positive rate of a model for different probability thresholds. 42 Recall also referred to as sensitivity or true positive rate (TPR), measures the proportion of actual positive instances correctly identified by the ML model. In contrast, the false positive rate (FPR) represents the ratio of negative instances incorrectly classified as positive. The ROC curve is plotted by comparing the TPR against the FPR at different threshold values. 42 A perfect model would have a ROC curve that reaches the top-left corner of the graph (TPR = 1, FPR = 0), while an ineffective model would produce a curve close to the diagonal line (45-degree angle). 39 AUC-ROC (Area Under the ROC Curve) is a numerical metric that summarises the model's overall performance in distinguishing between positive and negative classes. A higher AUC-ROC indicates better model performance. 39 ROC curves and AUC-ROC are commonly used to assess model performance, especially in situations such as health care where sensitivity and specificity are both important.
Working with healthcare data presents several challenges, such as siloing, segmentation, privacy ethics, and health policy. 43 Compared to other sectors, such as finance, there are limitations on the size of the data available for use in healthcare. The data used in this study presents similar issues and only represents a small portion of presentations to the ED and lacks the depth of clinical narrative that is present in the wider system. This dataset's limited number of records poses a significant challenge for machine ML techniques, which typically perform better with larger datasets. However, this limitation is outweighed by the critical importance of accurate prediction in the MH ED context, where misclassifications can have severe consequences for patient well-being and safety. False negatives, where patients in need of admission are missed, can result in delayed treatment, worsening of conditions, or even life-threatening situations. False positives, where patients are incorrectly identified as requiring inpatient admission, can lead to unnecessary hospitalisations, increased healthcare costs, and potential emotional distress for patients and their families. Clinicians and developers must carefully balance these risks and consider the potential consequences of each type of misclassification. In practice, clinicians are trained to prioritise caution over taking risks, as the consequences of missing a patient in need of intensive treatment can be far more severe than the inconvenience and costs associated with an unnecessary admission. In this context, the use of specificity as an evaluation metric becomes more relevant than precision. While precision measures the proportion of correct positive predictions, specificity measures the proportion of negative instances that are correctly identified. 42 In the MH ED setting, where false negatives are particularly concerning, specificity provides a more direct assessment of the model's ability to identify patients who do not require inpatient admission accurately. Specificity measures the proportion of true negatives that are correctly identified by the model, demonstrating the ability of the model to accurately identify patients who do not require inpatient admission. A high specificity value is indicative that the model is effective at correctly identifying and filtering out negative cases (those who can be safely discharged or treated in the community). The ROC curve offers a powerful tool for clinicians to evaluate and select appropriate classification models for the MH ED context. By plotting the true positive rate (sensitivity) against the false positive rate (1 - specificity) for classification thresholds, the ROC curve allows clinicians and developers to visualise the model's ability to correctly identify positive cases (patients requiring admission) and its tendency to generate false positives. By carefully considering the ROC curve and the associated trade-offs, clinicians and developers can select a classifier that balances the risks of false positives and false negatives in a manner that aligns with their clinical objectives and the specific context of the MH ED.
Results
The performance of ML models in healthcare is critical, as these models assist in clinical decision-making by predicting patient outcomes. In evaluating the six ML models (EBM InterpretML, Random Forest, XGBoost, CatBoost, k-Nearest Neighbors (kNN), and Support Vector Machine using Support Vector Classification (SVC) with Radial Bias Function Kernel) a variety of metrics are utilised, including accuracy, AUC-ROC, precision, recall, F1 score, specificity, NPV, false positive rate, false discovery rate, false negative rate and Matthews Correlation Coefficient (MCC). The overall results can be found in Table 2, with the overall classifier accuracy demonstrated in Figure 1 and the overall classifier ROC comparison is in Figure 2. The following section breaks down the performance of each classifier model performance.

Classifier accuracy.

Classifier ROC.
Model performance.
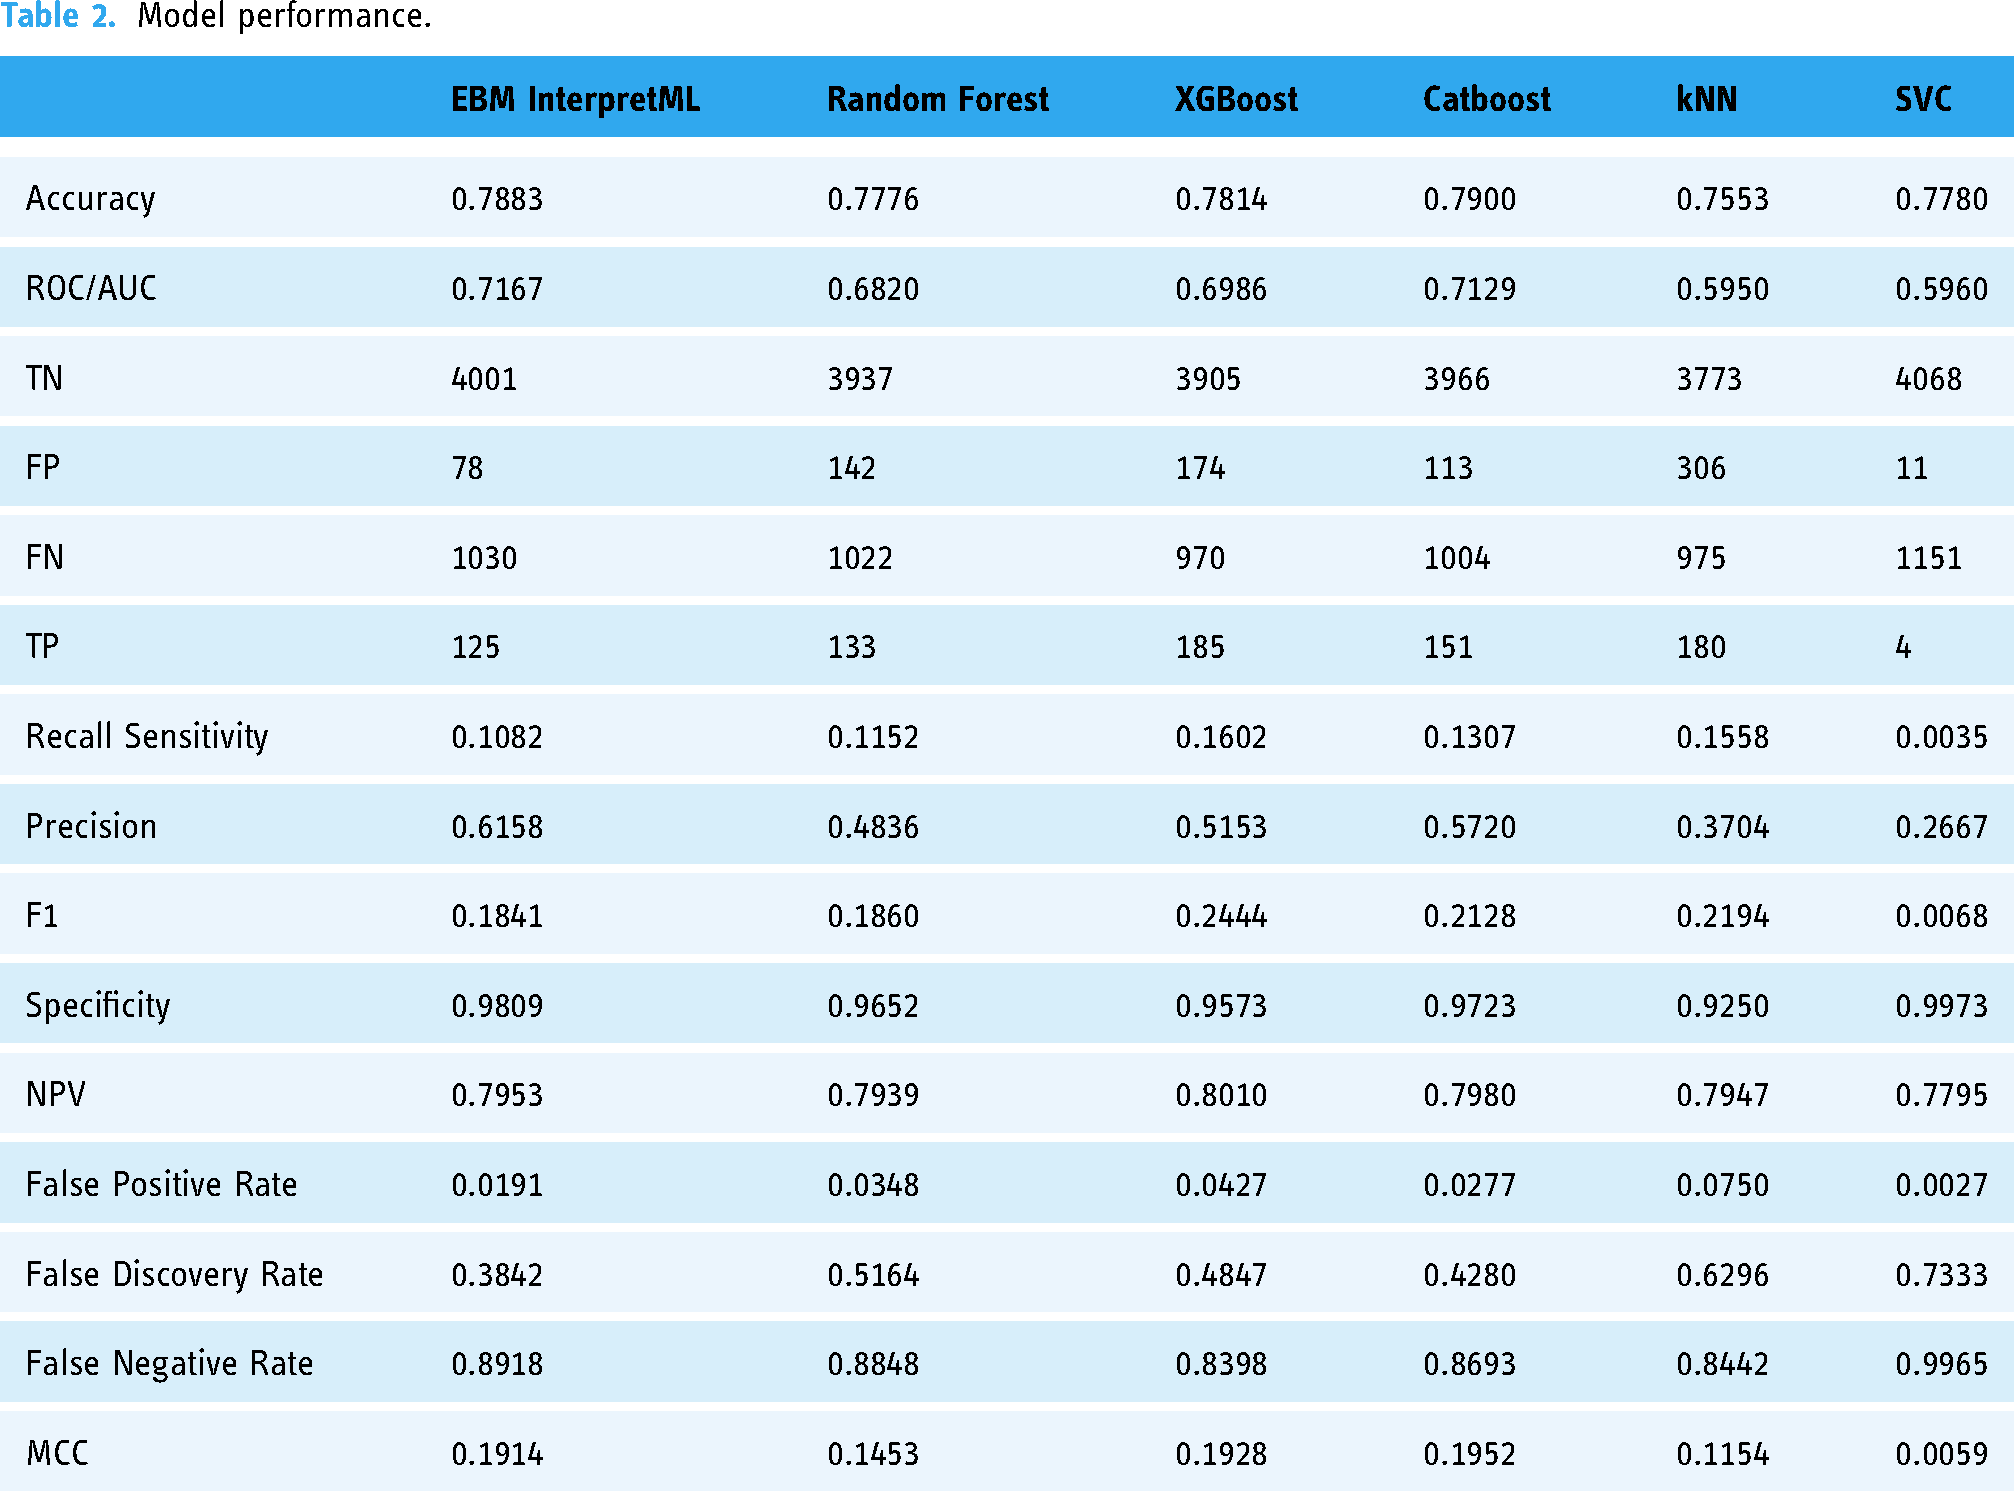
EBM InterpretML achieves an accuracy of 0.7883, MCC of 0.1914 and a ROC/AUC of 0.7167 (Table 2, Figures 3 and 4), indicating moderate discriminative power. The model shows a recall of 0.1082 and a precision of 0.6158, reflecting a relatively low sensitivity but moderate precision. The F1 score of 0.1841 indicates a need for improvement in balancing recall and precision. The model's specificity of 0.9809 suggests excellent performance in identifying true negatives, while the false positive rate is low at 0.0191. However, the false discovery rate is 0.3842, and the false negative rate is high at 0.8918, pointing to challenges in correctly identifying positive cases.
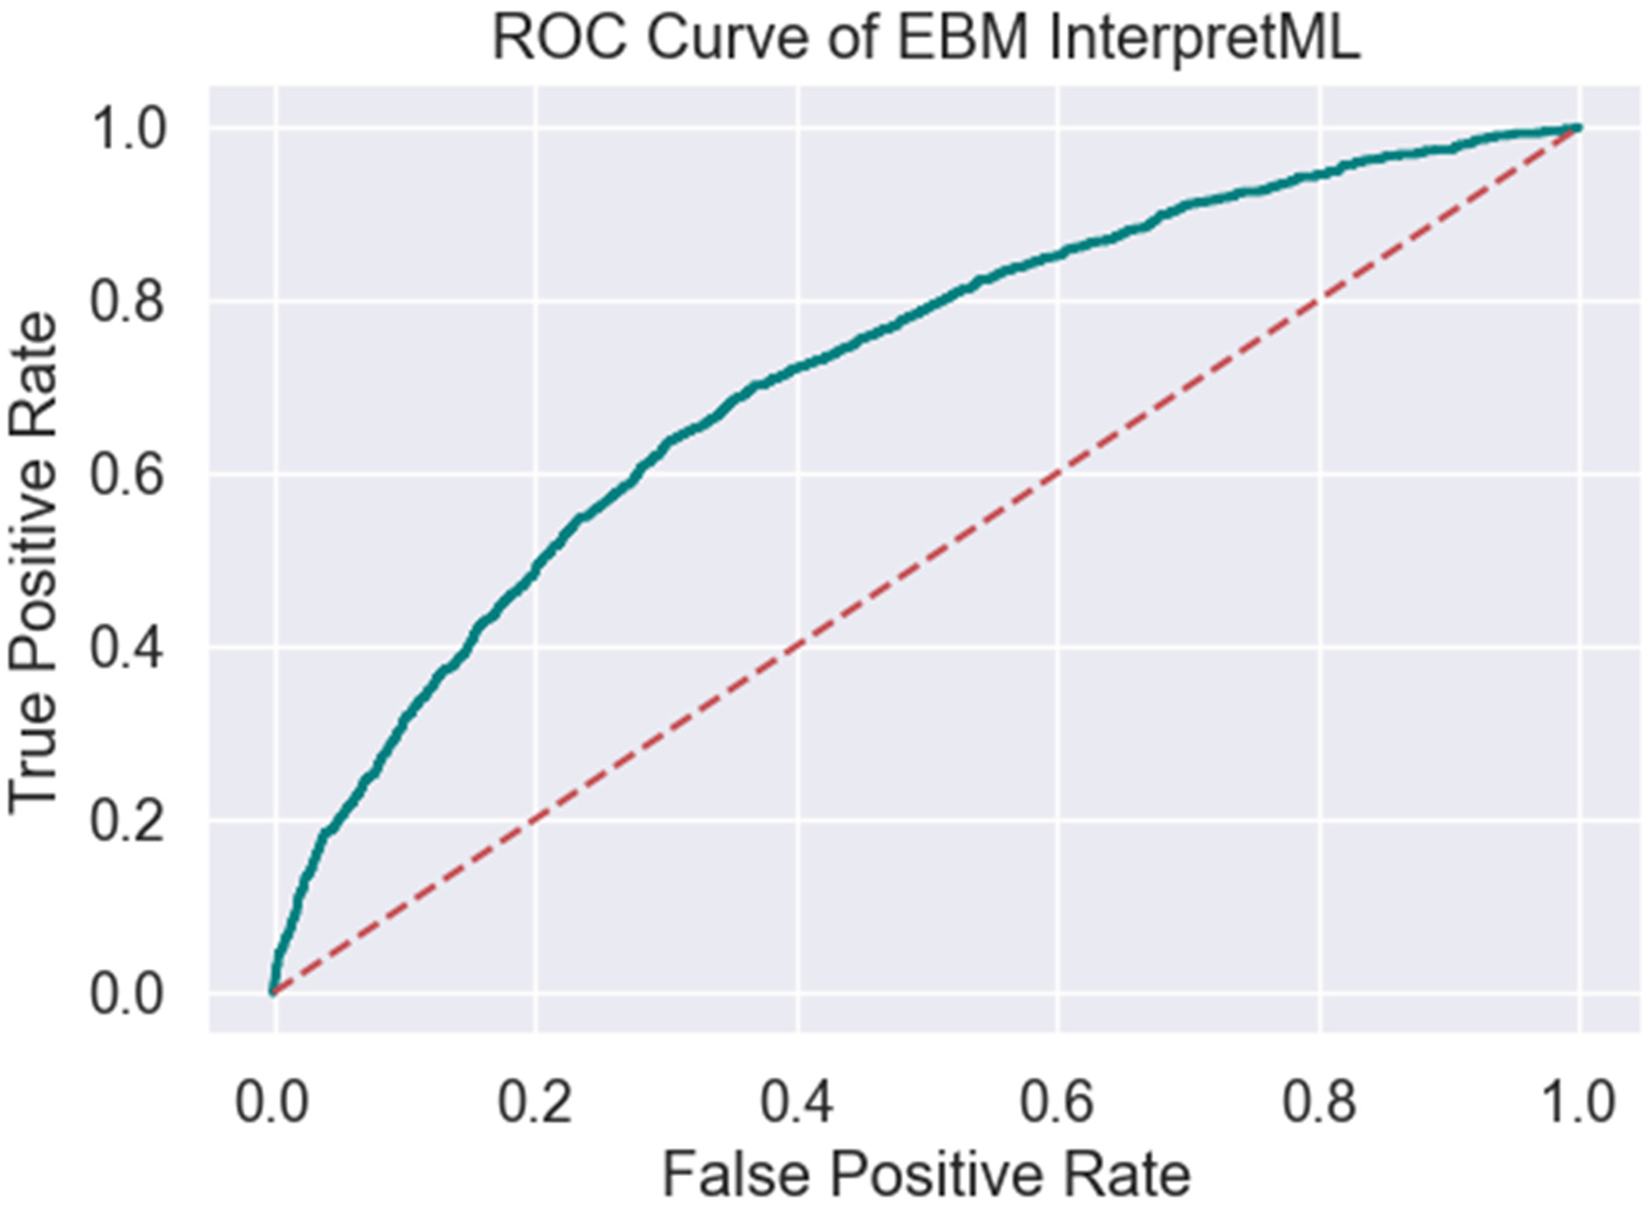
ROC of EBM interpretML.

Confusion matrix of EBM interpretML.
Random Forest presents a slightly lower accuracy of 0.7776, MCC of 0.1453 and a ROC/AUC of 0.6820 (Table 2, Figures 5 and 6). It achieves a recall of 0.1152 and a precision of 0.4836, resulting in an F1 score of 0.1860. The specificity is 0.9652, demonstrating good capability in correctly identifying true negatives, although the false positive rate is slightly higher at 0.0348. The false discovery rate of 0.5164 and the false negative rate of 0.8848 indicate a significant number of misclassified positive cases.

ROC random forest.

Confusion matrix of RF.
XGBoost shows an accuracy of 0.7814, MCC of 0.1928 and a ROC/AUC of 0.6986 (Table 2, Figures 7 and 8). The model's recall is 0.1602, and its precision is 0.5153, leading to an F1 score of 0.2444. Its specificity is 0.9573, with a false positive rate of 0.0427. The false discovery rate is 0.4847, while the false negative rate is 0.8398, reflecting moderate challenges in detecting true positive cases.
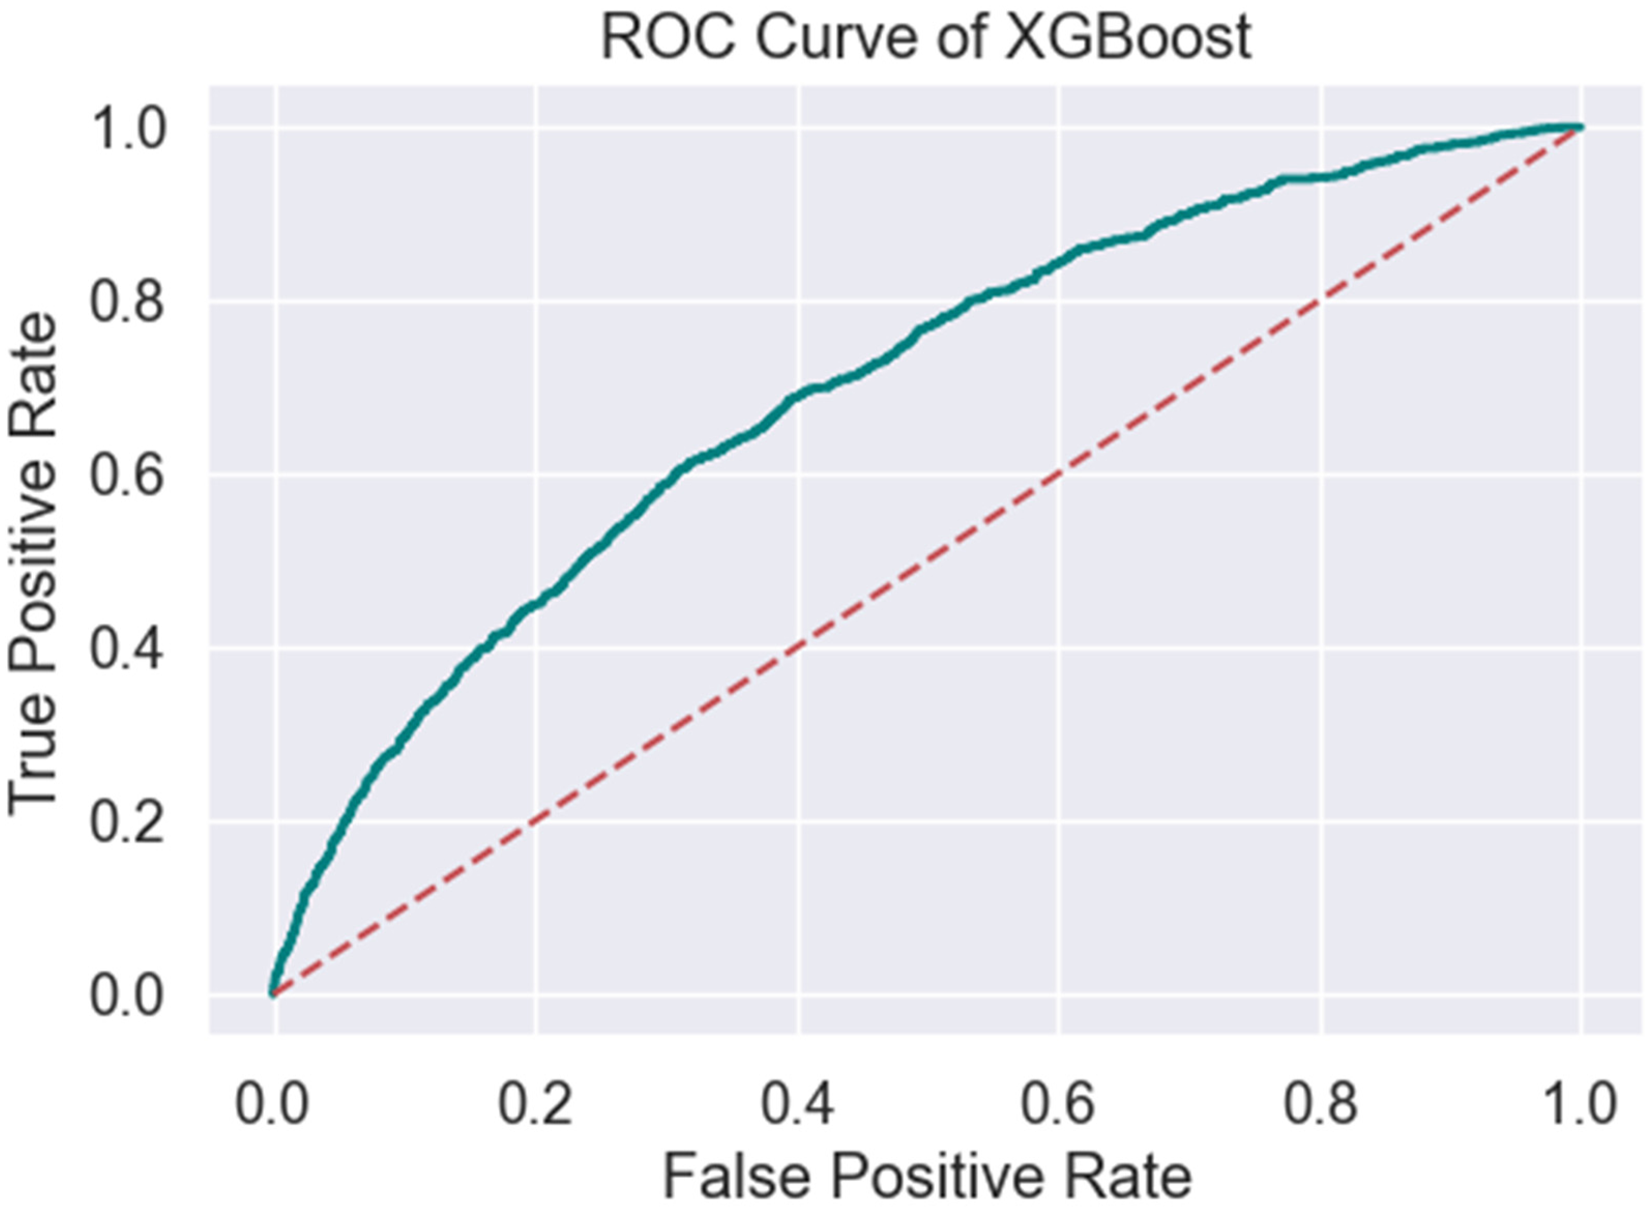
ROC XGBoost.
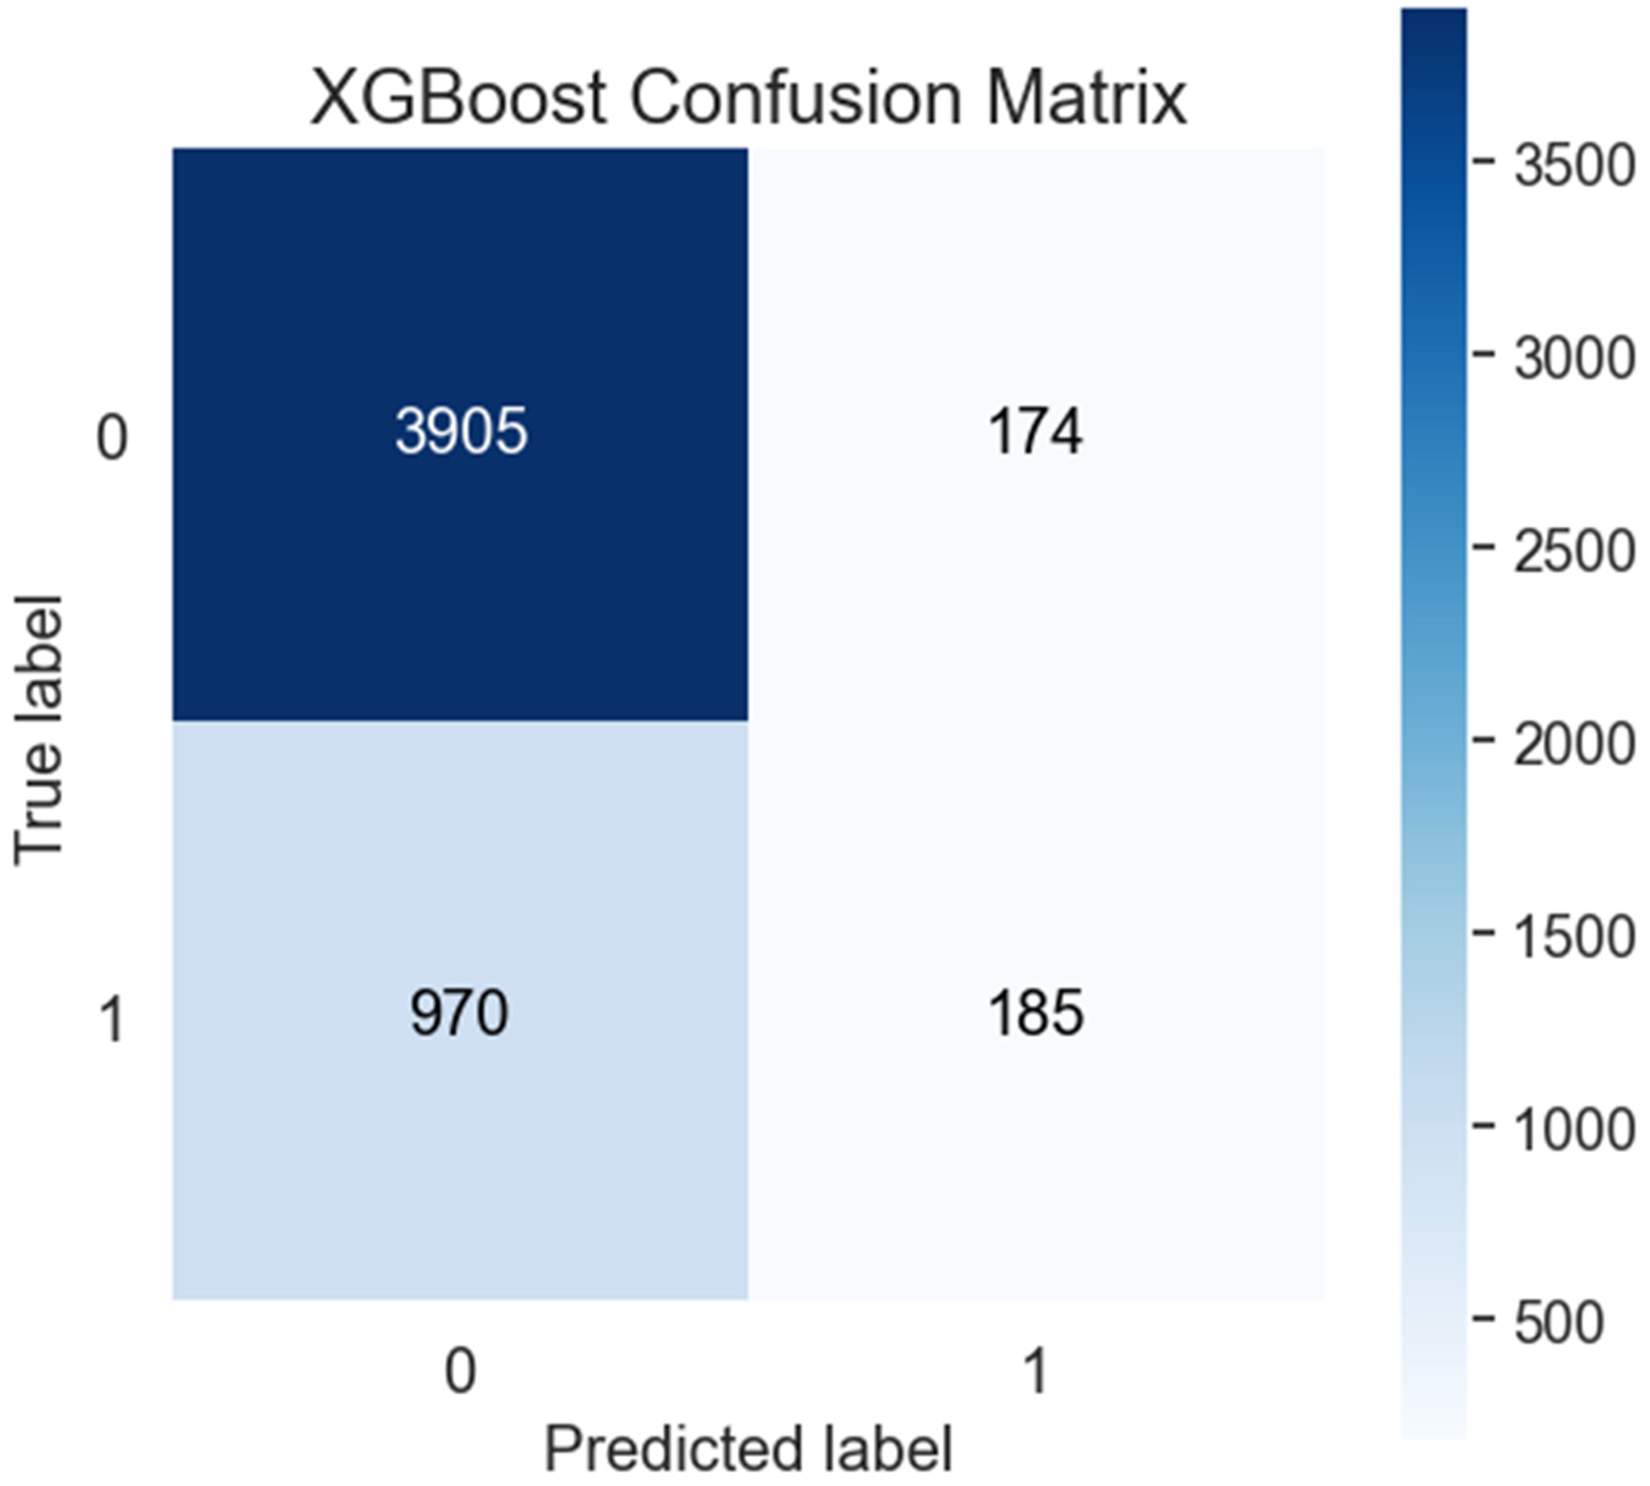
Confusion Matrix of XGBoost.
CatBoost stands out with the highest accuracy of 0.7900, and MCC of 0.1952 and a ROC/AUC of 0.7129 (Table 2, Figures 9 and 10), indicating superior overall performance. Its recall is 0.1307, and precision is 0.5720, resulting in an F1 score of 0.2128. The specificity of 0.9723 and the false positive rate of 0.0277 are commendable, showing a low rate of false positives. However, the false discovery rate is 0.4280, and the false negative rate is 0.8693, indicating room for improvement in positive case detection.
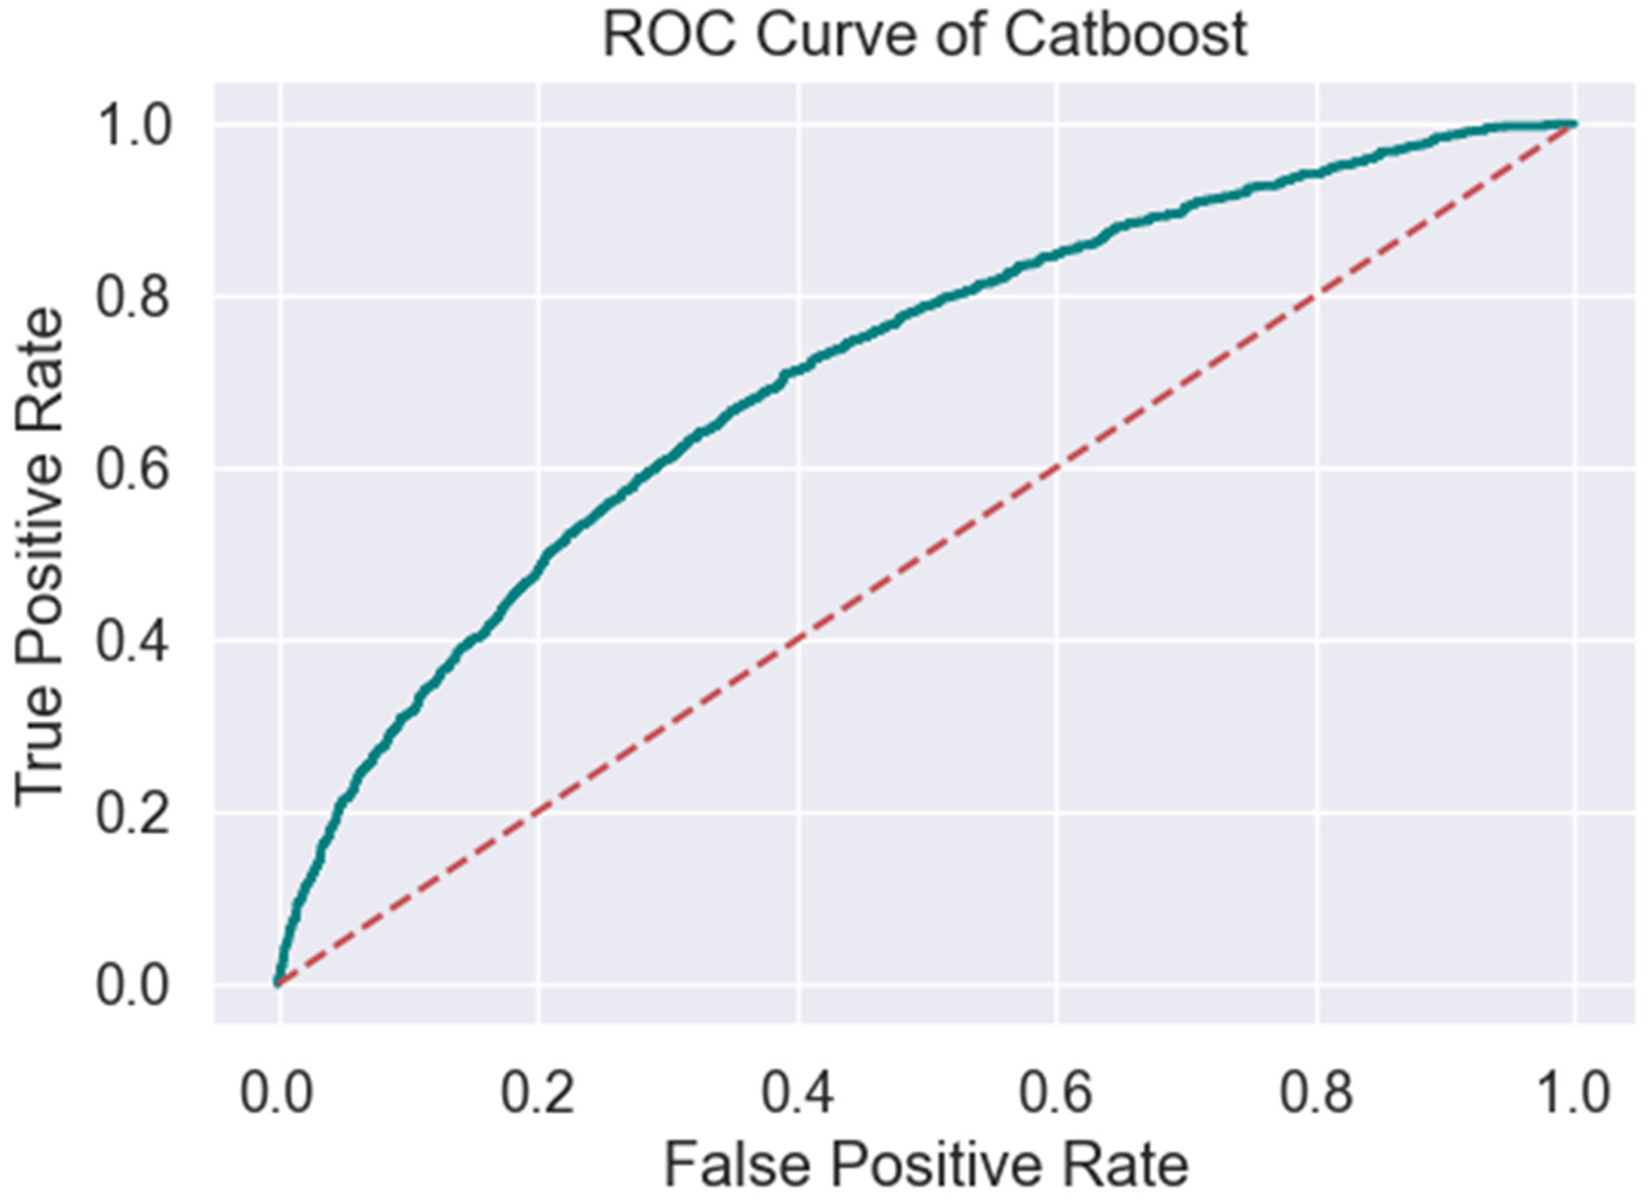
ROC CatBoost.

Confusion matrix of CatBoost.
k-Nearest Neighbours (kNN) has an accuracy of 0.7553, MCC of 0.1154 and an ROC/AUC of 0.5950 (Table 2, Figures 11 and 12), the lowest among the models evaluated. The recall is 0.1558, and precision is 0.3704, resulting in an F1 score of 0.2194. The specificity is 0.9250, with a higher false positive rate of 0.0750. The model also exhibits a high false discovery rate of 0.6296 and a false negative rate of 0.8442, indicating substantial issues in identifying positive cases.

ROC kNN.

Confusion matrix of kNN.
Finally, the SVC model, with an accuracy of 0.778, MCC of 0.0059 and an ROC/AUC of 0.5960 (Table 2, Figures 13 and 14), presents unique characteristics. It achieves a recall of only 0.0035, indicating a very low sensitivity, and a precision of 0.2667, resulting in a minimal F1 score of 0.0068. However, the specificity is extremely high at 0.9973, and the false positive rate is very low at 0.0027, suggesting the model is highly conservative in identifying positives. The false discovery rate is 0.7333, and the false negative rate is 0.9965, reflecting severe challenges in positive case detection.

ROC of SVC.
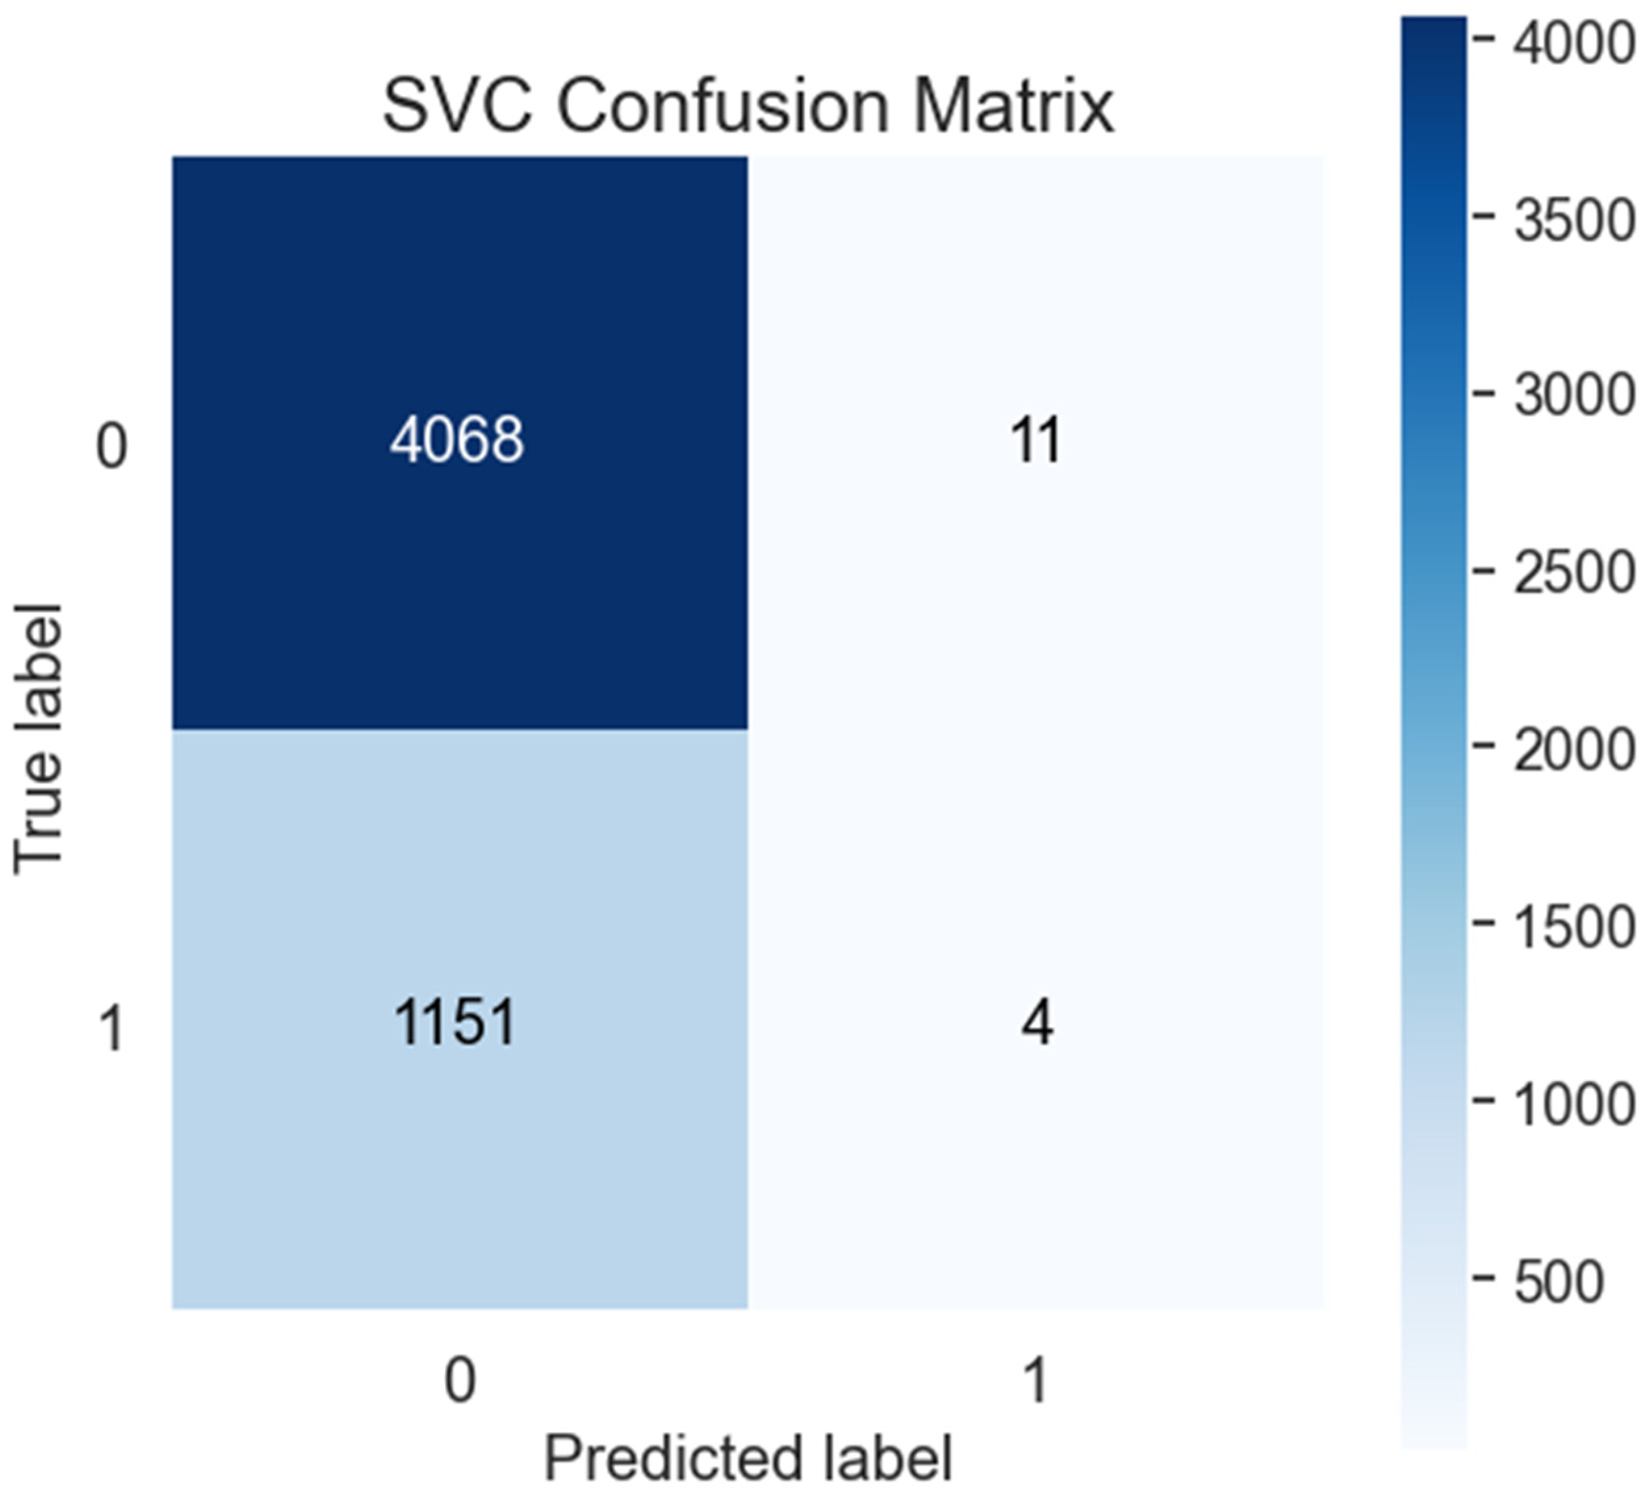
Confusion matrix of SVC.
Discussion
CatBoost emerges as the model with the highest accuracy and balance between recall and precision, although improvements are needed in positive case detection. Models like EBM InterpretML and Random Forest demonstrate good specificity but struggle with recall and false negatives, which are critical in healthcare applications, however unlike Random Forest, EBM InterpretML does offer the ability to provide further insight into its recommendation, making it suitable for general healthcare applications where transparency is as important as the prediction provided. The comparison between the EBM InterpretML, CatBoost, and Random Forest models illustrates the trade-offs between interpretability and predictive performance in healthcare applications. EBM InterpretML exhibits a moderate level of accuracy at 0.7883, with a balanced distribution between true positives and false positives, indicating moderate effectiveness in both positive and negative predictions. Its primary advantage lies in its interpretability, making it a suitable choice for applications where understanding the decision-making process is crucial. However, EBM InterpretML's lower recall (sensitivity) of 0.1082 compared to the CatBoost model suggests a tendency to miss more positive cases. This is an important consideration in the context of care delivery, where failing to identify patients in need of intervention could have significant consequences. The model's precision is 0.6158, and it achieves a specificity of 0.9809, indicating excellent performance in identifying true negatives.
The CatBoost model demonstrates a higher ability to correctly identify positive cases, such as patients requiring admission to a mental health inpatient ward. It achieves the highest accuracy among the evaluated models at 0.7900, indicating strong overall performance. CatBoost's recall of 0.1307 compared to EBM InterpretML suggests it is more effective at capturing true positive cases, reducing the likelihood of missing patients who require critical care. This makes CatBoost a compelling choice for scenarios where the priority is to maximise the detection of positive cases, even if it means sacrificing some interpretability. CatBoost's precision is 0.5720, with a specificity of 0.9723, reflecting its capability to avoid false positives while effectively identifying true positives.
In contrast, the Random Forest model presents a balanced approach with its accuracy of 0.7776 and recall of 0.1152. While it does not achieve the highest sensitivity, it performs reasonably well across various metrics, offering a compromise between interpretability and predictive power. Random Forest's recall is slightly higher than EBM InterpretML, suggesting a better ability to capture positive cases, although it still lags behind CatBoost in this regard. The model's precision is 0.4836, and its specificity is 0.9652, indicating good performance in identifying true negatives, which is crucial for minimising unnecessary interventions.
The choice between EBM InterpretML, CatBoost, and Random Forest should be informed by specific clinical priorities. If interpretability is crucial, EBM InterpretML is advantageous; however, CatBoost offers superior performance in capturing true positive cases if the goal is to maximise the identification of patients requiring admission. With its balanced approach, the Random Forest model provides a viable middle ground for situations where both interpretability and predictive accuracy are important considerations. The choice of model should be guided by the specific clinical context and the importance of minimising false negatives or false positives, depending on the consequences of each error type. The results of this study demonstrate the effectiveness of ML models in the prediction of admissions to a MH inpatient ward based on routine data collected at the triage stage in the ED. This finding aligns with previous research10,12 that demonstrates the potential of ML models to enhance decision-making processes and improve patient outcomes in the ED setting.
While some of the models exhibit positive predictive performance, ensuring transparency and interpretability is crucial for gaining trust and acceptance among clinicians and patients. 15 This is where the EBM InterpretML model offers a strong overall balance, making it suitable for applications such as healthcare, offering clinicians deeper insight into the data and how recommendations are made. InterpretML facilitates the interpretation of ML models by identifying complex interactions through methods such as the overall importance graph. 33 This graph uses the mean absolute score (MAS) to assess each feature's impact on model predictions. 44 MAS is calculated by permuting the values of each feature in the dataset and comparing the model's predictions before and after permutation. Features with higher MAS are deemed more important to the model's predictions. The overall importance graph ranks features by their MAS, allowing for quick identification of those with the most significant impact. Additionally, InterpretML uses Log odds to interpret the relationship of each element to outcomes visually. Log odds represent the probability of an event as a logarithmic function of its odds. 45 The log odds ratio (OR) compares the odds of an event occurring between two groups, such as treatment and control. By integrating Log OR, the model can assess the impact of each predictor, compare outcomes across different groups, and provide a unified probability scale.
Figures 15 and 16 provide a demonstration of the capabilities of the InterprtML package. Figure 15 provides the overall global importance of the features of the model and their relative predictive power and influence on the model. Figure 16 is a demonstration of one prediction from the unseen test dataset. In this case, the most heavily weighted features that the model used to make a recommendation were the individual's need for admission based on their triage category, the fact that they are an active client of the service, their age, the facility they presented to, their marital status (divorced), and their presenting problem of suicidal ideation. This output (Figure 16) enables the clinician to examine the recommendation (in this case, admit) to see if there are confounding factors present that would require further assessment and time with the individual to assess their needs. Based on this information, it may be possible enhance clinical practice by offering quicker assessments or by providing less experienced clinicians with the necessary tools to guide their practice in identifying important presentation factors that require further exploration. Visualisations such as Figure 16 can assist clinicians in understanding the underlying factors contributing to the model's predictions, fostering trust and enabling more informed decision-making processes. This transparency is crucial in any ML innovation gaining acceptance among healthcare professionals.15,16 Further detail regarding InterpretML and its use in this data asset can be found at Higgins, Chalup 34

EBM overall importance.

EBM individual prediction.
Limitations
One limitation of this study is the reliance solely on the initial data collected during the patient's presentation to triage in the ED and may not be representative of all MH presentations due to issues such as triage coding or alternative admission pathways. Furthermore, while this data provides valuable insights into the patient's condition at the time of triage, it may not capture the complete picture of the patient's overall health status, medical history, and various psychosocial factors that could influence the need for admission to a MH inpatient ward. By limiting the data sources to the initial triage information, this research may overlook crucial details that could enhance the predictive capabilities of the ML models. Integrating additional data sources, such as electronic medical records (EMRs), patient-reported outcomes, and social determinants of health, could potentially provide a more comprehensive and holistic assessment of the patient's needs. EMRs contain a wealth of information, including past medical histories, diagnoses, treatments, and laboratory results, which could offer valuable context for the ML models to consider. 10 Furthermore, incorporating patient-reported outcomes, such as questionnaires or self-assessments, could provide insights into the patient's subjective experiences, symptoms, and overall well-being, which may not be fully captured in the initial triage data. It is important to note that the data used in the development of these models was from January 1, 2016, to December 30, 2021. This period included the COVID-19 pandemic, which included two major lockdowns 46 for the region in question and is noted as a period of increased MH stress for Australian people. 47 This must be taken into consideration and may limit the generalisability and applicability of the study's findings to diverse patient populations and healthcare settings. Finally, it must be noted that models should ideally be tested on an external dataset to assess generalisability. This is a broader issue in the development of ML models, especially in healthcare, as the absence of open data and code in many studies makes it difficult to reproduce and validate findings.48,49 This lack of transparency also limits the ability to compare results across studies using varying data labels and evaluation metrics. 48
Recommendations
Conclusion
This research has demonstrated the potential of Machine Learning in predicting admissions to a MH inpatient ward based on routine data collected at the triage stage in the ED. The positive predictive performance of the models, combined with the interpretability provided by the InterpretML framework, offers a promising approach to enhancing decision-making processes and optimising resource allocation in MH care. However, the successful implementation of these ML models in clinical practice requires a multifaceted approach that addresses concerns about trust and transparency, ethical considerations, and continuous validation and refinement. By collaborating with subject matter experts and incorporating feedback from clinicians and patients, these ML innovations can be effectively integrated into existing healthcare systems, ultimately improving patient outcomes and enhancing the quality of MH care delivery.
Footnotes
Acknowledgements
Authors would like to acknowledge the support of Central Coast Local Health District
Authorship statement
OH – concept development, project design, data collection, data analysis, manuscript preparation.
RW – concept development, contribution to manuscript, supervision of project.
SC – data analysis, project design, data collection, data analysis, manuscript contribution, supervision of project
Consent to participate
The requirement for informed consent to participate has been waived by the Hunter New England Human Research Ethics Committee, where it has been deemed that consent would be impossible or impracticable to obtain.
Declaration of conflicting interests
The authors declared no potential conflicts of interest with respect to the research, authorship, and/or publication of this article.
Ethics approval
Ethical approval was granted by the Hunter New England Human Research Ethics Committee 2022/ETH01597. Central Coast Local Health District granted site-specific approval 2022/STE03296
Funding
Partial financial support was received from NSW Ministry of Health as part of the Towards Zero Suicides initiative.
Guarantor statement
OH is the guarantor who has taken full responsibility for this article, including the accuracy and appropriateness of the reference list.