
Abstract
Objective
This study aims to create a robust and interpretable method for predicting dementia in Parkinson's disease (PD), especially in resource-limited settings. The model aims to be accurate even with small datasets and missing values, ultimately promoting its use in clinical practice to benefit patients and medical professionals.
Methods
Our study introduces LightGBM–TabPFN, a novel hybrid model for predicting dementia conversion in PD. Combining LightGBM's strength in handling missing values with TabPFN's ability to exploit small datasets, LightGBM–TabPFN outperforms seven existing methods, achieving outstanding accuracy and interpretability thanks to SHAP analysis. This analysis leverages data from 242 PD patients across 17 variables.
Results
Our LightGBM–TabPFN model significantly outperformed seven existing methods. Achieving an accuracy of 0.9592 and an area under the ROC curve of 0.9737.
Conclusions
The interpretable LightGBM–TabPFN with SHAP signifies a significant advancement in predictive modeling for neurodegenerative diseases. This study not only improves dementia prediction in PD but also provides clinical professionals with insights into model predictions, offering opportunities for application in clinical settings.
Introduction
Parkinson's disease (PD) stands as the second most prevalent neurodegenerative ailment among the elderly, impacting nearly 2% of individuals aged 65 and above. 1 The emergence of dementia in PD is a common and belated occurrence, with estimates suggesting an annual 10% incidence of dementia development in PD patients. 2 The global dementia burden, exceeding 55 million individuals, is noteworthy, with over 60% of cases concentrated in low- and middle-income countries (LMICs). 3 LMICs grapple with a pronounced deficit in mental health professionals such as psychologists, nurses and social workers, a circumstance exacerbated in comparison to high-income nations. 4 For instance, in 2015, China reported a psychiatrist availability rate of 2.2 per 100,000 in the mental health sector, contrasting with the United States’ rate of 10.54 per 100,000. African countries like Zimbabwe, Mozambique and Angola displayed even lower rates at 0.095, 0.046 and 0.057, respectively, accentuating the dearth of accessible treatment and care in rural LMIC areas. The imperative for early and precise dementia prediction in PD patients is underscored by the necessity to optimize treatment approaches and enhance patient outcomes, thereby delaying disease progression. 5 Nonetheless, the development of dependable prediction methodologies, particularly in scenarios characterized by limited data, remains a formidable challenge.
The conventional approach to predicting complex outcomes like dementia in PD involves using statistical models6,7 or machine learning (ML) algorithms. While these methods achieve acceptable accuracy, they often lack transparency, making it challenging to discern the key factors influencing dementia development. This trade-off between accuracy and interpretability is particularly evident in deep learning (DL) models, which boast intricate neural networks with millions of parameters. 8 Adding complexity to the situation is the limited availability of data in this research domain, which present a challenge for applying conventional methods to small tabular datasets of PD patients.
To overcome these challenges, our investigation introduces a novel hybrid LightGBM–TabPFN, demonstrating its potential for robust PD's dementia diagnosis in real-world clinical settings. Our approach further demonstrates remarkable performance even in scenarios with data restrictions and missing values, making it a promising solution for real-world data. Additionally, we integrate SHapley Additive exPlanations (SHAP) to elucidate the model's predictions, thereby enhancing its transparency and interpretability for medical professionals. Successfully navigating these challenges has the potential to promote broader acceptance of our proposed methodology in practical clinical settings. This, in turn, could contribute to enhanced dementia prediction for PD patients under resource constraints, offering advantages to both patients and clinicians.
Literature review
Recent developments in the field of dementia classification have witnessed a growing research trend, as indicated by the literature, 9 Notably, the prevailing trend in current research leans heavily towards the preference for MRI data over clinical data. This inclination is discernible through a substantial discrepancy in the number of studies conducted for each data type.
Specifically, in the context of distinguishing patients with dementia from healthy controls, the performance of their research models in terms of accuracy spans a range from 0.770 to 0.968. Notably, Qiu et al. achieved the highest accuracy of 0.968, complemented by an area under the ROC curve (AUC) of 0.996. Their approach involved employing a fully convolutional network (FCN) with a traditional multiple perceptron (MLP) for generating visualizations indicative of AD's dementia risk. It is worth highlighting that this research utilized non-imaging features, incorporating gender, age and the Mini-Mental State Examination (MMSE) Score.
In a recent study by Venugopalan et al., 10 a novel method of addressing gaps in disease understanding was proposed—data integration across modalities. The authors found that optimal fusion setups involved combining electronic health records 11 (EHR), imaging data, and single-nucleotide polymorphisms. A noteworthy observation from their work was that small sample sizes present a challenge for DL models.
A previous study 12 used a Bayesian network classifier on MRI data from 45 PD patients to predict dementia. A filtered Naïve Bayes model performed best, showing high sensitivity of 0.9233, specificity of 1, and accuracy of 0.9655. It identified hippocampi, lateral ventricles, and cerebral white matter as key dementia-related structures.
Materials and methods
Data source
This study leveraged epidemiological data pertaining to patients with PD's dementia (EPD) sourced from the National Biobank of the Korea Disease Control and Prevention Agency. The data's provenance and specifics are elucidated in the work by Byeon. 13 In a concise overview, the dataset was amassed during the period spanning January to December 2015, drawing from 14 tertiary medical institutions nationwide. The data collection process was conducted under the auspices of the Korea Centers for Disease Control and Prevention (CDC) and employed computer-assisted personal interviews (CAPI) to execute a comprehensive health survey. Prior to the receipt and analysis of the data, requisite approvals were secured from both the Korea Disease Control and Prevention Agency's Research Ethics Review Committee (Approval No. KBN-2019-005) and the Lotting-out Committee of the National Biobank Korea (Approval No. KBN-2019-1327).
Data preprocessing
Prior to model training, the PD patient dataset underwent a thorough cleaning process. A comprehensive cleansing procedure was applied to the PD patient dataset. Non-informative attributes such as IDs and dates were systematically excluded, and data pertaining to Alzheimer's patients and their associated variables were specifically omitted to maintain a focused analysis. Rows with missing values, with particular emphasis on the “DEM DEMENTIA” target feature, were eliminated to mitigate bias and ensure accuracy. Through meticulous tackling of these preprocessing steps, we meticulously curated a dataset poised for adept dementia prediction within the PD domain. The “DEM_DEMENTIA” feature, designating dementia status, was selected as the target in the context of this study.
To ensure all features contributed equally to model performance and improve generalizability, we addressed the different scales of both numerical and categorical variables in our dataset. For numerical features, we applied scaling to standardize their values within a common range (e.g. 0–1). This prevents features with larger scales from dominating the model and ensures all features exert proportional influence. In the case of categorical features, like “DEM EDU” representing years of education, we encoded them into categories relevant to the Korean education system (e.g. elementary, middle school, high school, college). This transformation not only enhances interpretability but also increases the model's sensitivity to meaningful variations within the feature's domain, potentially boosting its accuracy and applicability.
Following data cleaning, the dataset shrank to 242 patients: 166 without dementia and 76 with it, reflecting a highly imbalanced class distribution. We refined the dataset to 36 informative variables and the target feature, applying ordinal encoding to categorical variables. Table 1 details these 36 variables and the target feature, including their data types and encoding details for categorical ones.
Description of variables used in this research.

Data split for training, validation and testing
Following the data preparation steps, our dataset included information from 242 patients, encompassing 36 different factors along with the target variable. To build and select features for our model, we randomly picked 80% of this data, constituting 193 patients, to serve as the training set. The remaining 20%, comprising 49 patients, was reserved as the validation set.
Feature selection with RFECV
To optimize model performance and enhance interpretability, we employed Recursive Elimination with Cross-Validation with Random Forest (RFECV)
14
for feature selection. This robust approach iteratively removes the least informative feature while ensuring generalizability through k-fold cross-validation.
15
This offers several advantages:
Efficient exploration: RFECV systematically eliminates features, progressively evaluating various combinations and avoiding exhaustive testing. Generalizability: k-fold cross-validation mitigates overfitting by training the model on multiple subsets of the data, leading to more reliable estimates of feature importance. Interpretability: By identifying the most relevant features through RFECV, we gain valuable insights into the key drivers of the model's predictions, facilitating effective interpretation.
RFECV procedure
Initialization: All features are included in the initial model.
Fold-wise training and evaluation: The data is divided into k folds.
For each fold, the model is trained on k–1 folds, excluding the current fold.
Within each fold of the cross-validation, excluding the current fold used for training, the Random Forest model's performance is evaluated, and feature importance is measured based on this evaluation. 16
Feature elimination: The characteristic with the least significant importance score is excluded from the model across all cross-validation folds.
Iteration: Steps 2 and 3 are repeated until a desired number of features or stopping criterion is reached (e.g. minimal performance improvement on the validation set).
RFECV implementation
We implemented RFECV using the scikit-learn package in Python. The number of folds k used in cross-validation affects the robustness of feature importance estimates. While higher k values offer greater robustness, they also increase computational cost. For most datasets, k values between 5 and 10 are preferred. 17 In this dataset, due to highly imbalance mentioned above, we chose k = 10.
Tabular Prior-Data Fit Network (TabPFN)
TabPFN 18 emerges as a cutting-edge approach to supervised classification tasks on tabular data, harnessing the power of Prior-Data Fitted Networks (PFNs). PFNs challenge traditional model training by embracing a vast knowledge base derived from simulated datasets, enabling rapid and insightful inference on new data. Key concepts of PFNs include:
Prior-Data Fitted Networks (PFNs)
19
challenge the traditional model training paradigm with a Bayesian-inspired approach. Instead of relying on a single training dataset, PFNs leverage knowledge from a vast collection of simulated datasets. This pre-training, combined with their unique single-pass inference capability through Bayesian inference, makes them a promising alternative for analyzing small tabular data. Table 2 explains how the PFN model was trained by Fitting Prior-Data.
Pre-training on diverse simulated data: A PFN is pre-trained on a collection of diverse simulated datasets, each with its prior distribution. This allows the network to learn a wide range of potential relationships between features and labels. Figure 1 illustrates the key components of PFNs. Using Transformer: PFNs typically utilize Transformer architectures,
20
known for their effectiveness in language processing and their ability to capture complex relationships. PFNs leverage a slightly modified version that's permutation invariant. This means the model can handle input sequences in any order, eliminating the need for positional encoding. These adapted Transformers play a crucial role in learning to represent the posterior distribution of model parameters for each simulated task during pre-training. In-context inference with new data: When presented with a new dataset, the PFN takes the data and some test features as input and executes a single forward pass through the network. This single pass estimates the posterior distribution for the new data point, effectively capturing the uncertainty alongside the prediction.

Concept of prior-data fitted networks (PFNs). 19
Explained PFN algorithm.

TabPFN builds upon the foundation of PFNs, specifically designed to excel in the realm of tabular data. It distinguishes itself with two key modifications:
Optimized attention: To address the computational bottleneck of PFNs during inference, TabPFN employs meticulously crafted attention masks. These masks strategically allocate attentional resources, resulting in significantly faster predictions compared to traditional PFNs. Zero-Padding: Furthermore, TabPFN embraces the diverse nature of tabular data by incorporating zero-padding techniques. This allows it to seamlessly handle datasets with varying numbers of features, offering unmatched flexibility and adaptability.
Hybrid LightGBM–TabPFN
In modern datasets, the prevalent issue of missing data poses a pervasive challenge. This common occurrence emerges when specific observations or variables lack recorded information, creating a substantial obstacle as part of the process of extracting insights and meaning from the data. The origins of missing data are diverse, encompassing human error during data collection and the inherent characteristics of certain data sources. Missing values can introduce bias, potentially skewing the quality of learned patterns and/or the performance of classification tasks. 21
Despite initial preprocessing and the removal of features with over 50% missing values, several features in the dataset continued to exhibit high null percentages. Notably, the “DEM_UPDRS_TSCT” feature contained 48.76% missing values. To address this issue, we employed ML-based techniques for missing value imputation. 22
To evaluate the effectiveness of the ML algorithm in predicting missing values, we conducted a comparison across five state-of-the-art architectures in a regression task using the “DEM_UPDRS_TSCT” feature. The evaluated algorithms include Random Forest, LightGBM, Gradient Boosting, XGBoost, and Extra Trees. Notably, both Random Forest and LightGBM achieved an identical R-squared value of 0.58. However, LightGBM demonstrated a significantly faster execution time, completing the task in 0.08 seconds compared to Random Forest, and it slightly outperformed in terms of Root Mean Square Error (RMSE) as an evaluation measure. Consequently, LightGBM was selected as the ML model for predicting missing values due to its efficient performance. Further details and comprehensive evaluation results are outlined in Table 3.
Evaluation result on predicting “DEM_UPDRS_TSCT” feature.

Boldvalue indicates the highest R-squared and RMSE values, as well as the lowest time taken.
After selecting LightGBM as the model for missing value prediction, we proceed as follows:
Data preparation:
Assume the dataset is a Sort the features (
Iterative imputation:
For each feature with missing values, we separate the data into two parts:
Further split Xtrain into predictor and target variables for the model:
The LightGBM was trained on
Pseudocode for using LightGBM to predict missing values.

Traditional imputation techniques
To evaluate our proposed missing value imputation method's impact on model performance for dementia prediction in PD's patients, we compared its efficacy with well-known techniques. This analysis allows us to identify the most suitable method by evaluating each approach's relative strengths and weaknesses.
K-Nearest neighbors imputation for missing value handling
The K-Nearest Neighbors (KNN) imputation method utilizes the KNN algorithm to estimate and substitute missing data values.
23
This method identifies the k nearest neighbors of a data point with a missing value. These neighbors are the data points within the dataset that exhibit the greatest similarity to the point in question, based on the available features. This similarity is often quantified using a distance metric, such as the Euclidean distance captured in Equation (1). By leveraging the information contained within these k nearest neighbors, the KNN imputation method can predict a suitable value to replace the missing data point.
The KNN imputation method, while valuable for handling missing data, presents two noteworthy challenges. The first challenge lies in determining the optimal value for the parameter k, which represents the number of nearest neighbors used for imputation. Selecting an excessively small k-value may limit the information available for accurate prediction, while a large k-value could introduce noise from dissimilar neighbors. The second challenge concerns the dataset-specific nature of KNN imputation. The selection of the most suitable k neighbors may vary depending on the characteristics of the specific dataset under analysis.
24
To address these challenges, we explored a range of k values. While research
25
by Lall et al. suggests
Multiple imputation by chained equations
Multiple Imputation by Chained Equations (MICE) offers a robust approach to managing missing data within datasets. As outlined in research by Azur et al., 26 MICE iteratively construct multiple complete versions of the data to address this challenge. Initial imputation fills missing entries with placeholders (means for continuous, most frequent category for categorical data).
MICE then employ an iterative loop focused on one variable with missing data at a time. Within each iteration, a statistical model is built for the target variable leveraging relationships with other variables. The model type (e.g. linear regression) depends on the target variable's nature. Once constructed, the model predicts missing values, effectively updating the data. The loop iterates through all variables, repeating model building, prediction and imputation. Crucially, each iteration incorporates previous imputed values, creating a chain of dependencies. Convergence signifies consistent imputed values and stable parameter estimates. The final imputed values replace the original missing data, resulting in a complete dataset for analysis. MICE assume Missing at Random (MAR) data, where missingness depends only on observed data.
Simple imputation
Simple imputation offers a straightforward approach to handling missing data in datasets. It replaces missing entries with a single value derived from the observed data, typically based on central tendency measures properties of the variable with missing values.
For continuous variables (numerical data), mean imputation fills in missing entries with the average of the observed values. This assumes the missing values are randomly distributed around the mean. For categorical variables, mode imputation replaces missing entries with the most frequent category. This assumes missing values are most likely to belong to the most common category.
This research will specifically implement mean imputation for numerical data features, where the mean of the observed values in each feature will replace missing entries. Similarly, mode imputation will be applied to categorical data features, where the most frequent category within each feature will replace missing entries.
Shapley Additive exPlanations (SHAP)
SHAP, 27 based on game theory, 28 are popular local explanation 29 and model-agnostic approaches. It is designed to elucidate predictions made by any “black-box” classifier 30 classifier. These approaches provide interpretable and faithful explanations for individual predictions by locally learning an interpretable model (e.g. a linear model) around each prediction. More precisely, SHAP estimates feature attributions on individual instances, effectively capturing the contribution of each feature to the “black-box” prediction.
The present study employed SHAP to elucidate the feature-level contributions within a hybrid model comprising n features grouped as N. This approach assigns Shapley values, quantifying the marginal impact of each feature on the model's final prediction. The underlying methodology adheres to principles of fairness, ensuring equitable attribution of credit to individual features. This safeguards against biases arising from feature interactions or model complexity, thus fostering a nuanced understanding of the model's inner workings, as shown in Equation (2).

SHAP values are often visualized using force plots or bee-swarm plots. Each feature receives an arrow (positive Shapley value pushes the prediction up, negative pulls it down). The sum of all arrow balances at the final prediction, resembling the balanced scales of justice. These visualizations reveal patterns, outliers and potential biases in the model's decision-making process.
Benchmarking the hybrid LightGBM–TabPFN architecture
To thoroughly assess the effectiveness of the hybrid LightGBM–TabPFN architecture we propose, we conducted a benchmarking analysis against various prominent baseline models in ML and DL. This comparison allowed us to establish performance benchmarks. The ML and DL baseline models utilized in this investigation include:
XGBoost,
31
or eXtreme Gradient Boosting, extends gradient boosting by employing a unique regularization term (e.g. L1/L2) and parallel computing to achieve superior accuracy across a diverse range of tasks, including regression, classification and ranking. LightGBM
32
builds upon the Gradient Boosting Decision Tree (GBDT) with innovative techniques like Gradient-based One-Side Sampling and the Histogram-based Algorithm. These methods accelerate training time, reduce memory usage and ultimately enhance the precision of its GBDT model. Random Forest
16
an ensemble method that combines numerous decision trees. Known for its robustness and accuracy, this technique combines the predictions of diverse trees to deliver reliable results, demonstrating resilience against noise and overfitting. Bagging Classifier,
33
an ensemble learning method rooted in Bootstrap Aggregating, is adept at improving the robustness and accuracy of classification tasks. By constructing multiple classifiers through bootstrap sampling, where the training process is conducted on each respective model, Bagging mitigates overfitting and enhances predictive performance. The amalgamation of diverse predictions from these classifiers yields a more resilient and accurate overall classifier. AdaBoost
34
stands for “Adaptive Boosting.” Unlike typical approaches, AdaBoost enhances the capabilities of its decision tree learners by emphasizing difficult-to-classify examples. In an iterative fashion, each subsequent learner addresses the errors of its forerunners, culminating in the creation of a resilient and precise powerhouse tailored for intricate classification tasks. ExtraTree
35
short for Extremely Randomized Trees is an ensemble learning method within the decision tree algorithm class. Similar to Random Forests, it builds an ensemble of decision trees, each trained on a subset of the dataset. What distinguishes ExtraTree is its unique approach to constructing individual trees. Unlike its counterparts, ExtraTree rapidly selects split points for nodes by choosing them randomly instead of exhaustively searching for optimal splits among selected features. This heightened randomness enhances model robustness, encouraging more variety among the individual trees in the ensemble. HyperTab
36
a DL framework designed to address challenges posed by limited sample problems on tabular datasets. It leverages the power of hypernetwork,
37
where a neural network learns to generate the weights for another network. Unlike traditional DL models prone to overfitting with scarce data, HyperTab's hypernetwork architecture facilitates data-efficient learning on tabular datasets. This allows for accurate model construction and reliable predictions, even with limited samples.
Model evaluation metrics
In assessing the effectiveness of these models, we utilized a range of standard metrics commonly applied in classification tasks, including recall, F1-score, precision, AUC, and accuracy, as detailed in Equations (4)–(8). True positives (TP) represent accurate classifications of belonging cases, while false positives (FP) showcase misleading inclusions. Conversely, true negatives (TN) capture accurate exclusions of non-belonging cases, whereas false negatives (FN) reveal missed positive instances with potentially significant consequences. These metrics form the foundation for performance measures, enabling a comprehensive evaluation of the model's ability to navigate class boundaries effectively.


Results
Results of feature selection
In this study, REFCV selected features by using 10-fold cross-validation and accuracy as a measure-score. As a result, the highest accuracy was shown with a number of 17 features chosen from a total of 36 variables. REFCV features included DEM_AGE, DEM_EDU, DEM_COFFEE, DEM_DM, DEM_PDFAM, DEM_ADDEMFAM, DEM_PI, DEM_LMC, DEM_RBD, DEM_KMMSE_SCR, DEM_KMOCA_SCR, DEM_DEPRESSION, DEM_CDR_GSCR, DEM_CDR_SSCR, DEM_KIADL_SCR, DEM_UPDRS_TSCR and DEM_SEADL_PCT.
Evaluation on validation set
Hyperparameter optimization (HPO) stands as a pivotal role in building robust ML models. These often-invisible settings profoundly shape model behavior and generalization capabilities. HPO involves a systematic search for the optimal configuration of these parameters, ensuring peak model performance on a specific dataset. While numerous HPO strategies exist, contemporary techniques like Bayesian optimization have gained prominence for their efficiency and speed. In the course of this study, we utilized Optuna [23], a Python library available as open-source (version 3.5.0). Optuna provides a comprehensive suite of tools, including both Bayesian optimization and random search algorithms, allowing for the meticulous fine-tuning of hyperparameters. Its integration with prominent ML frameworks such as TensorFlow and PyTorch adds a layer of efficiency, simplifying and enhancing the optimization process seamlessly within the workflow of model development. Table 5 provides the HPO for each model.
Optimized hyperparameters of each model.

Random Forest Classification model = Random Forest, Extra Tree Classification model = Extra Trees, AdaBoost Classification model = AdaBoost, Light Gradient Boosting Machine Classification model = LightGBM, Extreme Gradient Boosting Classification model = XGBoost.
Following optimization, a thorough evaluation of each model's performance on the validation set was conducted. To prevent overfitting and ensure robust performance on imbalanced data, we implemented a 10-fold cross-validation strategy.
Our hybrid LightGBM–TabPFN model emerges as the standout performer across key metrics, demonstrating the highest accuracy at 0.9378, AUC at 0.9381 and F1 score at 0.9393. These results highlight TabPFN's exceptional ability to accurately classify instances, distinguish between classes, and balance precision and recall. XGBoost follows closely, with strong accuracy at 0.9234 and a respectable F1 score of 0.8764. HyperTab, while achieving lower scores in other metrics, notably attains perfect recall at 1.000, aligning with the hybrid TabPFN. Extra Trees, Random Forest, Bagging, AdaBoost and LightGBM demonstrate moderately good performance across the evaluated metrics. A comprehensive summary of the intricate performance details is presented in Table 6.
Performance on the validation set.
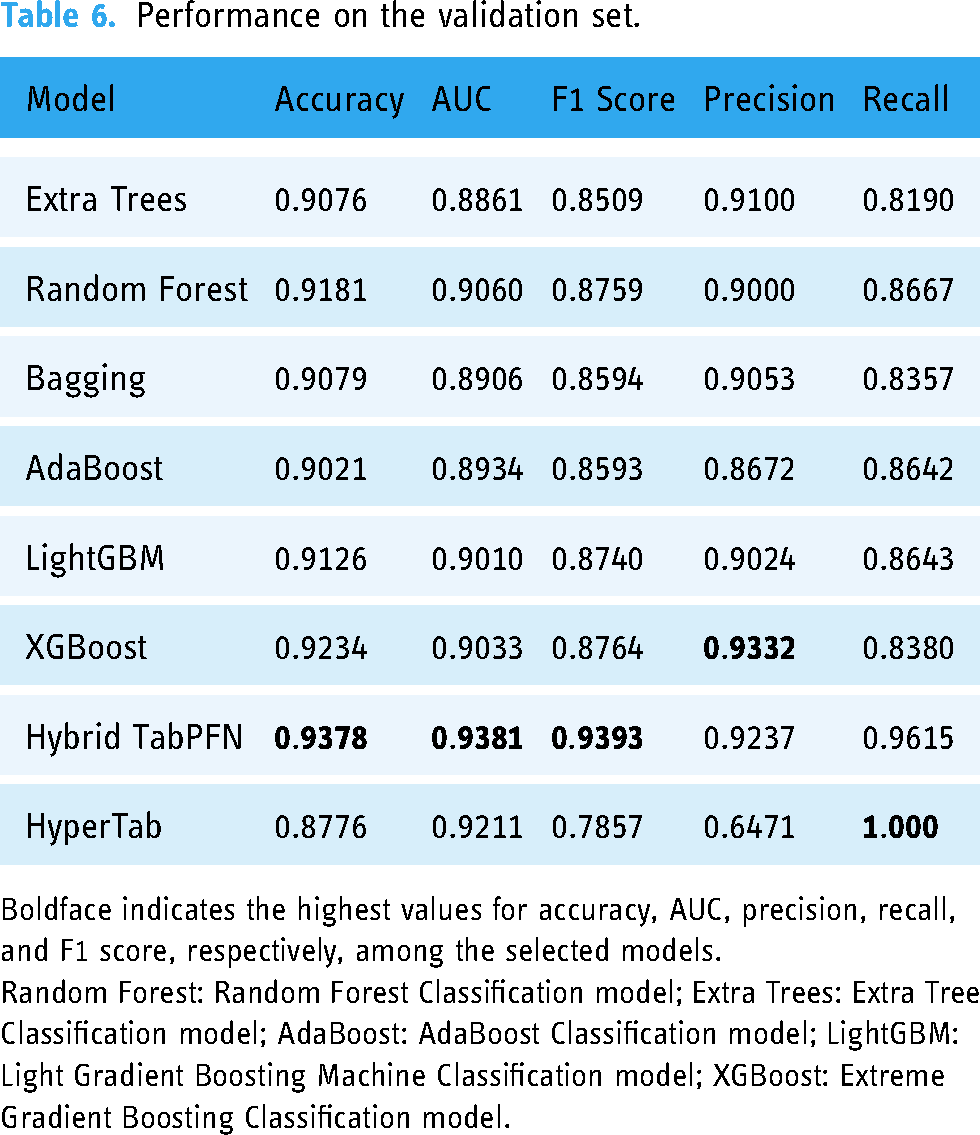
Boldface indicates the highest values for accuracy, AUC, precision, recall, and F1 score, respectively, among the selected models.
Random Forest: Random Forest Classification model; Extra Trees: Extra Tree Classification model; AdaBoost: AdaBoost Classification model; LightGBM: Light Gradient Boosting Machine Classification model; XGBoost: Extreme Gradient Boosting Classification model.
Evaluation performance on testing set
Upon completion of the fine-tuning and training stages, evaluating model performance on an unseen dataset became crucial. During training, our hybrid LightGBM–TabPFN model consistently outperformed baseline models across key metrics, including accuracy, AUC and F1 Score. Its effectiveness was further corroborated during testing, as evident in the confusion matrix (Figure 2). Figure 2 illustrates the confusion matrix of the Hybrid TabPFN model on the hold-out test set. This matrix visualizes the model's performance in classifying dementia and non-dementia cases. Each cell shows the number of data points that fall into a specific combination of predicted and actual labels. Notably, there are two data points that were incorrectly classified as dementia, but actually belonged to the non-dementia class (false positive). The model correctly classified 47 out of 49 patients, demonstrating its robustness and accuracy. It successfully predicted 36 out of 38 non-dementia patients and accurately identified all 11 instances of dementia.

Confusion matrix of the proposed hybrid LightGBM–TabPFN model on the hold-out test set.
Based on the insights from Table 7, the Hybrid TabPFN model showcases outstanding generalization capabilities with notable accuracy of 0.9592, AUC of 0.9737 and F1 Score of 0.9167, indicating its potential for real-world applications. Bagging and Extra Trees also perform well, exhibiting high accuracy and AUC scores. In contrast, renowned models like LightGBM and XGBoost fall short, underscoring the importance of evaluating models on domain-specific datasets. HyperTab, though slightly below the top performers, demonstrates a balanced F1 Score, valuable in scenarios prioritizing both false positives and false negatives. The hybrid TabPFN's exceptional recall, identifying all positive cases, is critical, but its precision warrants further investigation. Finally, the high AUC values achieved by the Hybrid TabPFN models suggest their exceptional ability to discriminate between classes across different decision thresholds. This robustness strengthens their candidacy for real-world deployment, equipping medical professionals with reliable tools for early prediction and timely intervention.
Performance on test set.

Boldface indicates the highest values for accuracy, AUC, precision, recall, and F1 score, respectively, among the selected models.
Random Forest: Random Forest Classification model; Extra Trees: Extra Tree Classification model; AdaBoost: AdaBoost Classification model; LightGBM: Light Gradient Boosting Machine Classification model; XGBoost: Extreme Gradient Boosting Classification model.
Comparison to traditional imputation techniques
We evaluated the performance of KNN imputation on the dataset using different K values. The TabPFN model was then applied to the imputed data. Results for the validation set and hold-out test set are presented in Tables 8 and 9, respectively.
TabPFN model performance with different k value on validation dataset.

Boldface indicates the highest values for accuracy, AUC, precision, recall, and F1 score, respectively, among the selected models.
TabPFN model performance with different k value on hold-out dataset.
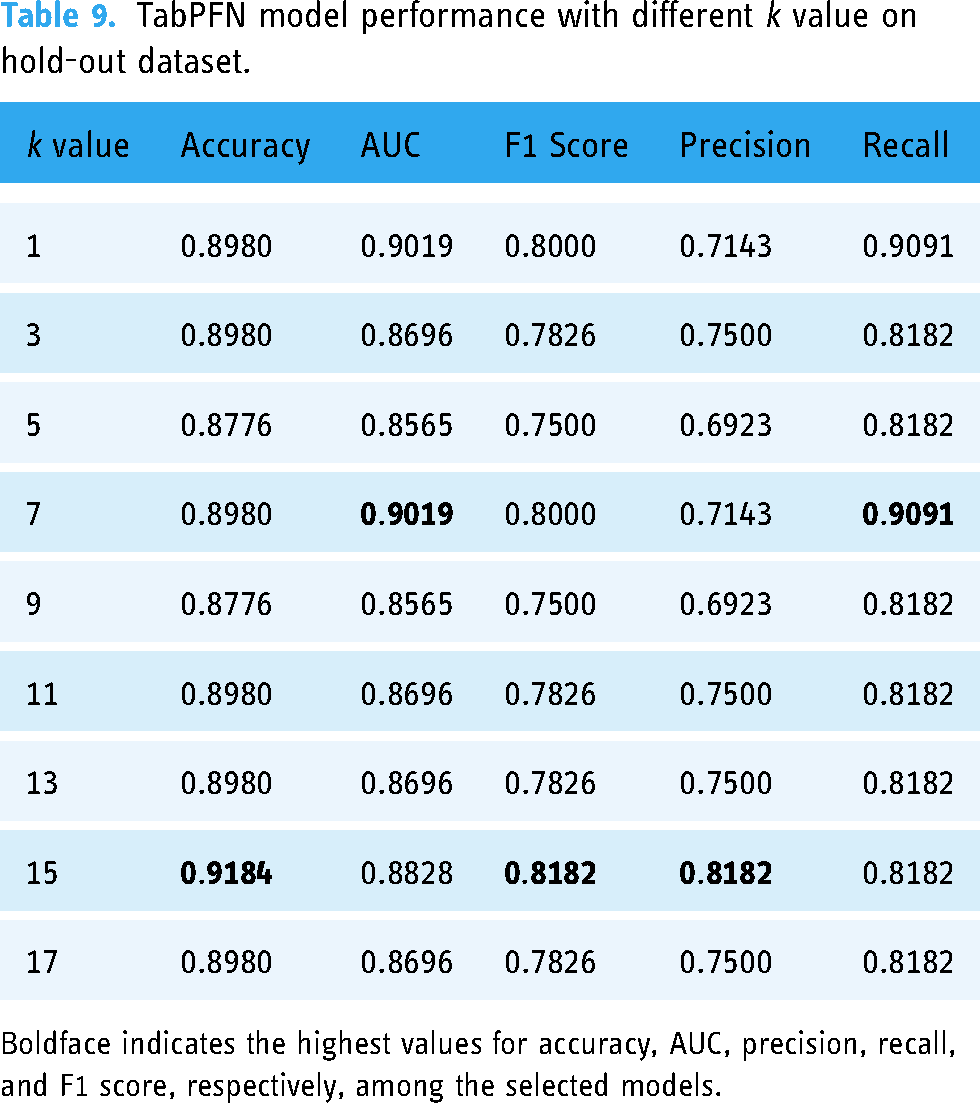
Boldface indicates the highest values for accuracy, AUC, precision, recall, and F1 score, respectively, among the selected models.
Our experiments on the validation dataset revealed that the TabPFN classification model achieved the highest accuracy (0.9418) for predicting dementia in PD patients when k, the number of nearest neighbors, was set to 17. Additionally, the model achieved an AUC of 0.9420, an F1-score of 0.9450 and a recall of 0.9769. However, precision was highest when k was set to 9.
For the hold-out test set, the model performed best with k = 15, achieving an accuracy of 0.9184, an F1-score of 0.8182 and a precision of 0.8182. To ensure a fair comparison with our proposed hybrid method and other imputation methods, we adopt k = 15 for further analysis. Table 10 summarizes the performance comparison between the previously discussed traditional imputation methods and our proposed hybrid method on hold-out test set.
Comparison of traditional imputation methods and proposed hybrid method hold-out test set.

k-NN: k Nearest Neighbors imputation with TabPFN Classifier; MICE: multiple imputation by chained equations with TabPFN; simple imputation: simple imputation with TabPFN.
Based on the table, the Hybrid TabPFN method outperforms all other imputation methods across all metrics. It achieves the highest accuracy (0.9592), AUC (0.9737) and F1 Score (0.9167). Additionally, it exhibits a high precision (0.8462) and perfect recall (1.0000), suggesting it effectively identifies positive cases while minimizing false positives.
Evaluation the interpretation of the proposed hybrid SHAP model
To illuminate both the predictive power and interpretability of our model, we present a compelling case study in Figure 3. This case involves a patient predicted to have dementia by model but who did not exhibit dementia in real life. Utilizing a color-coded visualization, we highlight features that strongly influence this prediction, casting them in a vivid shade of red to signify their alignment with Class 1 (Dementia). One of the highest risk factors on this case is having a family member with dementia, which aligns with research on the genetics of dementia. As research by Loy et al.,
38
25% of all people aged 55 years and older have a family history of dementia, which can affect model prediction. Other features such as education level,
39
depression history,
40
and age
41
have also been shown in various research to influence model predictions. Table 1 unveils the specific feature values for this patient, guiding us through a detailed interpretation of their significance:
KMMSE score: 13/30 Have a family history of dementia: 1 (Yes) Clinical Dementia Rating Scale (DEM_CDR_SSCR): 4.5/5 Education: 0 (Elementary) Korean Montreal Cognitive Assessment: 7.454/30 Age: 79 Depression: 1 (Yes) Untitled Parkinson disease rating: 15/199.

Feature importance waterfall plot for the false positive dementia case.
Figure 4 illustrates the bee-swarm plot depicting the model's SHAP values and their impact on the model output. The horizontal axis signifies the predictive influence of each feature, either positively (indicating dementia) or negatively (indicating non-dementia) for an individual. Furthermore, the bee-swarm chart employs color coding for each dot, highlighting how the feature value for an individual compares to the average for the entire population.
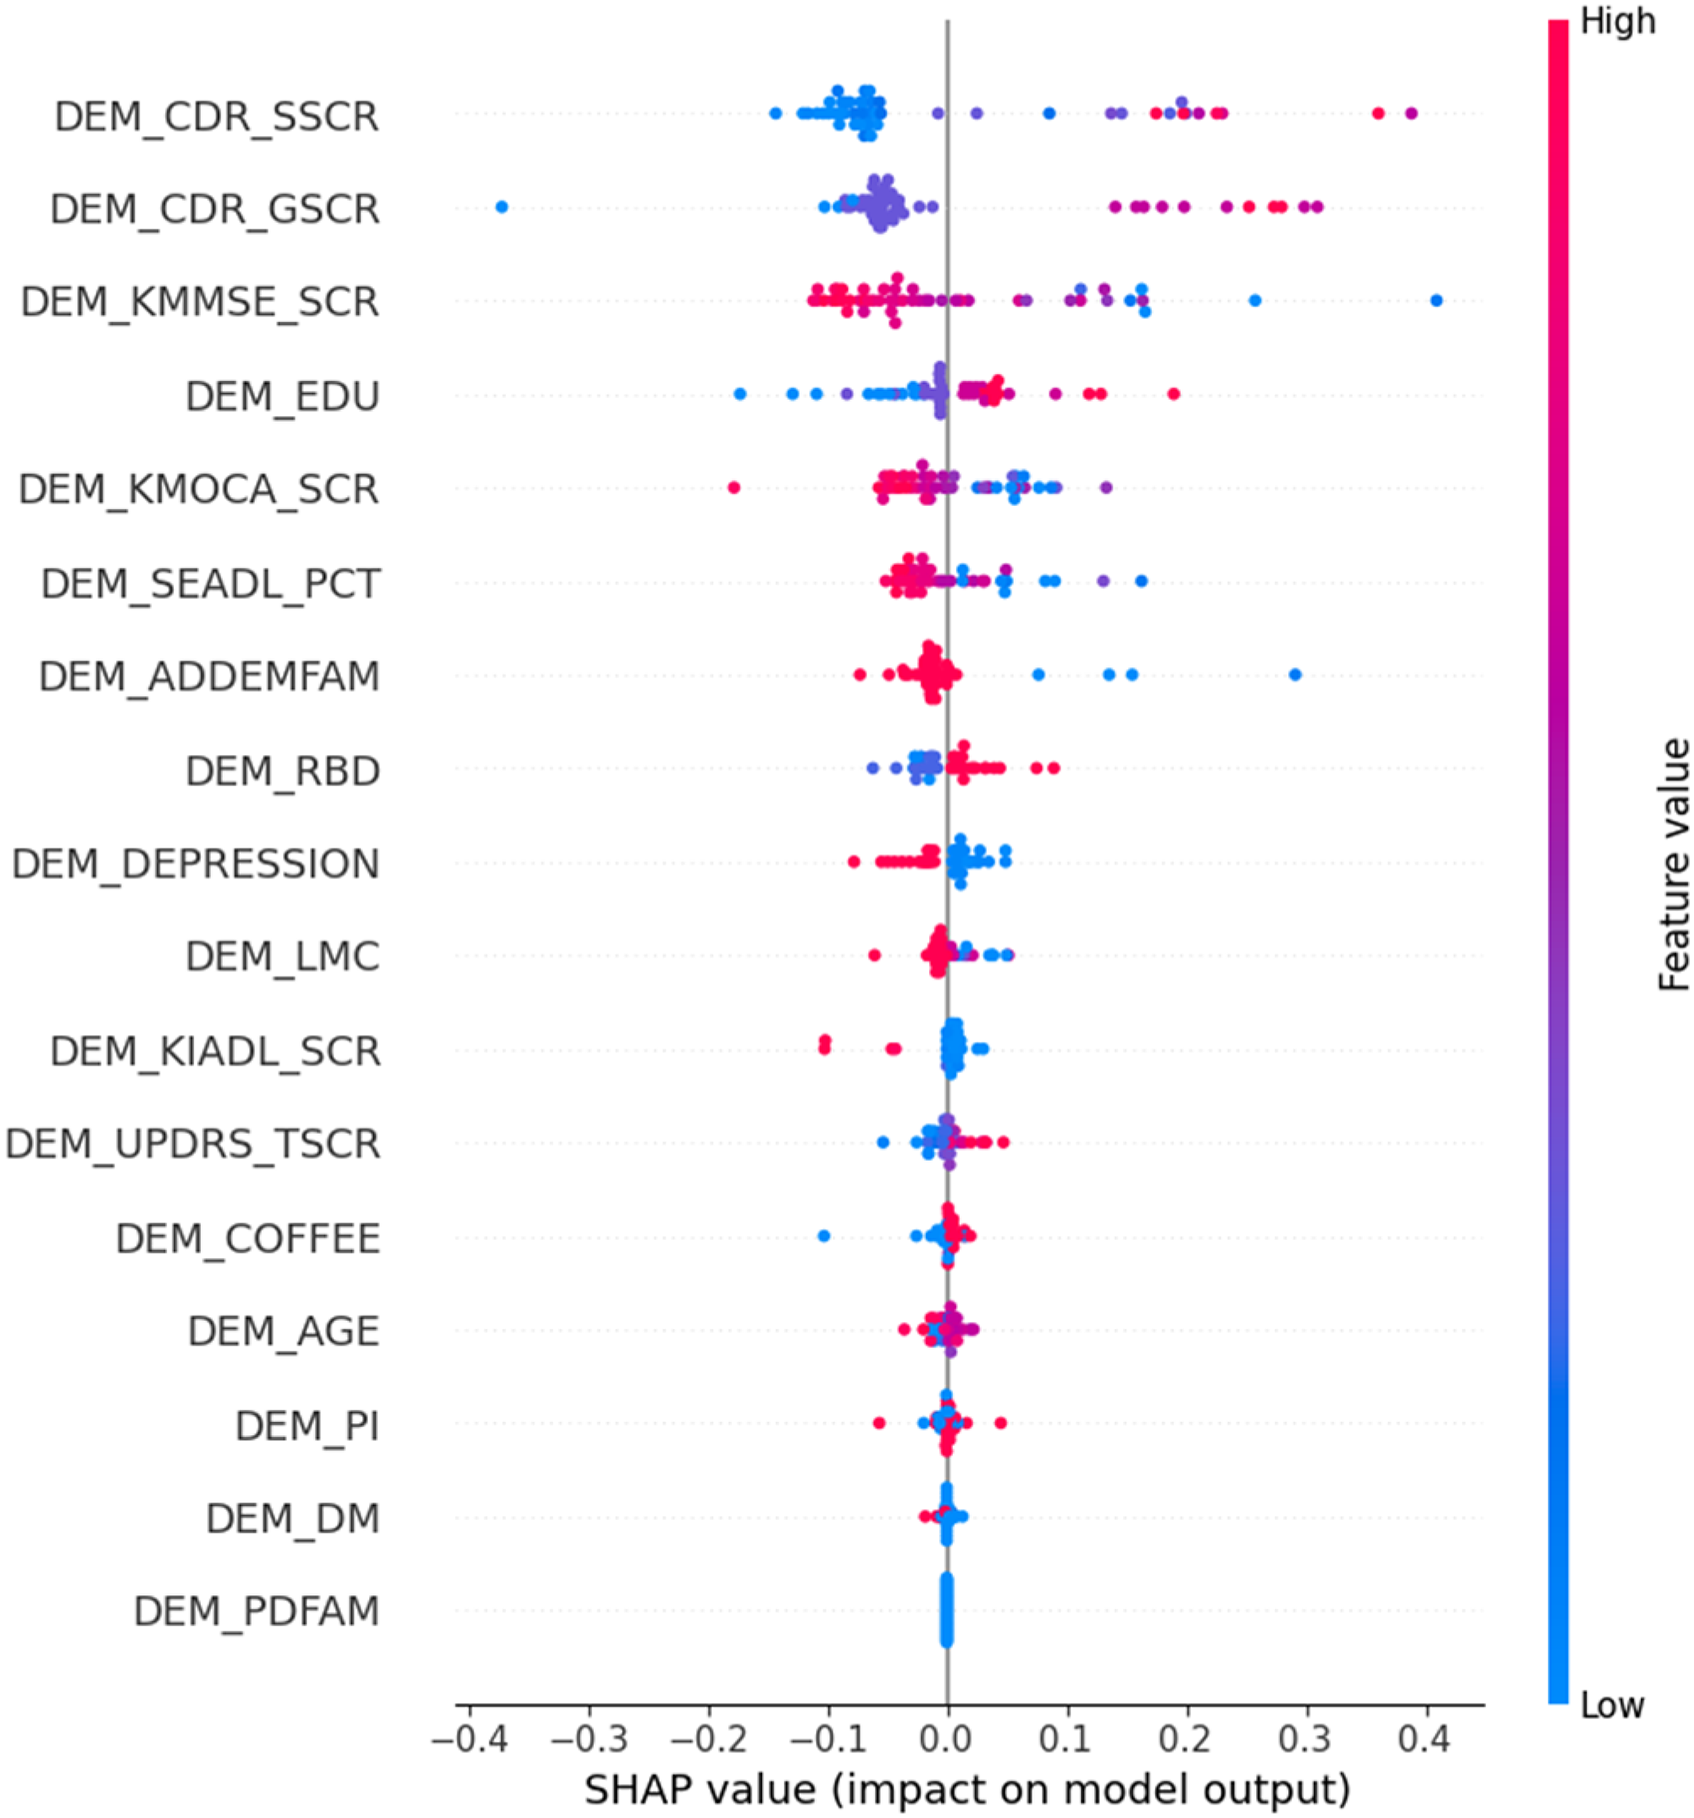
Bee-swarm plot of the proposed hybrid LightGBM–TabPFN model on the hold-out test set.
The figure reveals the contributing factors, in order of importance, for predicting dementia in PD patients. Details about these factors can be found in Table 1. Consistent with these findings, research 39 by Sharp et al. has shown a link between lower education (DEM_EDU) and increased risk of dementia. Furthermore, the presence of depression (DEM_DEPRESSION) aligns with established knowledge of the connection between depression and dementia, especially in later life. 40 By considering these key features, both doctors and AI experts can gain valuable insights to address and potentially mitigate model bias.
The two figures not only showcase the predictive capability of the hybrid LightGBM–TabPFN model for individual patients but also reveal the collective influence of each feature on the model's output. This assists healthcare professionals in grasping the reasoning behind the model's predictions without requiring specialized knowledge in AI. Improving this interpretability is pivotal for instilling trust in AI and expanding its practicality for deployment in clinical settings.
Discussion
Our hybrid LightGBM–TabPFN model, complemented by SHAP analysis, has demonstrated the ability to visualize the impact of clinical features on predictions and accurately assess the probability of dementia conversion. Comparatively, our classifier exhibits superior performance when contrasted with seven other models, showcasing a noteworthy AUC score that fortifies its predictive strength for PD dementia.
Moreover, the adaptability of our approach suggests ease of deployment in clinical settings. The methods employed for handling missing values in our study hold potential applicability across the broader medical research domain, contributing robustness to models dealing with datasets featuring missing values. Although initially tested in a binary classification context, we anticipate extending this technique to address multi-class problems.
Successful integration of the hybrid LightGBM–TabPFN model into existing clinical workflows is paramount for widespread adoption by physicians. This is particularly important given the phenomenon of electronic health record (HER) burnout. 42 To achieve this integration, future research will explore potential avenues for incorporating the model's functionality. This may involve embedding the model directly within the EHR system or developing a user-friendly mobile application interface specifically tailored for healthcare professionals. By readily presenting the model's predictions during patient consultations, such integration can significantly enhance clinical efficiency.
It is crucial to emphasize that the model's primary function is to augment, not supplant, clinical judgment. The model's output should be viewed as a valuable tool to inform and support physician decision-making processes. Envisioned scenarios for model utilization include flagging high-risk patients for further evaluation or prioritizing specific diagnostic tests based on the model's predictions. Ultimately, the responsibility for diagnosis and treatment planning would remain firmly within the domain of the healthcare professional.
It's important to acknowledge a limitation in our research—our model was exclusively evaluated on a single dataset. While internal validation through data splits demonstrated promising accuracy, broader acceptance by clinicians requires robust external validation on geographically and demographically diverse patient populations beyond PD. This external validation should ideally be conducted in real-world clinical settings, incorporating the model into existing workflows and evaluating its impact on physician decision-making and patient outcomes.
Although SHAP aids understanding, the complexity of the LightGBM–TabPFN model can hinder explaining its decision-making process for clinical use. This aligns with the concept of causability in interpretability research, as highlighted by Holzinger et al. 43 Causability emphasizes achieving a specific level of causal understanding for human experts, considering effectiveness, efficiency and satisfaction in a given context. To address this, future research will explore methods that incorporate not only SHAP but also expert explanations. This combined approach could provide a more comprehensive and causally grounded understanding of the model's reasoning for clinicians.
While RFECV demonstrated effectiveness in our feature selection process, it is important to acknowledge limitations inherent to this approach, particularly regarding interpretability of the selected features for complex models. Given the high dimensionality of the dataset, future research should involve a comprehensive evaluation of various feature selection methods. This could potentially lead to the identification of an even more effective feature subset that optimizes the performance of dementia prediction models in PD patients. We further acknowledge that achieving the optimal balance between a model's predictive power and the clinical interpretability of its features remains an ongoing area of exploration.
In future endeavors, our objective is to combine insights derived from both clinical data and neuroimaging studies, establishing a more comprehensive prediction framework. This multimodal approach holds the potential to augment accuracy and reliability, ultimately advancing patient diagnosis and facilitating the development of personalized treatment strategies.
Conclusion
In conclusion, our study introduces an innovative hybrid model, the LightGBM–TabPFN, enriched by SHAP analysis. This novel approach significantly contributes to the field, offering advanced capabilities for predictive modeling. The inclusion of SHAP analysis not only improves the model's interpretability but also yields valuable insights into how clinical features impact predictions. Demonstrating superior performance compared to seven state-of-the-art alternative models, our hybrid framework achieved an accuracy of 0.9592 and an AUC of 0.9737 on the test set. This success holds promise for accurately predicting dementia conversion in PD patients. The adaptability of our approach, incorporating robust techniques to address missing data and effectively utilize limited dataset size, suggests its potential usefulness in various clinical settings. Our research lays the groundwork for future investigations, encompassing the extension of this technique to multi-class problems and the integration of clinical-feature-dependent models with other dementia imaging classifiers. Overall, our study makes a significant contribution to the dynamic field of predictive modeling in medical research, particularly within the context of neurodegenerative diseases.
Footnotes
Acknowledgements
The authors thank the Ministry of Health and Welfare for providing the raw data.
Contributorship
Conceptualization: V.Q.T. and B.H.; software: V.Q.T.; methodology: V.Q.T. and B.H.; validation: V.Q.T. and B.H.; investigation: V.Q.T. and B.H.; writing—original draft preparation: V.Q.T.; formal analysis: B.H.; writing—review and editing: B.H.; visualization: H.V.N.; supervision: B.H.; project administration: B.H.; funding acquisition: B.H. All authors have read and agreed to the published version of the manuscript.
Data availability
The data presented in this study are provided at the request of the corresponding author. The data is not publicly available because researchers need to obtain permission from the Korea Centers for Disease Control and Prevention.
Declaration of conflicting interests
The authors declared no potential conflicts of interest with respect to the research, authorship and/or publication of this article.
Ethical approval
This work is not a clinical study, thus ethical approval is not required.
Funding
The authors disclosed receipt of the following financial support for the research, authorship, and/or publication of this article: This research was supported by Basic Science Research Program through the National Research Foundation of Korea (NRF) funded by the Ministry of Education (NRF-2018R1D1A1B07041091, NRF-2021S1A5A8062526, RS-2023-00237287) and the National R&D Program for Cancer Control through the National Cancer Center (HA23C02410061582062860001) and local government-university cooperation-based regional innovation projects (2021RIS-003).
Guarantor
Haewon Byeon.
Informed consent
Informed consent was obtained from all subjects involved in the study.
Institutional review board statement
The study was carried out in accordance with the Helsinki Declaration and was approved by the Korea Workers’ Compensation and Welfare Service's Institutional Review Board (or Ethics Committee) (protocol code 0439001, date of approval 31 January 2018).