
Abstract
Background
Maternal education is often linked to improved awareness. This study aimed to determine the impact of complementary feeding education for mothers using mobile phone applications on the anthropometric indices of Iranian infants.
Methods
This quasi-experiment study involved 86 eligible women divided into two groups—intervention (n = 43) and control (n = 43)—using a multistage sampling method. A researcher-designed questionnaire collected demographic data from parents and infants. Education was delivered through a mobile phone application. Infant anthropometric indices (weight-for-age, length-for-age, and weight-for-length) were measured before and 3 months after the intervention. Statistical analysis included independent t-tests, paired t-tests, chi-square tests (or Cochran–Armitage tests), and analysis of covariance.
Results
The mean weight-for-age Z-scores of the infants in the intervention group were significantly different before (0.07 ± 0.52) and after the intervention (0.37 ± 0.53) (p < .001), while this difference was not significant in the control group. The mean infant weight-for-length Z score in the intervention group was significantly different before (0.09 ± 0.72) and after the intervention (0.29 ± 0.63) (p = .015); however, in the control group, the difference was not statistically significant. The mean length-for-age Z score in the intervention group was significantly different before (0.12 ± 0.68) and after the intervention (0.40 ± 0.76) (p = .006). In contrast, in the control group, the mean length-for-age Z score after the intervention (−0.03 ± 0.84) decreased compared to that before the intervention (0.38 ± 0.75) (p < .001).
Conclusion
The study demonstrated that educating mothers on complementary feeding through mobile phone applications positively impacted infant anthropometric indices. Healthcare providers are encouraged to use this educational approach to prevent infant growth disorders.
Introduction
Nutrition is one of the most important factors in a child's growth and development. 1 Infancy, such as thinness, underweight, and short stature, is a critical stage for optimizing growth and development and preventing malnutrition. 2 Growth assessment plays a vital role in monitoring an infant's health, 3 with one of the simplest methods being the evaluation of anthropometric indices. 4 These indices, including weight-to-length, weight-to-age, and length-to-age, are essential for predicting infant health and nutritional status. 5 They are expressed as the standard deviation or Z_SCORE, 6 indicating the infant's situation compared to a reference population. 7
Disturbances in these indices are more common in developing countries, 8 with Africa and Asia 9 contributing the most to malnutrition cases. Globally, 149 million children are affected by malnutrition, and more than 49.5 million are thin. 10 In Iran, the prevalence of underweight, short stature, and thinness is 13%, 14%, and 11%, respectively. 11 Optimal complementary feeding is crucial for preventing disturbances in anthropometric indices during childhood. 12 Adequate complementary feeding, which is sufficient in content, variety, and frequency, plays a significant role in infant growth and development. 13
Malnutrition is a state of insufficient or excessive intake of nutrients, which leads to negative consequences such as reduced growth and defects in the functioning of body organs, a decreased immune system, and delayed recovery from diseases.14,15 Respiratory diseases, gastrointestinal infections, dysfunction of the central nervous system, intellectual disability, and reduced education are other consequences of malnutrition in children.1,16 Additionally, malnutrition is the cause of death of more than five million children under 5 years of age worldwide. 17
Nutrition education will enhance mothers’ understanding of how to select suitable and safe food ingredients, as well as how to provide nutritious meals. 18 This knowledge can help prevent nutritional disorders in children.19,20 Educational interventions are effective in enhancing mothers’ awareness, attitudes, and behaviors regarding infant nutrition. 21
Madadkon et al. showed that the implementation of educational intervention can be an effective tool for improving mothers’ awareness, attitudes, and performance regarding child nutrition. 22 Additionally, the results of the study by Kazemi et al. showed that educational intervention has a significant effect on the knowledge, attitudes, and behaviors of mothers regarding complementary feeding. 23
Face-to-face educational methods have limitations such as long distance to the place of education, lack of flexibility in time, 24 lack of educational staff, lack of educational space, and limited capacity to accept face-to-face education. 25 To solve these limitations, it is necessary to choose a suitable platform for providing interventions innovatively and effectively so that they can be used in a wide range of the population by ensuring the quality and effectiveness of the intervention. 26 One of the methods that is effective in health education and increasing learning is the use of mobile phones and applications. In recent years, the use of mobile phones, pocket computers, and smartphones has increased tremendously 27 ; thus, the number of people using mobile phones worldwide is more than 5 billion. 28 Due to the rapid development of mobile phone technology and wireless devices, users can access information quickly and easily at any time and in any place. 17 Currently, mobile phone technologies are enabling the development of mobile health interventions, which are a useful and cost-effective way to disseminate information about proper nutrition and an important source of motivation for behavior change. 15 Community-based nutrition interventions using mobile health are an innovative and effective way to share knowledge. To improve attitudes and practices related to infant feeding among mothers. 29 The implementation of mHealth technology in India 30 has had encouraging results in improving the precision of malnutrition screening and minimizing errors in child growth classification among frontline health workers in Indonesia. 31 By using a mobile application, a significant improvement in the accurate categorization of growth status could be achieved. According to Nemerimana et al. 32 mHealth nutritional interventions have the potential to reduce the prevalence of stunting, underweight, and inadequate interval growth while improving nutritional outcomes in children.
Despite extensive database searches by the research team, there are limited studies on the effects of complementary feeding on the anthropometric indices of infants in Iran. This study aimed to determine the impact of complementary feeding education for mothers using mobile phone applications on the anthropometric indices of Iranian infants. By leveraging mobile technology, this intervention seeks to improve mothers’ awareness and practices regarding infant nutrition, ultimately positively impacting infant growth and development.
Materials and methods
Research design and participants
This was a quasi-experimental study with 86 participants, 43 in the intervention group and 43 in the control group, consisting of mothers who met certain criteria. Inclusion criteria included informed consent to participate, primiparous mothers with no history of physical or mental illness, alcoholism, smoking, or drug dependence (self-reported), full-term infants and healthy six-month-old infants with normal anthropometric indices, exclusive breastfeeding in the first six months, ability to read and write, Iranian nationality, ownership of an Android phone compatible with the intervention application, knowledge of using mobile applications, no chronic diseases and no medical degree. Eligibility criteria for the control group were the same as for the intervention group, except that participants were not required to own a cell phone. Exclusion criteria included lack of exposure to educational content, and failure to respond to calls from researchers.
Sampling
The sample size calculation was performed for the comparison of two means using G*Power version 3.1.9.2. With an effect size of 0.7 (Cohen's d) for outcome scores, 23 a power of 0.8, and an alpha value of 0.05, 34 infants would be necessary for each group. Assuming a potential drop-out rate of 20%, 43 infants were needed in each group.
Participants were selected through multistage sampling from 16 health centers in Rasht city and divided into four clusters based on the four geographical regions of Rasht city, North, South, East, and West. Then, using a random number table, eight centers were selected by assigning two centers to each region according to the allocated proportion. Sampling was then carried out stepwise. The block randomization method was used with blocks of four equal-sized blocks (ratio 1:1). The Sealed Envelope Ltd online randomization service was used to create the randomization list used. In the random block sampling method, participants were assigned numbers 1 to 86. Then a table with 22 rows called Block was created and each block had four parts and each part was named A and B. The next step was to insert the numbers into each part and all the numbers into the blocks. Twenty-two quadruple blocks were randomly drawn and random blocks were placed in opaque, sealed envelopes. When each eligible person enters the study, the enrolled person's envelope number is opened and the type of control or test group (A and B) is indicated.
Data collection
A researcher-developed questionnaire collected demographic data on parents (age, education level, employment status, adequacy of monthly income) and infants (gender, age, birth weight, height, current weight and length, and type of milk consumed by the infant). Eight faculty members from various disciplines evaluated the demographic questionnaire for face validity.
Procedure
Participants were recruited using three methods: through their primary care providers in socioeconomically disadvantaged communities at selected comprehensive health centers; personal interviews by researchers; or advertising posters. All participants completed the demographic questionnaire. Infant anthropometric indices were then determined before the intervention (in routine care of 6-month-old infants) in both intervention and control groups. In the control group, the mother received usual care (routine nationwide supplementary nutrition recommendations) from caregivers in comprehensive health centers. Eligibility criteria for participation were the same as in the intervention group, except that participants were not required to own a cell phone. Anthropometric measurements were performed using standardized equipment and WHO Anthro software was used to calculate Z-scores for weight-for-age, length-for-age, and weight-for-length indices.
The infant's weight was measured with a graduated electronic scale (Seca, Germany) with an accuracy of 0.01 kg (10 g), and the infant's length in the lying position was measured with an accuracy of 0.1 cm. The anthropometric indices “weight-for-age,” “length-for-age,” and “weight-for-length” were measured using the World Health Organization Z-score standard. The weight-for-age index was divided into five groups: extremely underweight (Z < −3), underweight (−3 ≤ Z < −2), likely to be overweight (Z > +1), requiring further investigation in terms of weight (−2 ≤ Z ≤ +1 and unknown growth trend or stopped growth trend or child's weight loss), and normal (−2 ≤ Z ≤ +1 and growth trend parallel to the median or child's weight gain); the height-for-age index was divided into five groups: extremely short stature (Z < −3), short stature (−3 ≤ Z˂−2), very tall (Z > +3), requiring further investigation in terms of height (−2 ≤ Z ≤ +3 and unknown height growth trend or stopped height growth trend or slow height growth trend), and normal (−2 ≤ Z ≤ +3 and growth trend parallel to the median or upward growth trend); and the weight-to-height index was divided into six groups: extremely thinness (Z˂−3), thinness (−3 ≤ Z˂−2), obesity (Z˃+3), overweight (+2 < Z ≤ +3), risk of overweight (+1˂Z ≤ +2), and normal (−2 ≤ Z ≤ +1). 33
For the intervention group, the application was installed on mobile phones. The educational content was taken from the book on complementary foods published by the Iranian Ministry of Health and Medical Education. 34 The educational content consisted of 16 sections, including nutrition in the first six months of life, the importance of complementary feeding, the definition of complementary feeding, the risks of early and late initiation of complementary feeding, the principles of complementary feeding according to the age of the infant, unsuitable or prohibited foods for Infants, inappropriate feeding behavior, introduction of allergenic foods, the role of food groups (bread and grains, milk and dairy products, meat, legumes, eggs as well as nuts, vegetables, and fruits) on the growth and health of infants, cooking recipes, food nutrition methods, food fortification methods, taking nutritional supplements in infants and caring for the child's teeth; The desired content was extracted from these sections. The validity of the educational content was confirmed by eight faculty members specializing in reproductive health, midwifery, and health education.
Twelve weeks after the intervention, the anthropometric indices of the infants in both the intervention and control groups were evaluated. In the intervention group, mothers were contacted every week to remind them and answer their questions. Out of 86 people, 4 people were in the intervention group (2 people who did not respond to the researcher's request to continue the study process, 1 person who was unwilling to continue participating in the study, and 1 person who did not regularly follow up with the training content) and 5 people in the control group (3 people who did not respond to the researcher's request to continue the study process and 2 people who were unwilling to continue participating in the study) were excluded from the study.
Statistical analysis
The statistical analysis of the data was carried out using descriptive statistical methods, frequency, mean, and standard deviation. The Shapiro–Wilk and Kolmogorov–Smirnov statistical tests were used to check the homogeneity of variances and normal distribution of the variables. To compare the individual variables of mothers and children between the two control and intervention groups, an independent t-test was used for quantitative variables and a chi-square test (or Cochran–Armitage test for trend) for qualitative variables. Paired t-tests were used to compare the mean anthropometric indices in both the control and intervention groups before and after the intervention. The mean anthropometric indices between the two intervention groups and the control group after the intervention were compared using analysis of covariance (ANCOVA). In addition, Cohen's d effect size for the paired t-test and the partial η-squared (η2p) for the ANCOVA were reported. η2p values of 0.01–0.06, 0.06–0.14, and >0.14 indicate small, medium, and large effect sizes, respectively. For Cohen's d, values of 0.2–0.5, 0.5–0.8, and >0.8 indicate small, medium, and large effect sizes, respectively. The Z scores of the anthropometric indices of the infants were calculated using WHO Anthro 3.2.2 software. Data analysis was performed using SPSS version 16, with significance set at p < .05.
Results
There were no statistically significant differences in the individual or social variables between the control and intervention groups. The mean ages of mothers and fathers were 31.39 ± 4.62 and 34.06 ± 4.63 years, respectively, with most having an academic education. Family income was deemed adequate by 89.6% of the participants. Among the 77 infants, 42 (54.5%) were female. The mean birth weight was 3214.4 ± 324.5 g, and the mean birth length was 49.64 ± 1.78 cm (Table 1).
Frequency distribution of demographic characteristics of participants in the two groups.
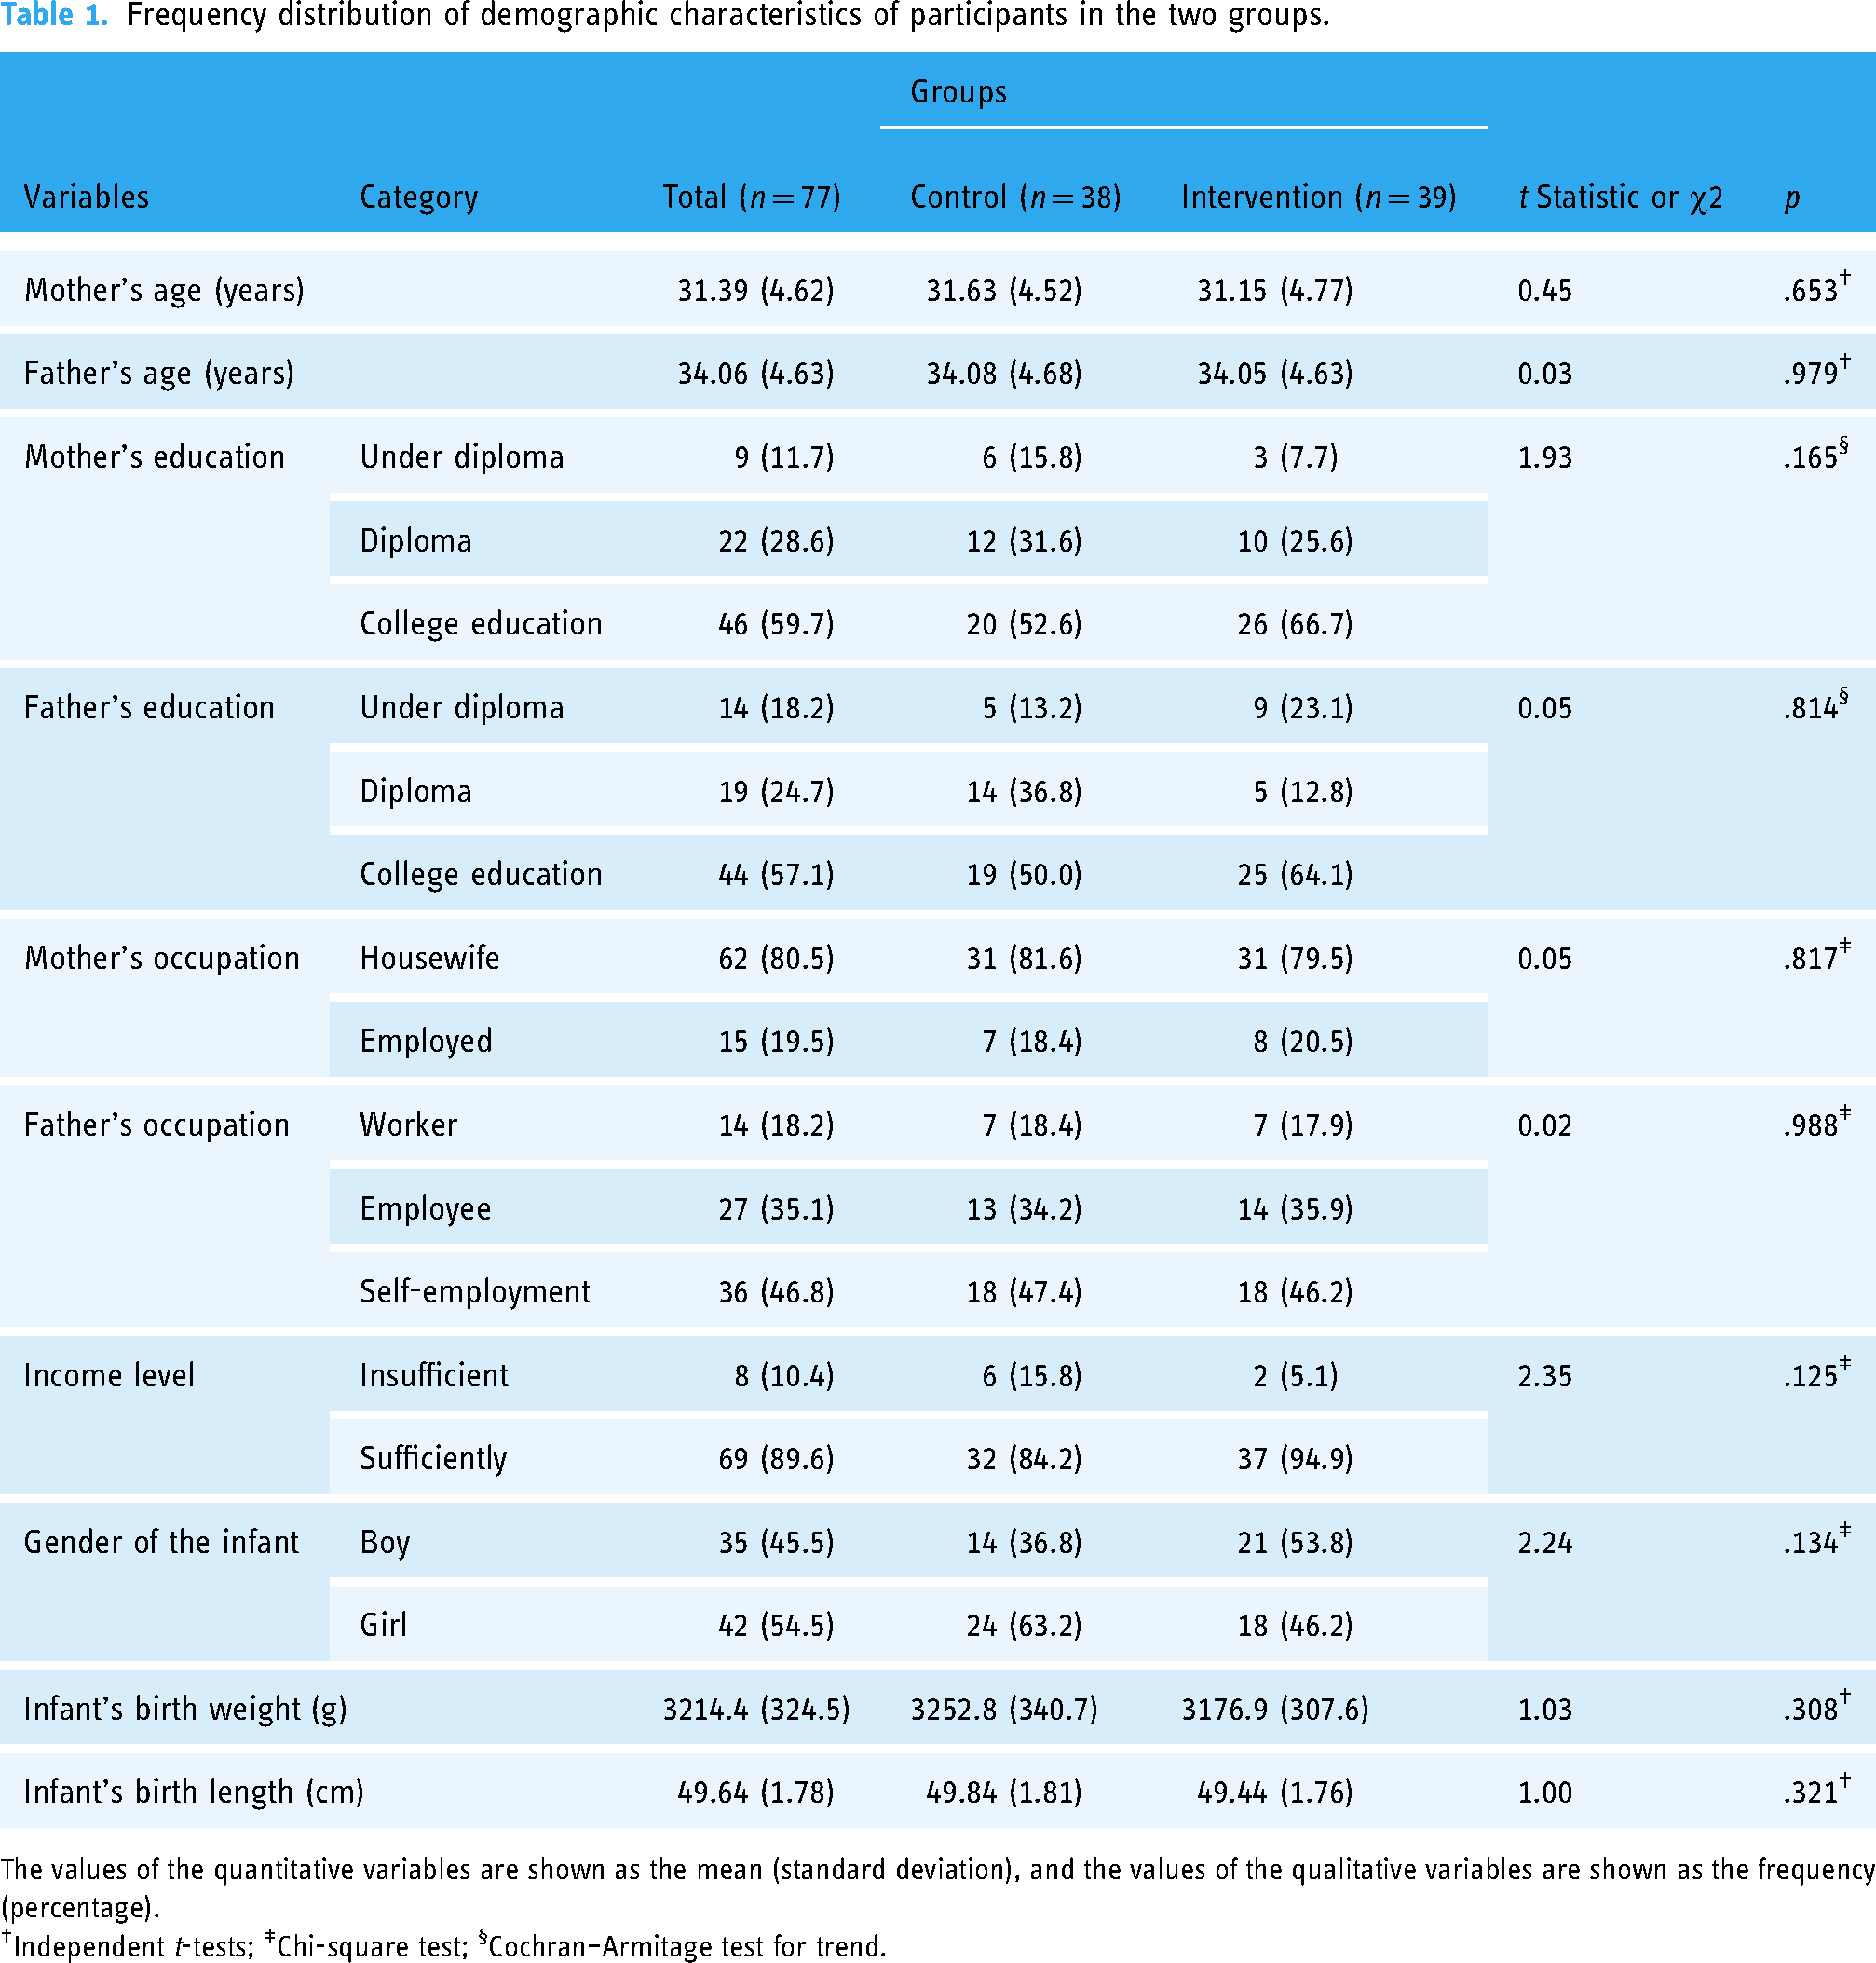
The values of the quantitative variables are shown as the mean (standard deviation), and the values of the qualitative variables are shown as the frequency (percentage).
Independent t-tests; ‡Chi-square test; §Cochran–Armitage test for trend.
The mean weight-for-length Z scores of the infants in the intervention group before and after the intervention were 0.09 ± 0.72 and 0.29 ± 0.63, respectively, and those in the control group before and after the intervention were 0.15 ± 0.75 and 0.34 ± 0.77, respectively.
In other words, the mean weight-to-length Z score of infants in the intervention group at 9 months was 0.20 units (95% CI: 0.04, 0.35) greater than that at 6 months (p = .015). The mean weight-for-length Z score of infants in the control group at 9 months was also greater than that at 6 months, but this increase was not statistically significant.
In the intervention group, the mean weight-for-age Z score at 9 months was 0.30 units (95% CI: 0.21, 0.39) higher than that at 6 months (p < .001); in the control group, there was no statistically significant difference in the mean weight-for-age Z score between 6 months and 9 months (p = .233).
In the intervention group, the mean length-for-age Z score at 9 months was 0.28 units (95% CI: 0.09, 0.48) greater than that at 6 months (p = .006), while in the control group, the mean length-for-age Z score at 9 months was reduced by 0.41 units (95% CI: 0.21, 0.61) compared to that at 6 months (p < .001) (Table 2).
Comparison of the anthropometric indices of infants before and after the intervention in the two groups.
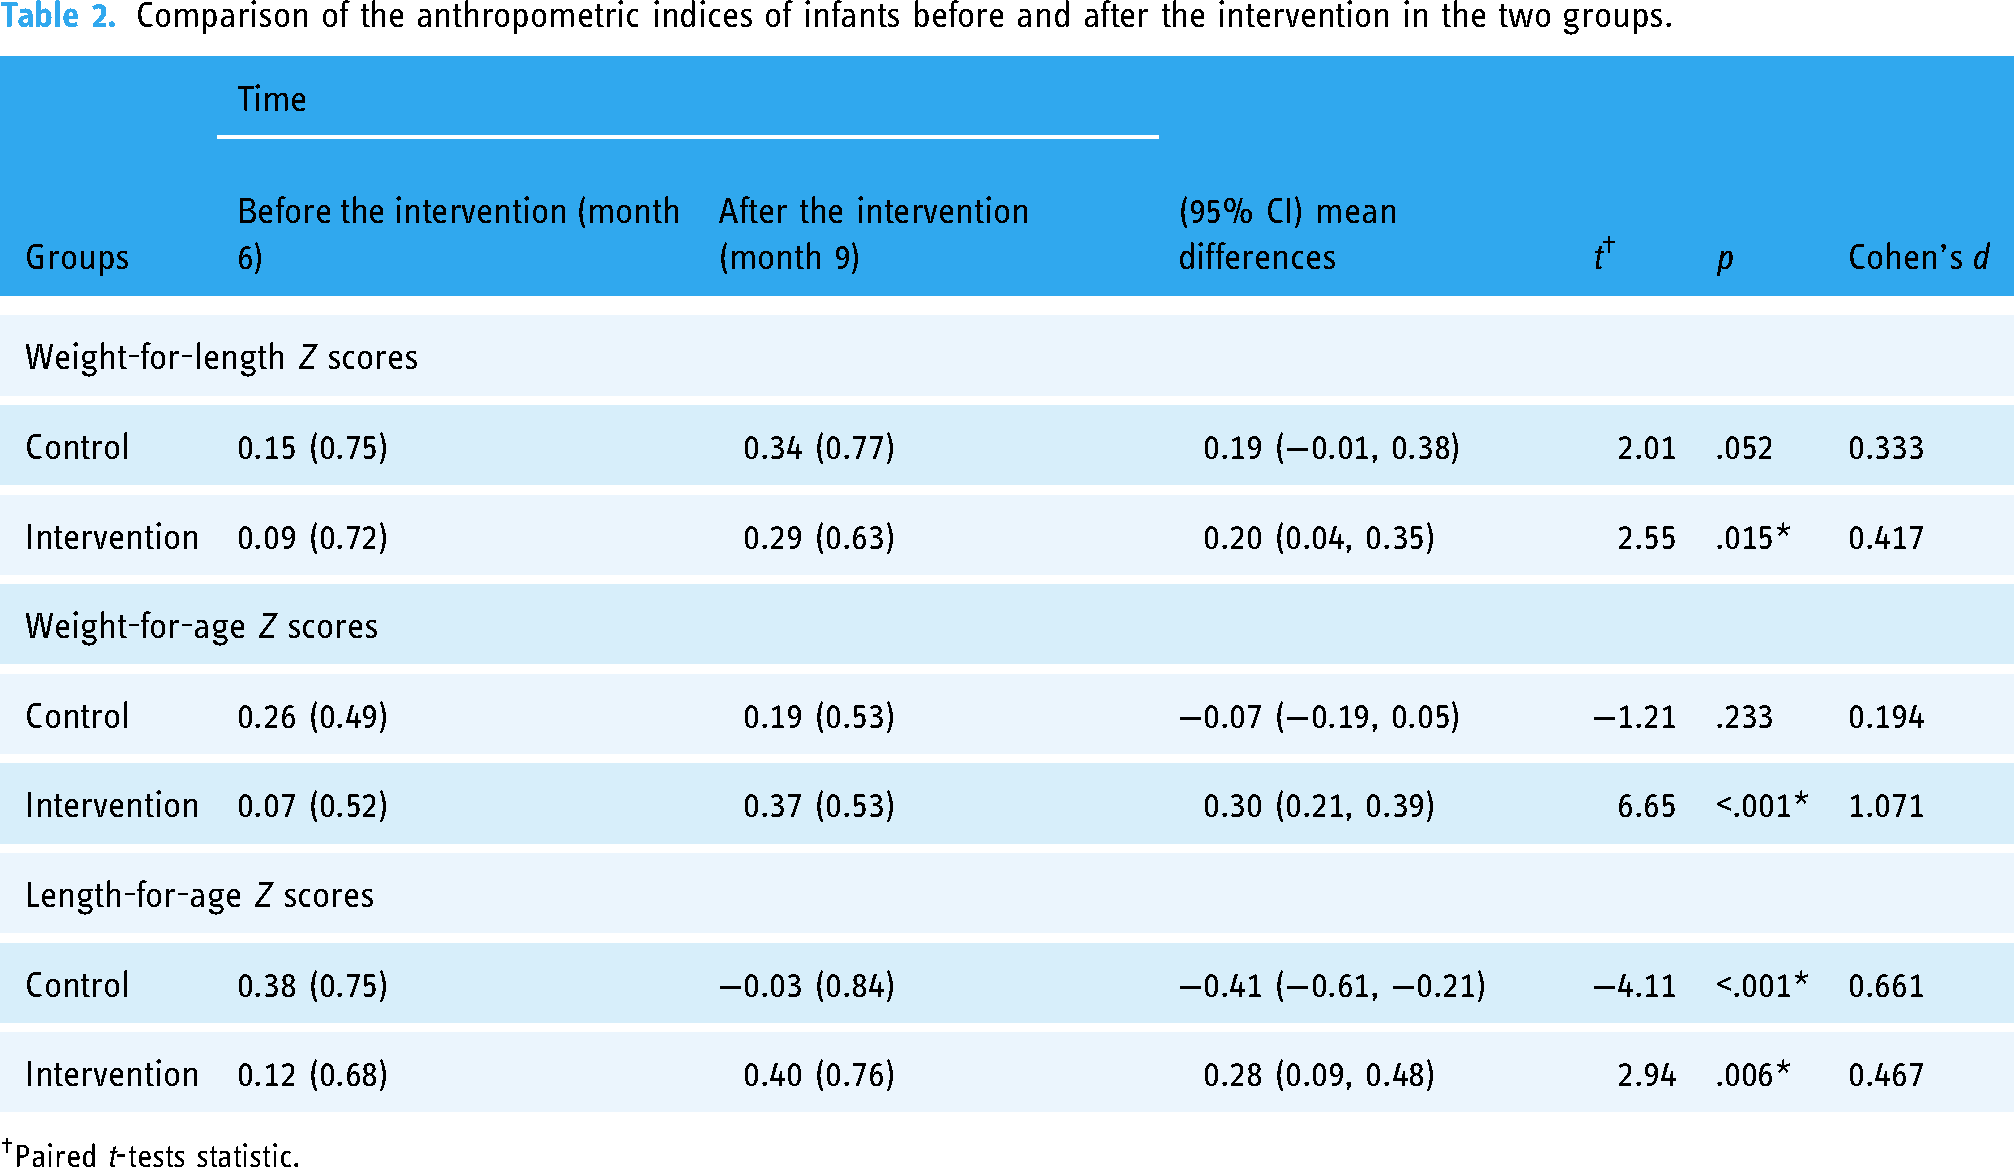
Paired t-tests statistic.
At the age of 9 months, no statistically significant difference was observed between the adjusted mean Z scores of weight for length between the control and intervention groups (F (1, 74) = 0.01, p = .949, ηp2 = 0.001). The adjusted mean Z score weight-for-age of infants at 9 months of age in the intervention group was 0.34 units (95% CI: 0.19, 0.49) higher than that in the control group (F (1, 74) = 21.66, p < .001, ηp2 = 0.226). The adjusted mean Z score for length and age of infants was also 0.63 units (95% CI: 0.36, 0.91) greater than that of the control group (F (1, 74) = 21.39, p < .001, ηp2 = 0.224). This increase was statistically significant (Table 3).
Comparison of the anthropometric indices of infants in the two groups after the intervention (9 months).
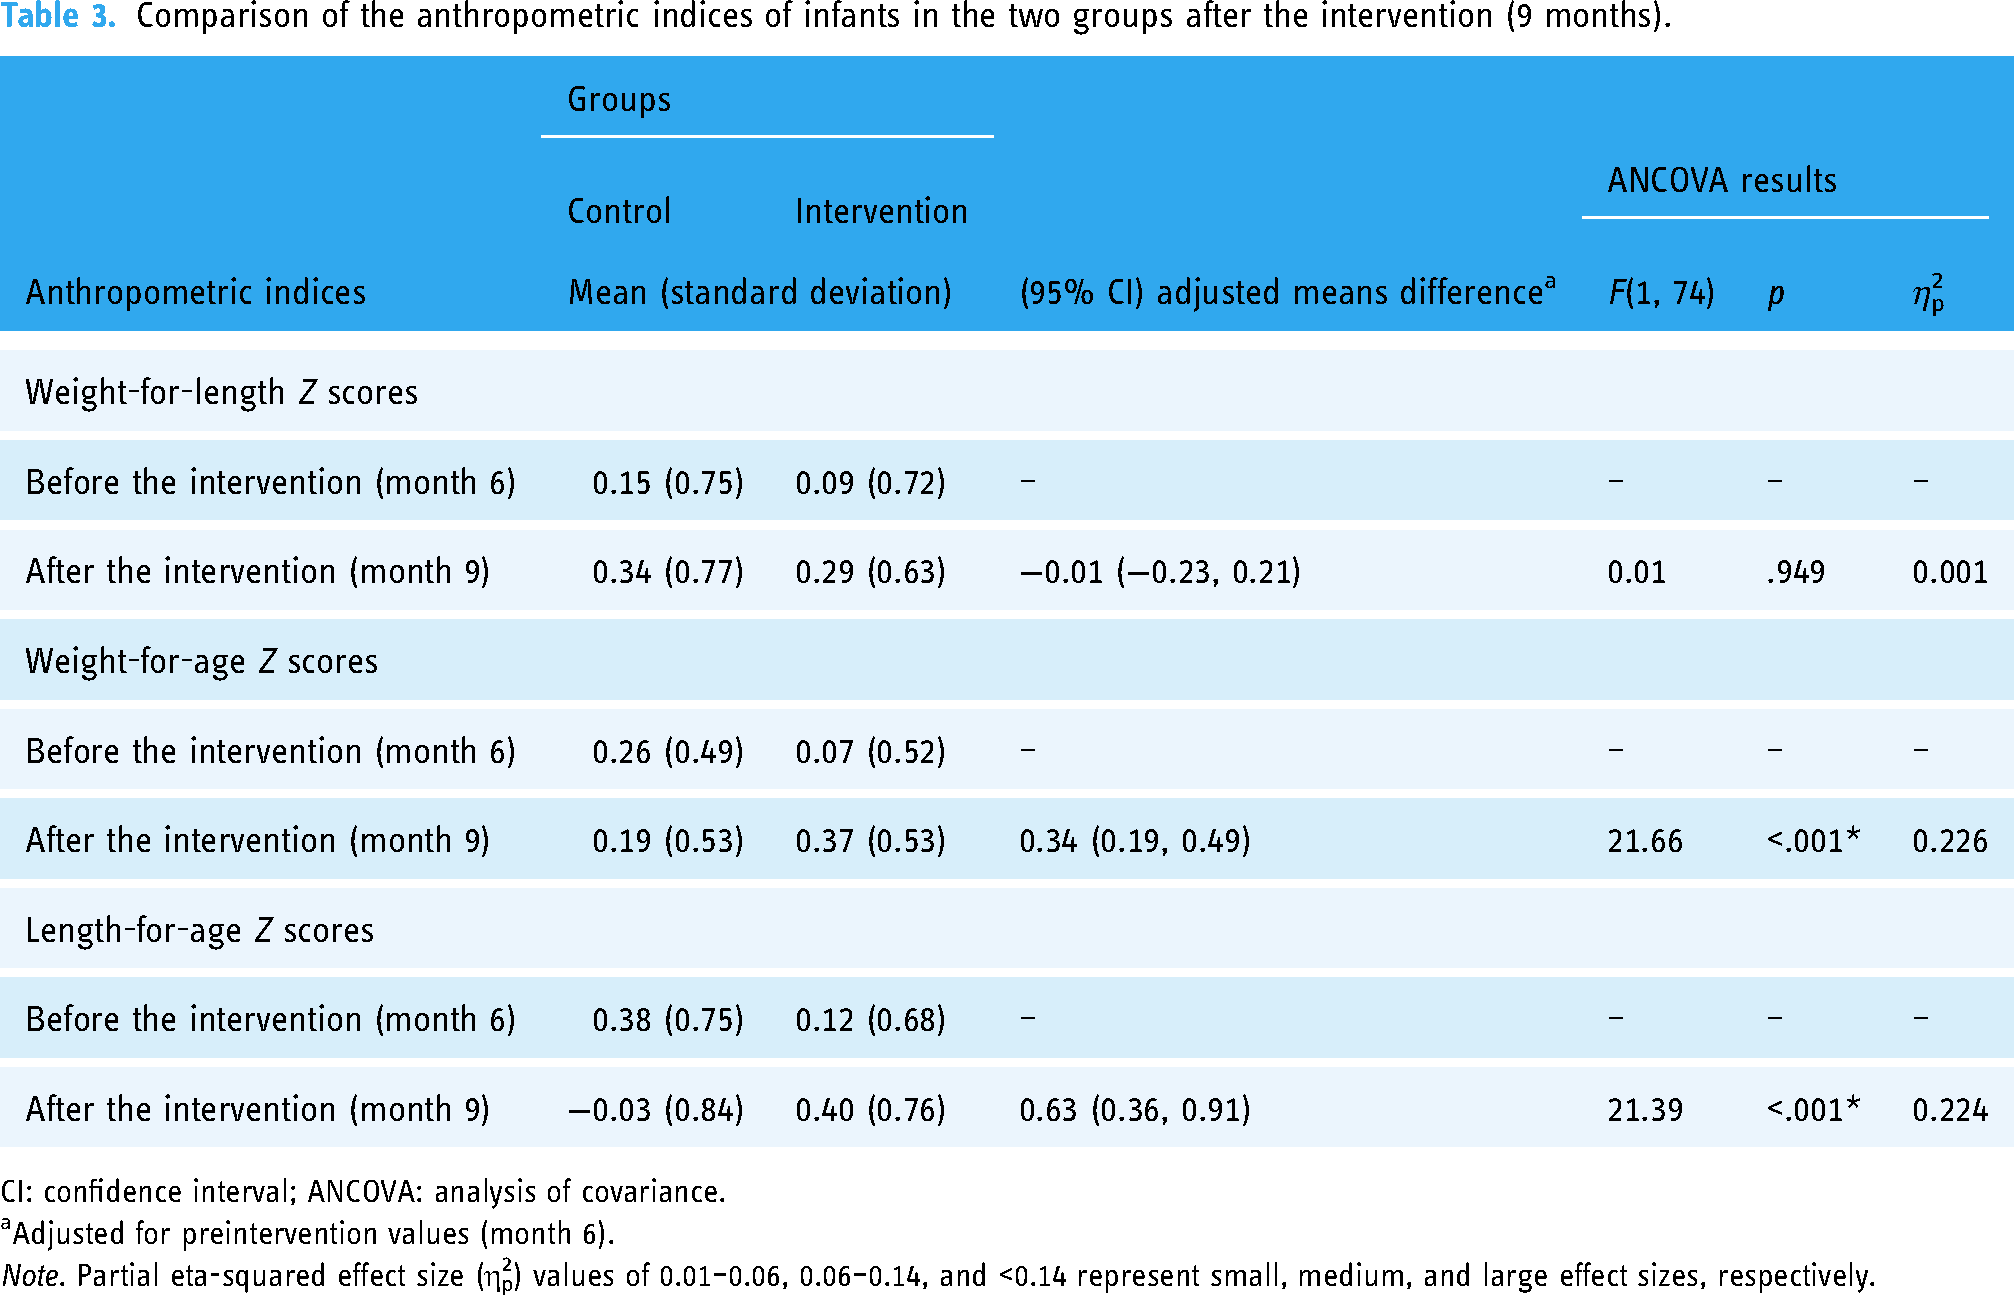
CI: confidence interval; ANCOVA: analysis of covariance.
Adjusted for preintervention values (month 6).
Note. Partial eta-squared effect size (η2p) values of 0.01–0.06, 0.06–0.14, and <0.14 represent small, medium, and large effect sizes, respectively.
Discussion
The results of this study show that supplementary nutritional education for mothers using mobile phone applications has a positive effect on improving infants’ anthropometric indices. All indices including weight-for-age (0.30 units higher than at 6 months), weight-for-length (0.20 units higher than at 6 months), and length-for-age (0.28 units higher than after 6 months) improved after the educational intervention. This study represents the first assessment of the impact of complementary feeding using mobile phone applications in Iran.
The increase in mean weight-for-length Z-score of infants in the intervention group was statistically significant at 9 months compared to 6 months (p = .015), while this increase was not statistically significant in the control group. These results are consistent with the study by Seyyedi et al. 35
According to Ayalew and Belachew's 36 studies, infant thinning rates remained unchanged in the intervention group and increased by 0.3% in the control group after the intervention. The weight-to-length index is influenced by factors such as food intake, maternal feeding habits, and acute infectious diseases of the infant. The difference in results of studies may be attributed to these factors. In addition, the weight-to-length index may fluctuate in different months and seasons due to fluctuations in food availability and the infant's health. In Ayalew and Belachew's 36 studies, information on infant morbidity was collected through mothers’ reports during outbreaks, which may not be a reliable method and could be a participant to recall bias.
The increase in the mean weight-for-age Z-score of infants in the intervention group at 9 months compared to that at 6 months was statistically significant (p < .001), while there was no significant difference in the control group. Similar studies12,35,37 also showed a substantial increase in the weight-for-age index in the intervention group after the intervention. However, some studies36,38–41 showed no improvement in the weight-age index of infants after the procedure. The different results could be due to differences in educational content, methods, sampling techniques, duration of the intervention, and participants’ cultural, social, economic, and racial backgrounds. Unlike previous studies that used face-to-face teaching, the present study used a mobile phone application for teaching without restrictions on time, location, or access to educational content.
The increase in the mean age-weight Z-score of infants in the intervention group at 9 months compared to that at 6 months was statistically significant, while there was no significant difference in the control group. In contrast to the control group, the increase in the mean length-for-age Z-score of infants in the intervention group at 9 months was statistically significant compared to that at 6 months (p = .006). These results are consistent with some studies.35–38,40,42
Infants’ adjusted mean weight-for-length Z-score at 9 months of age was not significantly different between the control and intervention groups (0.949); In this sense, the results of the present study are consistent with the studies by Martinez et al., 38 Saaka et al., 39 and Rahman et al. 42
The adjusted mean Z-score of the infant weight-to-age ratio at 9 months was significantly higher in the intervention group than in the control group (<0.001). These results were consistent with those of Seyyedi et al. 35 and Sharma et al. 40
In the study by Saaka et al. 39 After the intervention, the average weight-for-age Z-score of infants in the intervention group was 0.67 points lower than that in the control group. 39 In the study by Martinez et al., the average weight-for-age Z-score of infants in the intervention group was 0.08 units higher than that in the control group, although this increase was not statistically significant. 38
The possible reasons for the lack of alignment of the results of the present study with other studies include the older age of the infants at the time of participation in the study; differences in individual characteristics; the environmental, cultural, and economic conditions of the study areas; the education level of the mothers; and differences in the content and method of education used in these studies.
In the present study, with the control of 6-month scores, the adjusted mean Z score of infants’ length-to-age at 9 months of age in the intervention group was significantly greater than that in the control group (<0.001). The results of the present study were consistent with those of studies by Sharma et al. 40
Saaka et al. reported a lack of linear growth that may be due to the older age of the infants; the participants of Saaka et al. study were malnourished infants aged 6 to 36 months. Greater growth is usually seen in younger infants before dwarfism becomes common. In addition, infant malnutrition occurs due to the interaction of various demographic factors, motherhood, gender, home environment, feeding method, hand washing, and other health measures. Increased awareness of nutrition and preventable health problems while addressing other barriers such as food insecurity and household socioeconomic constraints can significantly contribute to infant development.
Limitations
This study has several limitations. The sample size was relatively small but large enough to allow effective implementation of the design; another major limitation of this study is that owning a cell phone was a requirement and most participants already had a diploma. The participants in this study were mobile phone users and had a high level of digital literacy. Additionally, the program has been tested in an urban environment and its transferability to other urban environments is unknown. Finally, follow-up of more than three months may be required to fully capture some infant behaviors, particularly the onset of teething in toddlers.
Conclusion
This study confirms the positive influence of supplementary nutritional education for mothers using mobile phone applications on infants’ anthropometric indices. A three-month intervention resulted in improvements in weight-for-age, weight-for-length, and length-for-age indices in infants. This approach is significant because it provides a more accessible and affordable form of education and allows mothers to improve the nutritional status of their infants at any time and place. Using this application as an innovative educational tool can effectively increase mothers’ awareness of complementary feeding practices. Future studies should consider examining the long-term effects of maternal complementary nutrition education on malnourished children as well as the effects of nutritional education for both parents on anthropometric indices.
Supplemental Material
sj-docx-1-dhj-10.1177_20552076241272558 - Supplemental material for The impact of complementary feeding education for mothers using mobile phone applications on the anthropometric indices of Iranian infants
Supplemental material, sj-docx-1-dhj-10.1177_20552076241272558 for The impact of complementary feeding education for mothers using mobile phone applications on the anthropometric indices of Iranian infants by Fariba Mousavi Ezmareh, Zahra Bostani Khalesi, Fatemeh Jafarzadeh Kenarsari and Saman Maroufizadeh in DIGITAL HEALTH
Footnotes
Acknowledgments
We are grateful to all who participated in this study.
Contributorship
FME: conceptualization, methodology, investigation, data curation, visualization, project administration, and writing–original draft preparation. ZBK: methodology, investigation, data curation, and writing–original draft preparation. FJK: conceptualization, methodology, supervision, writing, reviewing, and editing. SM: formal analysis, writing, reviewing, and editing. All the authors have read and approved the final manuscript.
Declaration of conflicting interests
The authors declared no potential conflicts of interest with respect to the research, authorship, and/or publication of this article.
Ethical approval
The research was approved by the Research Ethics Committee of Guilan University of Medical Sciences under opinion No. IR.GUMS.REC.1401.171. All participants provided informed consent in accordance with the Declaration of Helsinki. Additionally, all methods were performed in accordance with the relevant guidelines of the journal. They were guaranteed the right to withdraw from the research at any time and the confidentiality of their personal information.
Funding
The authors received no financial support for the research, authorship, and/or publication of this article.
Guarantor
ZBK.
Data availability statement
The data that support the findings of this study are available from the corresponding author upon reasonable request.
Supplemental material
Supplemental material for this article is available online.
References
Supplementary Material
Please find the following supplemental material available below.
For Open Access articles published under a Creative Commons License, all supplemental material carries the same license as the article it is associated with.
For non-Open Access articles published, all supplemental material carries a non-exclusive license, and permission requests for re-use of supplemental material or any part of supplemental material shall be sent directly to the copyright owner as specified in the copyright notice associated with the article.