
Abstract
Objective
Tuberculosis (TB) remains a significant global infectious disease, posing a considerable health threat, particularly in resource-constrained regions. Due to diverse datasets, radiologists face challenges in accurately diagnosing TB using X-ray images. This study aims to propose an innovative approach leveraging image processing techniques to enhance TB diagnostic accuracy within the automatic segmentation and classification (AuSC) framework for healthcare.
Methods
The AuSC of detection of TB (AuSC-DTB) framework comprises several steps: image preprocessing involving resizing and median filtering, segmentation using the random walker algorithm, and feature extraction utilizing local binary pattern and histogram of gradient descriptors. The extracted features are then classified using the support vector machine classifier to distinguish between healthy and infected chest X-ray images. The effectiveness of the proposed technique was evaluated using four distinct datasets, such as Japanese Society of Radiological Technology (JSRT), Montgomery, National Library of Medicine (NLM), and Shenzhen.
Results
Experimental results demonstrate promising outcomes, with accuracy rates of 94%, 95%, 95%, and 93% achieved for JSRT, Montgomery, NLM, and Shenzhen datasets, respectively. Comparative analysis against recent studies indicates superior performance of the proposed hybrid approach.
Conclusions
The presented hybrid approach within the AuSC framework showcases improved diagnostic accuracy for TB detection from diverse X-ray image datasets. Furthermore, this methodology holds promise for generalizing other diseases diagnosed through X-ray imaging. It can be adapted with computed tomography scans and magnetic resonance imaging images, extending its applicability in healthcare diagnostics.
Keywords
Introduction
Tuberculosis (TB) is a contagious bacterial infection primarily affecting the lungs but can also extend to other parts of the body such as the brain, spine, and bones. It spreads through the air when an infected person coughs, sneezes, or talks. 1 Considered one of the most perilous diseases worldwide following HIV infection, TB continues to pose a significant public health challenge, with approximately 10 million new cases reported globally according to the 2019 Global Tuberculosis Report.2,1 In 2013, the World Health Organization (WHO) reported 9 million TB-related deaths, with 1.5 million attributed directly to TB and 360,000 cases occurring concurrently with HIV. 3 TB stems from the bacteria Mycobacterium in humans. Despite years of research, existing TB screening tests exhibit low sensitivity or specificity, rendering them unreliable for detection. Adequate and timely diagnosis and prompt treatment remain the sole effective measures to combat TB.
Clinical trials suggest a curability rate of 90% for TB cases, 2 with the majority of cases and fatalities concentrated in developing countries. However, the extensive research on TB detection has yielded varied outcomes, often limited to specific datasets. This prompted research objectives aimed at proposing a comprehensive framework for TB detection, integrating preprocessing, segmentation, and classification techniques, and assessing its efficacy across diverse datasets.
The automatic segmentation and classification (AuSC) framework, introduced for healthcare applications, focuses on two key aspects: diagnosing Ccoronary artery disease (AuSC-CAD) 4 and detecting TB (AuSC-DTB) using machine learning (ML) techniques. The AuSC-DTB framework employs a hybrid approach to enhance TB detection accuracy in X-ray images. This approach involves preprocessing X-ray images with a median filter to enhance textual properties, segmenting the images to obtain the region of interest (ROI), and employing various feature extraction techniques to identify relevant areas. These extracted features are then used for classification and pulmonary TB detection. 5
The proposed AuSC-DTB hybrid approach is evaluated across four datasets (Japanese Society of Radiological Technology (JSRT), Montgomery County, National Library of Medicine (NLM), and Shenzhen) to ensure high accuracy across various scenarios. Implementation of this framework could facilitate easier TB detection using chest radiographs, particularly benefiting early-stage diagnosis in rural areas and potentially reducing TB-related mortality. The system’s generalizability is emphasized, enabled by the combination of image processing techniques, which ensures effectiveness across diverse dataset types and formats while maintaining high accuracy.
The rest of the article is organized as follows: the “Related work” section provides a brief overview of related work, while the “Proposed hybrid approach AuSC-DTB” section explores the AuSC framework, detailing datasets, the research process, and other pertinent aspects. The “Results evaluation and discussion” section comprehensively discusses the outcomes of the proposed hybrid approach and related discussions, with analysis and comparisons to current studies. Finally, in the “Conclusion” section, we summarize the article and offer guidelines for future research.
Related work
TB stands as the fifth deadliest cause of death globally, accounting for 1.5 million deaths annually. 3 This disease remains a significant medical challenge in resource-constrained regions with limited diagnostic and treatment resources. TB primarily spreads through inhaling infectious bacteria released during coughing and sneezing, resulting in lung infections. 5 TB diagnosis is complicated due to a wide range of symptoms, including nodules, cavities, and consolidations, which make many screening tests unreliable. 6 Despite a 90% curability rate, TB continues to have high fatality rates due to its complex physiological and pathological effects, particularly on the lungs. 7 The rising death rate from TB is a global concern, and timely detection and treatment are essential to prevent its spread. Common TB diagnostic methods include skin tests, sputum tests, blood tests (interferon-gamma release assays), and chest X-rays. 8 However, these methods can be slow, expensive, and inefficient. For example, diagnosing pulmonary TB in Malaysia may take anywhere from 72 hours to 8 weeks, primarily using radiometric methods. 9
Over the last decade, there has been explosive growth in research exploring machine learning techniques for analyzing chest X-ray (CXR) images for screening cardiopulmonary abnormalities. In particular, we have observed a strong interest in screening for TB. This interest coincided with the spectacular advances in deep learning (DL) primarily based on convolutional neural networks (CNNs). These advances have resulted in significant research contributions in DL techniques for TB screening using CXR images. 10
Improving diagnostic tools and methods is crucial to combat TB effectively, as timely and accurate diagnosis is a critical factor in its prevention and control.
A study presented a DL method for TB detection using CXRs. They employed CNNs to classify X-ray images as either indicative of TB or healthy. The depth of the CNN architecture was crucial for performance, and they achieved high accuracy using three-dimensional (3D) input images. Their approach was tested on two datasets, Shenzhen and Montgomery, and yielded an accuracy of 94.73% with the Adam optimizer. 5 A novel method is introduced a novel method that combines an artificial ecosystem optimization (AEO) algorithm with MobileNet for TB detection. This innovative approach aimed to reduce resource consumption and enhance image classification. They applied their method to the Shenzhen dataset and Dataset 2, achieving high accuracy rates of 90.2% and 94.1%, respectively, outperforming other optimization techniques. 11 A set of DL models for TB detection using various datasets, including the pediatric pneumonia dataset, RSNA pneumonia dataset, Indiana dataset, and NLM dataset. They trained custom CNN models and pre-trained models like VGG-16, Inception-V3, Inception ResNet-V2, and DenseNet-121. Their ensemble methods, such as stacking, significantly improved prediction accuracy and robustness, with precision and area under the curve (AUC) scores reaching high levels. 12 These studies showcase the effectiveness of DL in TB detection, with various innovative approaches and high levels of accuracy achieved in different datasets and with diverse optimization techniques and model ensembles.
The U-Net model extracts the region of interest from CXRs, and the segmented images are fed to the DL models for feature extraction. Eight different CNN models are employed in our experiments, and their classification performance is compared based on three publicly available CXR datasets. The U-Net model achieves segmentation accuracy of 98.58%, intersection over union (IoU) of 93.10, and a Dice coefficient score of 96.50. Our proposed stacked ensemble algorithm performed better by achieving accuracy, sensitivity, and specificity values of 98.38%, 98.89%, and 98.70%, respectively. Experimental results confirm that segmented lung CXR images with ensemble learning produce a better result than un-segmented lung CXR images. 13
A comprehensive review of the state-of-the-art DL models proposed for the automatic detection of TB from frontal CXR images. CNNs and pre-trained CNNs are the most prominent DL algorithms used in this regard. The study discusses the various datasets, data preprocessing, feature extraction, and classification techniques used in the proposed models. Performance evaluation metrics adopted by authors in the reviewed papers have been discussed. The study also covers various visualization techniques, which provide a clear picture of “what” and “where” the network is learning. This clears the illusion of DL models being a black box, slowing the full rollout of DL models in healthcare. Finally, various limitations identified in the literature and future directions for DL application in TB detection are illuminated in the study. 14
The studies explored using CNNs for TB detection in CXR images.15,16 Mostofa et al. applied CNN to CXR datasets from Montgomery and Shenzhen, achieving an average classification accuracy of
These studies collectively emphasize the potential of DL, particularly CNN and DCNN models, for TB detection in CXRs. They highlight the importance of data preprocessing and model selection in achieving high accuracy and robust performance.
In Szilard’s 2018 study, CXR images were enhanced with histogram equalization, and a comprehensive feature selection model was used for TB detection. Neural network-based classification yielded impressive results, with an accuracy (ACC) of 0.99 and an AUC of 97.03%. The approach outperformed current systems and radiologists’ decisions, highlighting its effectiveness in TB detection. 18
A three-phase TB screening approach using CXRs was presented. 6 The method involved adaptive threshold-based image segmentation and feature extraction. The authors utilized the JSRT database, containing 247 images, with 73% allocated for the training dataset and 27% for testing. Features were extracted from lung regions to perform various tasks related to shape, borders, and textures inspired by object detection properties. SVM classification was employed, and the system’s performance was evaluated using the ROC curve, sensitivity, accuracy, and specificity. The method achieved 75.2% accuracy and an 88% AUC, correctly classifying 70 out of 93 test samples. Fares et al. introduced speeded up robust features (SURF) descriptors for TB detection. They also explored the impact of network size on SURF accuracy and created a hierarchy of SURF features, comparing them to conventional SURF. Using the Montgomery dataset, which includes 138 radiographs, they employed SVM classification and achieved an AUC of 89% with a 64-pixel grid size, outperforming sequential spatial pyramid features (73% AUC). 7
A computer-aided diagnosis (CAD) system for TB detection, using a combination of object detection-inspired features, image retrieval-based features, GLCM-based features, and SVM classification introduced by Niharika et al. The method achieved an AUC of 0.98 and 0.96 for the Montgomery and CHN datasets, respectively. 19 An algorithm was developed to detect various TB-related abnormalities, combining geometric properties, tissue properties, and texture features. The system achieved high accuracy (95.60% for Montgomery and 99.40% for Shenzhen) and demonstrated the efficiency of geometric properties in detecting TB-related abnormalities. 20 A DL system for detecting multiple TB classes in X-rays using a sharp objective detection network (RCNN) achieved improved performance with minimized false positives and increased sensitivity. 21 The CAD4TB system was tested on an independent dataset from Karachi, Pakistan, outperforming previous versions regarding sensitivity and specificity. The system demonstrated cost-effectiveness and efficiency, particularly at 90% sensitivity, making it a valuable tool for TB screening. 22
The focus is on using a CAD system to analyze chest radiographs to detect abnormalities, particularly TB, efficiently. The study highlights the importance of lung field segmentation and separate analysis. Various feature extraction techniques are applied to different regions of the lung fields, including Gaussian-derived filters for filtration and structural features. This CAD system provides accurate results and proves beneficial for radiologists in detecting TB, outperforming other inspection methods. 23 A system for distinguishing normal and abnormal CXRs, especially those with TB symptoms. The authors explore various digital processing methods, opting for rule-based hashing techniques over pixel-classification methods. By employing lung field properties, K-means mass segmentation, Euclidean distance classification, and SVM, the system achieves an accuracy, specificity, and sensitivity of 75% on the Montgomery County CXR database. 24 With the collaboration of the NLM, the Indiana University School of Medicine, and Moi University in Kenya, to develop a CAD system for TB diagnosis using chest radiographs. The system involves a shape model for image computation and the graph cut segmentation method for lung region detection. However, the study notes the limited accuracy of the lung shape model for region detection and suggests a dynamic shape model for future improvements. 25 The research introduces TB-CXRNet, a DL framework for detecting TB and drug-resistant TB from CXR images. By utilizing a novel model, CheXNet-Self-ONN, the system accurately classifies TB, non-TB, and healthy cases. The study emphasizes the importance of early TB detection for effective treatment and prevention of transmission. Using score-CAM visualization, the model’s decision-making process is made interpretable, enhancing trust in the diagnostic outcomes. The framework’s cognitive computation approach, incorporating pre-trained CNN models, demonstrates promising results in TB classification, focusing on accuracy, sensitivity, and specificity metrics 26 (Table 1).
Summary of proposed methods in the literature for TB detection.

TB: tuberculosis; CNN: convolutional neural network; ROI: region of interest; LBP: local binary pattern; CXR: chest X-ray; AUC: area under the curve; ACC: accuracy.
The research by Evans Kotei et al. attained an impressive accuracy rate of 98.46% in TB detection by utilizing a CNN model. This high level of accuracy was achieved through the implementation of unified approaches designed to enhance both the accuracy and stability of disease detection. However, the specific dataset employed for training and testing the CNN model was not detailed in the excerpts provided. Additionally, the study reports varying levels of accuracy when applying their model to different datasets. Specifically, an accuracy of 81% was achieved on the Montgomery dataset, and a higher accuracy of 90% was observed when the model was tested on the Shenzhen dataset. 14
Research methodology
This methodological research study focuses on developing and evaluating a hybrid approach for diagnosing TB from CXR images in the AuSC-DTB framework. It involves developing and implementing image processing techniques, segmentation algorithms, feature extraction methods, and machine learning classifiers. The study assesses the effectiveness of the proposed hybrid approach experimentally by considering multiple datasets, and the results are compared with existing methodologies. The proposed hybrid approach and its contributions at different steps in image processing are elaborated in the “Proposed hybrid approach AuSC-DTB” section.
The related work contains the studies included based on two criteria: (1) the studies detect TB, and (2) using ML techniques at any stage of digital image processing steps. The dataset inclusion criteria are the common datasets used for TB detection.
In the context of TB detection in CXR images, feature engineering and classifier selection/optimization play crucial roles in achieving accurate and reliable results. Here is detailed information on these aspects:
Feature engineering
Feature engineering involves selecting and extracting relevant features from the input data to improve the performance of ML models.
In the context of TB detection, features extracted from CXR images can include shape, texture, and border characteristics related to lung regions. Studies have highlighted the importance of comprehensive feature selection models for TB detection, where neural network-based classification methods have yielded impressive results with high accuracy. Techniques such as histogram equalization and advanced feature extraction methods have been employed to enhance CXR images for TB detection, resulting in improved accuracy levels. Feature engineering methods can also involve the extraction of object detection-inspired features, image retrieval-based features, and GLCM-based features for TB detection, contributing to the effectiveness of CAD systems.
Classifier selection/optimization
Classifier selection is crucial in determining the performance of ML models for TB detection.
SV classification has been widely used in TB detection tasks due to its effectiveness in creating optimal hyperplanes for class separation. SVM classifiers have been selected for their ability to achieve good generalization performance and high accuracy in classifying TB-related abnormalities in CXR images. This study has explored the use of SVM classification in combination with various digital processing methods, rule-based hashing techniques, and geometric properties for TB detection, achieving high accuracy levels. Optimization of classifiers such as SVM involves tuning hyperparameters, selecting appropriate kernels, and optimizing the model to improve performance metrics like accuracy, sensitivity, and specificity.
Focusing on effective feature engineering techniques and selecting/optimizing appropriate classifiers like SVM, researchers can enhance the accuracy and reliability of TB detection systems based on CXR images. These methods contribute to developing robust CAD systems for TB screening and diagnosis.
The feature vector is different than feature engineering. Feature vectors are numerical representations of data instances in a multi-dimensional space, where each dimension corresponds to an object’s specific feature or attribute. In the context of TB detection using CXR images, feature vectors encode essential characteristics extracted from the images, such as textures, shapes, and patterns, that are crucial for distinguishing between TB-positive and TB-negative cases. Feature engineering, on the other hand, is the process of selecting, transforming, and creating new features from raw data to enhance the performance of machine learning models. In TB detection, feature engineering involves extracting relevant information from CXR images through techniques like texture analysis, shape analysis, and image enhancement to provide discriminative features that improve the accuracy and robustness of the classification model. Effective feature engineering ensures that the feature vectors contain meaningful and informative attributes that enable accurate predictions and classifications in TB detection systems.
Proposed hybrid approach AuSC-DTB
The AuSC framework for healthcare involves working on two aspects related to healthcare using ML techniques for segmentation and classification in digital images.
How to diagnose coronary artery disease (AuSC to diagnose coronary artery (AuSC-CAD) disease).
4
How to detect TB (AuSC to detect TB (AuSC-DTB)) using ML techniques.
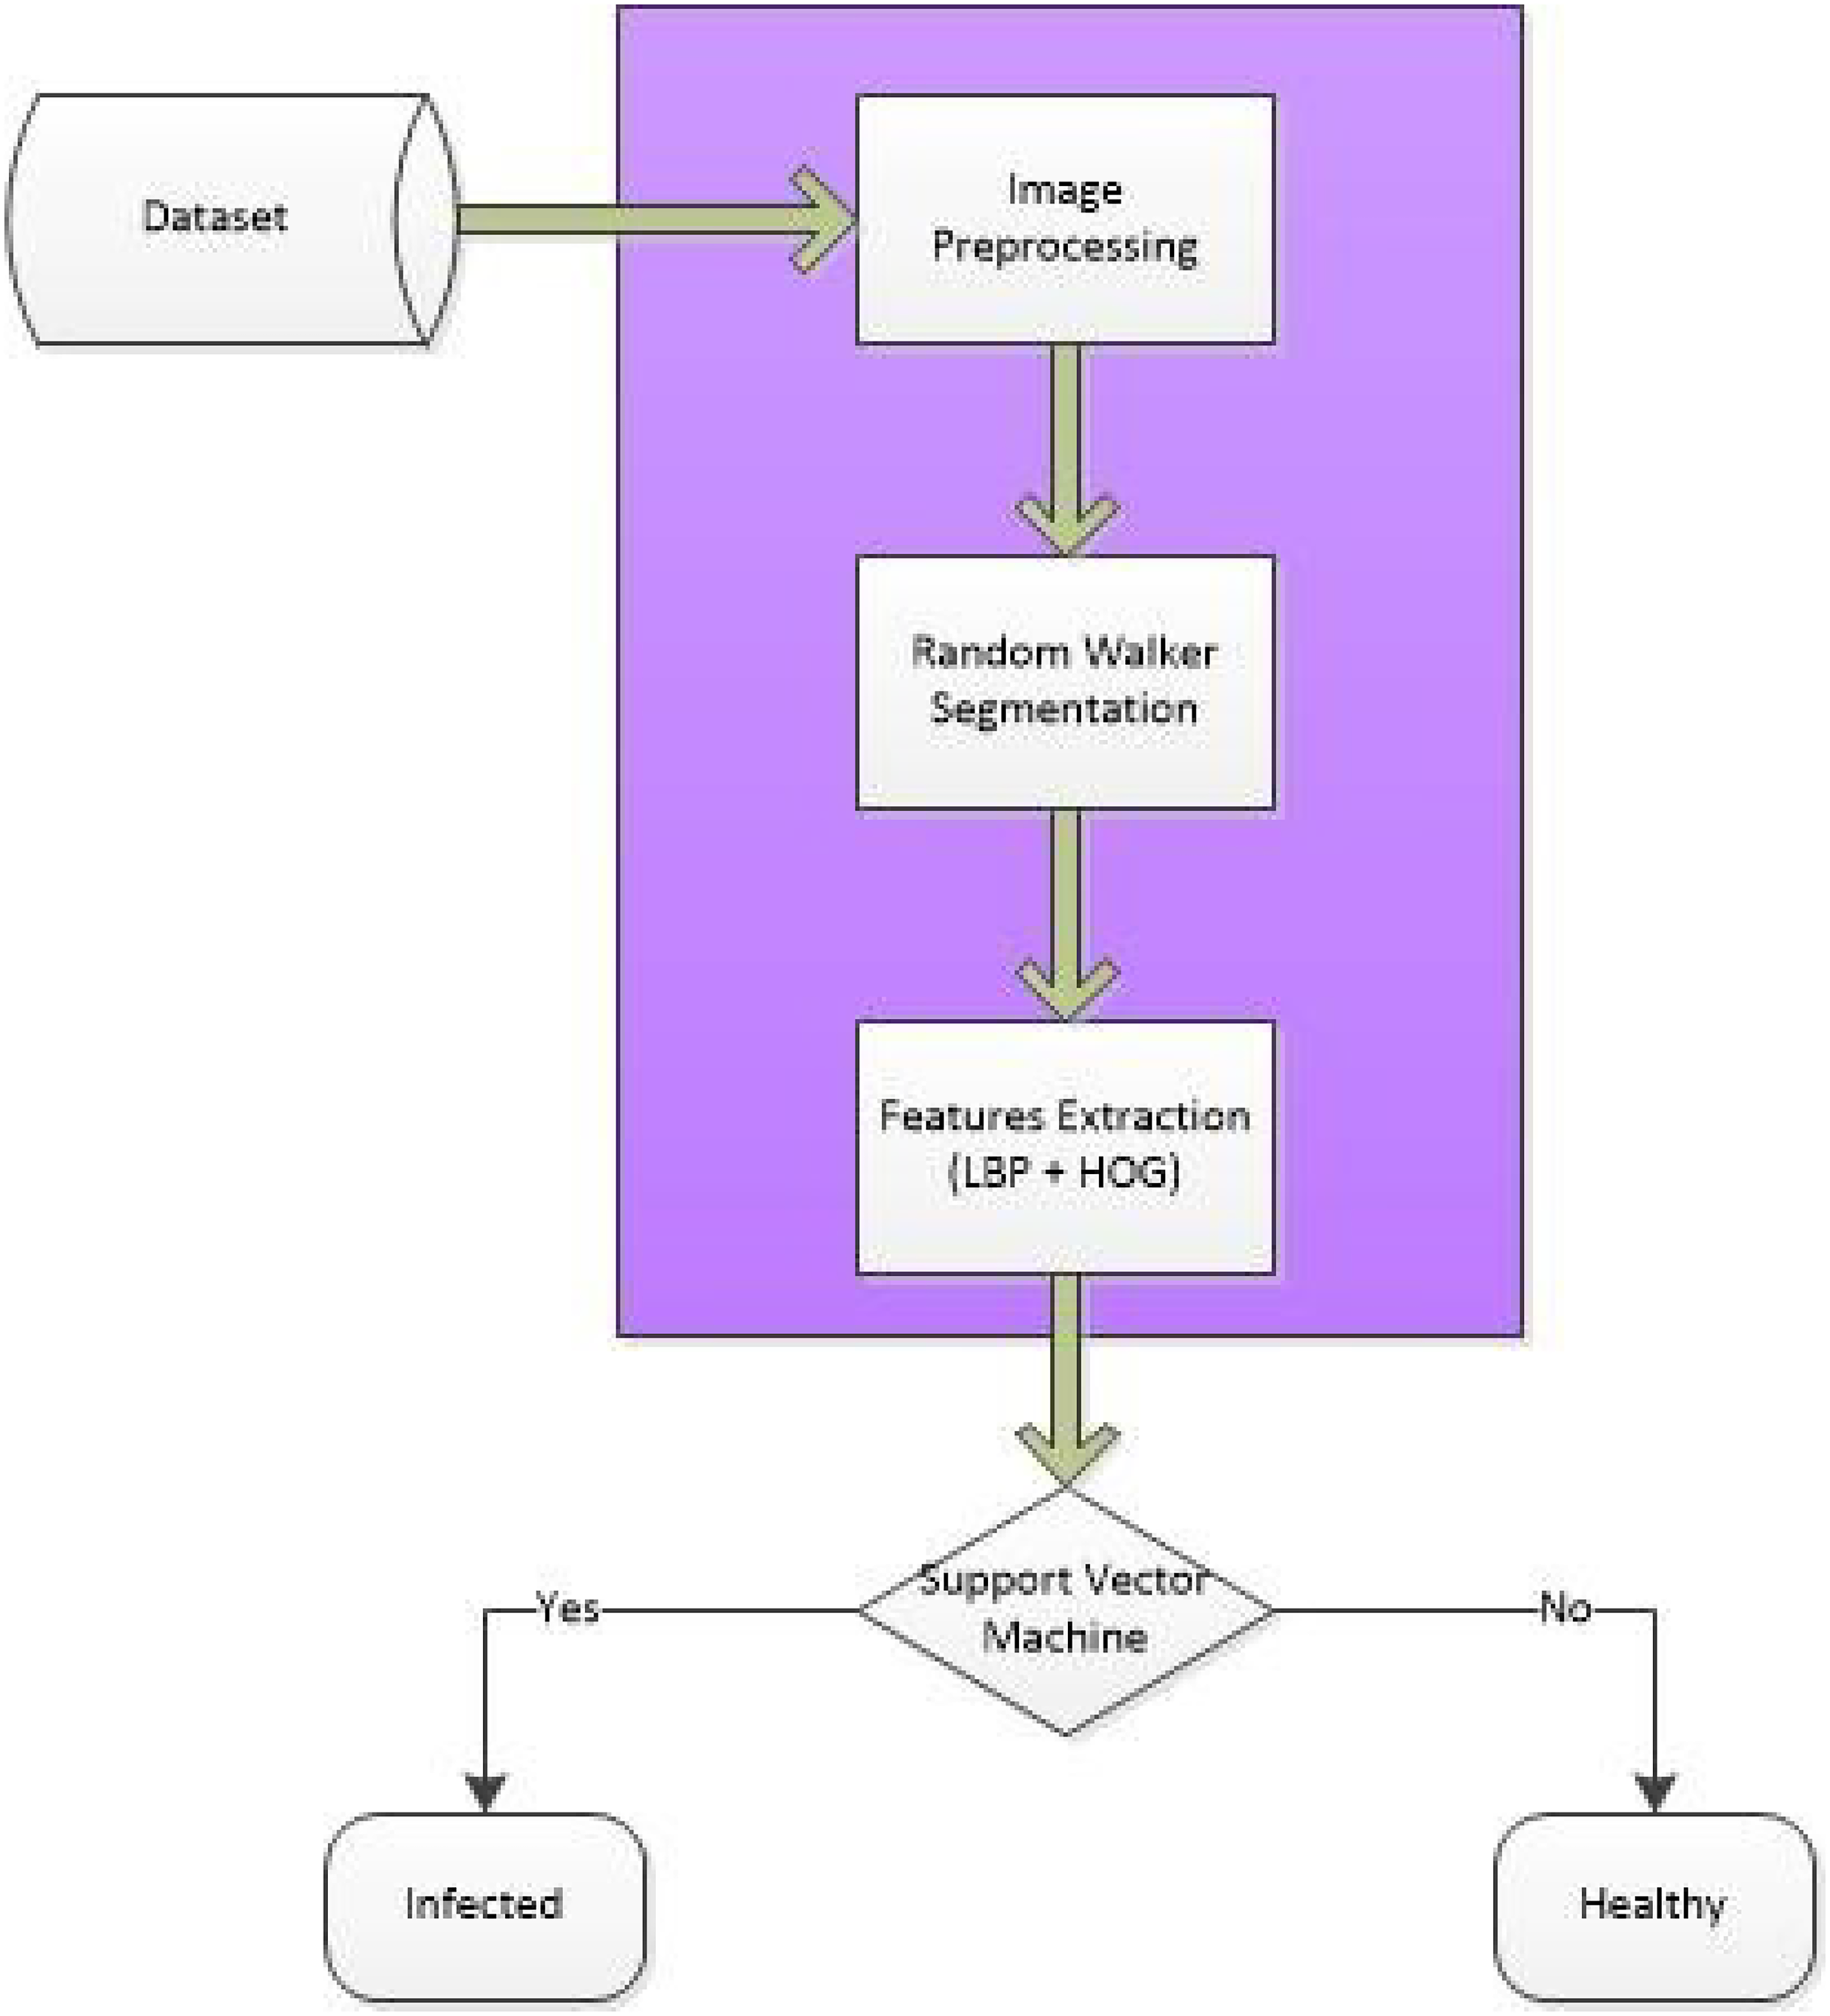
In the AuSC-DTB framework, a three-step hybrid approach is introduced to detect tuberculosis in X-ray images to improve TB detection accuracy. The input X-ray images are preprocessed with a median filter to achieve accurate textual properties. The preprocessed images are ingested for the segmentation techniques used to obtain the ROI, and various feature extraction techniques are used to find the region of interest. Finally, the extracted characteristics are used to classify and detect pulmonary TB as shown in Figures 1 and 2.

Abstract block diagram of the automatic segmentation and classification to detect tuberculosis (AuSC-DTB) framework.

Automatic segmentation and classification to detect tuberculosis (AuSC-DTB) framework.
The rationale behind the different techniques used in the framework is that traditional machine learning techniques can also be effective in certain scenarios when detecting TB in CXR images. While DL models like CNNs have shown significant advancements in image classification tasks, traditional machine learning algorithms such as SVMs can still be valuable for TB detection.
SVMs are widely used in image classification tasks due to their ability to create optimal hyperplanes for separating classes in high-dimensional spaces. SVMs have been successfully applied in various medical image analysis tasks, including TB detection in CXRs. These algorithms can effectively classify patterns by maximizing the margin between different classes, leading to good generalization performance. Moreover, traditional ML techniques like SVM have been utilized in CAD systems for TB detection, achieving high accuracy levels and demonstrating efficiency in detecting TB-related abnormalities. These methods have shown promising results in terms of sensitivity and specificity, making them suitable for TB screening applications. In addition, traditional ML algorithms are often easier to interpret and implement compared to complex DL models, making them more accessible for healthcare professionals in real-world clinical settings. While DL models have their advantages, traditional machine learning techniques like SVM can still provide reliable results in TB detection tasks, especially when interpretability and ease of implementation are crucial factors to consider.
Image datasets
Datasets play a crucial role in research due to their importance in contributing to empirical research and analysis. They facilitate statistical analysis, hypothesis testing, and modeling and, hence, heavily rely on proposed technique(s). In the era of ML and artificial intelligence, datasets are essential for training and evaluating models. The quality and quantity of data significantly impact the performance of these algorithms.
In this study, four datasets are used because these are baseline datasets frequently used in the literature:
National Library of Medicine
The NLM database consists of 7472 images. The dimension of the images is 512
Japanese Society of Radiological Technology
The standard digital image radiograph of the chest with and without lung nodules was developed in 1998 (*1) as part of the research work of the Scientific Committee of the Japan Society of Radiological Technology (JSRT), with the support of the Japanese Association of Radiology (JRS) and in collaboration with health centers in Japan and the United States. The database included 154 conventional chest radiographs with lung nodes (100 malignant and 54 benign nodes) and a laser with a matrix of 2048
Montgomery County
This dataset consists of X-ray images collected from the Montgomery County, MD, TB Control Program, USA Department of Health and Human Services. It contained 138 anterior radiographs, 80 of which were marked as normal and 58 as abnormal with symptoms of TB. All images are anonymous and in DICOM format. The collection covers various anomalies, including spills and military styles. The dataset includes X-ray reading text files.
Shenzhen
This dataset consists of X-ray images collected from Shenzhen No. 3 Hospital in Shenzhen, Guangdong Province, China. The images are in JPEG format. A total of 326 radiographs were marked as normal, and 336 were marked as abnormal with symptoms of TB.
Image preprocessing
Using computing technologies in medical imaging is using imaging techniques for quantitative analysis. Digital images may contain different types of noise. The goal of preprocessing is to highlight, remove noise, and customize the image for further analysis and processing. Median filter is a non-linear method of digital filtering, usually used to remove interference from an image or signal. Noise reduction is a preprocessing step (e.g. image edge detection) to improve post-processing results. The median filter is one of the most frequently used filters in digital image processing. 27
Image segmentation
Image segmentation is the process of dividing an image into its components or objects to specify the ROI. The degree of application of this unit depends on the problem’s solution, that is, when the application should be stopped and when the objects of interest in the application should be separated. For example, when searching freely for land and air markers, tell us if we want to identify the vehicles. On the road, the first step is to separate the road from the picture and then distribute the road material to potential vehicles. 27
Random walker (RW)
Grady introduced RW in 2004 to correct some of the problems that arise with graphical deductions. We rode on the same graphics kit framework with a weighted chart, but naming was considered from the beginning and without losing the generality that we all assume. The edge weight is usually between 0 and 1. Therefore, it represents the possibility that a random particle could cross a certain edge and move from one peak to the adjacent section. Given a set of starting points on this graph for each label, the algorithm considers the possibility that a particle moving freely and randomly on this weighted graph is labeled on the graph without any arbitrariness before it comes from other labels. It will reach the top. Therefore, a potential vector for each label is counted in each unlabeled peak. The algorithm considers the computed probabilities at each peak and assigns the highest probability label to that peak. The RW method has some interesting features regarding distribution. It is completely noise-resistant and can handle significantly weaker limits, although RW is a completely separate process, it does not show network bias. This is because resistance distance surface lines (i.e. the resistance between a fixed node and all other nodes) on an infinite graph with a constant edge weight were isotropic. RW shows a shrinkage bias but is not as strong as GC.
RW is a semi-supervised algorithm used for the segmentation of the image. It is called semi-supervised because initial regions must be selected by users and run on some preprocessing calculations. When the user interacts with it at the start, the user has to select the seed; the user interactively classifies a small number of pixels with known labels (called seeds), for example, “object” and “background.” It is envisaged that each of the unlabeled pixels triggers a random walk, and the probability is calculated that the RWs of each pixel first arrive at a seed containing each tag, that is, if the user places an N seed, each one has a different tag. The label must first consider the possibility of delivering a random stroller pixel to each seed. These possibilities can be determined analytically by solving a system of linear equations. Once these probabilities are calculated for each pixel, the pixel will be assigned to a tag that is likely to send a random word. The image is modeled as a histogram, images were graphics, pixels were considered nodes, and edges were used to connect every pixel to its adjacent node. The edges were drawn to reflect the similarity between the pixels. This is why random walks happen on a weighted graph. For each unmarked pixel, a random walk is initialized that can move to any place freely in the image. 28
Features extraction
Feature extraction techniques have been developed to distinguish features in artificial aperture radar images. This technology isolates the high-level features needed to perform the target classification. Attributes are factors that uniquely describe the purpose, such as size, shape, structure, position, and so on. A feature is a piece of information that is used for solving a computational task. It can be structured in the image, such as edges, points, or objects. A feature could be eye color, skin texture, and facial characteristics. An object can be identified with various properties which can be size, shape, color, texture, pixel values, etc.
Feature extraction is a process of reducing the size in which the initial dataset is minimized to more flexible sets. A feature of such large datasets is the large number of variables that require large amounts of computer resources for processing. Extraction of features is the name of a method that defines and/or combines variables into attributes, minimizing the amount of processed data, and representing the standard dataset.
When the purpose is to minimize the required resources needed for processing and also not to lose original data feature extraction is useful. Separating features can also minimize the data required for a particular analysis. In addition, reducing data and machine efforts to create sets of variables (properties) facilitates faster learning and generalization steps in the ML process. 29 Different algorithms are used to extract various features such as edges, shape, or motion in a digital image.
Local binary patterns (LBPs)
In computer vision for classification LBP is used as a type of visual descriptor. When LBP is integrated with a histogram of oriented gradient (HOG) descriptor, the detection performance is significantly improved on some datasets. Each central pixel is compared to its eight neighbors. Neighbors with less than the center pixel have a bit 0, and neighbors with a value equal to or greater than the center pixel have a bit 1. For each given center pixel, a binary number is obtained by connecting. All these binary bits can be generated clockwise, starting from the top left neighbors. As a result of the binary number generated, the decimal value replaces the center value of the pixels. The histogram of the LBP mark (frequency of presence of each symbol) is calculated by region or image, which can be used as an image texture descriptor. The size of the graph is 2P because the LBP operator (P, r) is capable of generating various 2P binary codes. The LBP is constructed as:
Divide the scanned window into cells (e.g. 16
Now we have to compare every pixel of a cell with its eight neighbors (top left, center left, bottom left, top right, etc.). The sequence of the pixels should be clockwise or anticlockwise. When the value of the neighbor value is less than the center pixel enter “0.” Otherwise, enter “1.” Eight-digit binary number is obtained (which is generally transformed to a decimal number to make it easier).
Calculate the histogram above the cell for the frequency of each “number” that occurs (i.e. each set of pixels is larger and smaller than the center). This histogram can be displayed as a 256-dimension feature vector. Optionally, normalize the graph.
Correlate (normalize) the graphs of all cells. This provides a feature vector for the entire window. 5
Histogram of oriented gradients
A HOG or directed gradient graph is a property descriptor used for feature extraction. It is broadly used in artificial vision missions to detect objects. The basic premise behind vector gradient descriptors is that the appearance of a local object within an image can be described by the intensity gradient or the distribution of edge directions. The image is divided into smaller connected regions called cells, and a histogram of gradient directions is drawn for the pixels within each cell. The descriptor is a series of such graphics. To improve accuracy, the contrast in the local histogram can be adjusted by calculating the intensity scale over a large part of the image, called a block, and then normalizing the value to all cells within the block. It can be used to search. This normalization results in better stability for light and shading changes.
The HOG descriptor has some advantages over other descriptors. Because it works in local cells, it is constant for geometric and optical transitions, except for the direction of the object. Such changes will only be visible in large local areas. Furthermore, as Brokers and Travis discovered, near-local sampling, excellent orientation sampling, and strong normalization of local photography make it possible to ignore the individual physical movement of pedestrians as long as they hold a relatively straight coin. Therefore, the HOG descriptor is especially suitable for human detection in images. The HOG function descriptor counts gradual direction events in local parts of the image. HOG, or directed gradient graph, is a property descriptor used for feature extraction. It is broadly used in artificial vision missions to detect objects.
HOG can be calculated by the following steps
28
:
This operation will give us two new matrices—one storing gradients in the x-direction and the other in the y-direction. The magnitude increases when there is a sharp change in the intensity like the edges. We calculated the gradients in the x and y directions separately. The same process is repeated for all the pixels in the image. The next step is to find the size and orientation using these values.
Finally, for the HOG features of the image we have to combine all 16
Image classification
Image classification is the naming of a pixel or group of pixels according to their gray value. Classification is one of the most common ways of obtaining information. Image classification is a significant problem in image analysis tasks. 30
The SVM uses regression and classification technology and exploits the Bayesian probability principle. Other models for classifying patterns that use theoretical methods are kernel-based classifiers and perturbation-based linear programming methods. 31 The support vector device takes a hyperplane or group of hyperplanes in high quality or infinite space, which can be used for sorting, retrieval, or other tasks such as outlier detection. Intuitively, a good separation is achieved by having the hyperplane have the greatest distance to the nearest training data point of any class (the so-called action margin), because generally, the larger the margin, the smaller the generalization error of the classifier. For the classification of TB, SVM was selected for this work, because it is considered best in the case of CXR image classification. SVM is formally defined by the best separator level selection, which separates a class from an alternate class. 32
In the human body, any part can be affected by TB but its main target is the human lungs which is called pulmonary TB (PTB). Different symptoms can appear in the lungs depending on many aspects, and their presence cannot be verified by a single symptom. 5 When a TB-infected person coughs or snoozes they expel germs that are inhaled by other persons and affect their lungs. The infection then starts to grow inside the lungs and affects the alveolar surfaces of the lungs, resulting in an infectious condition. It can be passive or active. TB is accompanied by symptoms such as fatigue, perspiration loss of appetite, three weeks of cough, temperature, and, in losing of weight. TB mainly affects the lung area; it usually appears around the clavicle, having various symptoms that correspond to several aspects. However, TB, as a treatable, can be diagnosed with powerful techniques and effectively cured. 28
For understanding the natural and health-affecting medical processes medical imaging is considered a dynamic tool. The efficiency of image processing methods can have a significant impact on the efficiency of large systems, as well as the human observer who needs to analyze all available image data and make diagnostic or treatment decisions. 33
The proposed methodology consists of a few steps in which CXRs are taken as input from the database, the system processes it, and concludes whether the lungs are infected or not. The processing steps involve preprocessing steps, random walk segmentation, feature extraction, and SVM classification. Figure 3 shows the complete process of the proposed work.
Block diagram of the proposed system.
The flowchart gives a brief overview of the complete performance of the proposed work. Standardized symbols are used in the implemented flow diagram. To obtain accurate and reliable results, image characteristics are taken and then a classifier is used, which is used to compare normal and abnormal images. In our methodology, CXRs are used as input in the system, and then the random walk method is applied to the images for segmentation. After segmentation features are extracted manually, the SVM classifier is applied for classification to get an accurate and reliable result. We preferred this method because a system will give an accurate value after detecting the TB disease. For CXR we have taken online datasets. Figures 4 and 5 show the flow of the proposed system.

Data flow diagram of the proposed system.

Pseudo code of automatic segmentation and classification to detect tuberculosis (AuSC-DTB) algorithm.
AuSC-DTB algorithm
AuSC-DTB algorithm 5 describes each step of the proposed methodology. The first step is to ingest the input CXR images, in second step preprocessing is performed on the entire dataset to achieve a customized dataset, in preprocessing resizing the images and apply the median filter on the preprocessed input images. in segmentation step, the RW segmentation is applied to images and store those segmented images in the directory. Then segmented images are inserted for feature extraction. LBP, and HOG descriptors are used for extracting required features then those features are classified using the SVM classifier, which classifies the images as healthy and infected CXR images.
Results evaluation and discussion
Results are evaluated with comprehensive details regarding the proposed techniques. This section gives results of random walker segmentation, LBP, HOG, and SVM on how these techniques work on various datasets and achieve higher accuracy.
The proposed methodology consists of a few steps in which CXRs are taken as input from the database, the system processes it and concludes whether the lungs are infected or not. The processing steps involve preprocessing steps, random walk segmentation, feature extraction, and SVM classification.
Image pre-processing
For brightening and noise reduction, some pre-processing steps are performed, which include resizing and filtering.
Images are resized to width = 400 and height = 400 to minimize memory requirements and computational complexity. All images of all datasets are re-scaled to the same dimensions. Images are re-scaled for 400 Medium filtering is used for removing salt and pepper noise and after filtering out the noise. Figure 6 shows the resultant filtered image for JSRT, Montgomery County, NLM, and Shenzhen datasets.
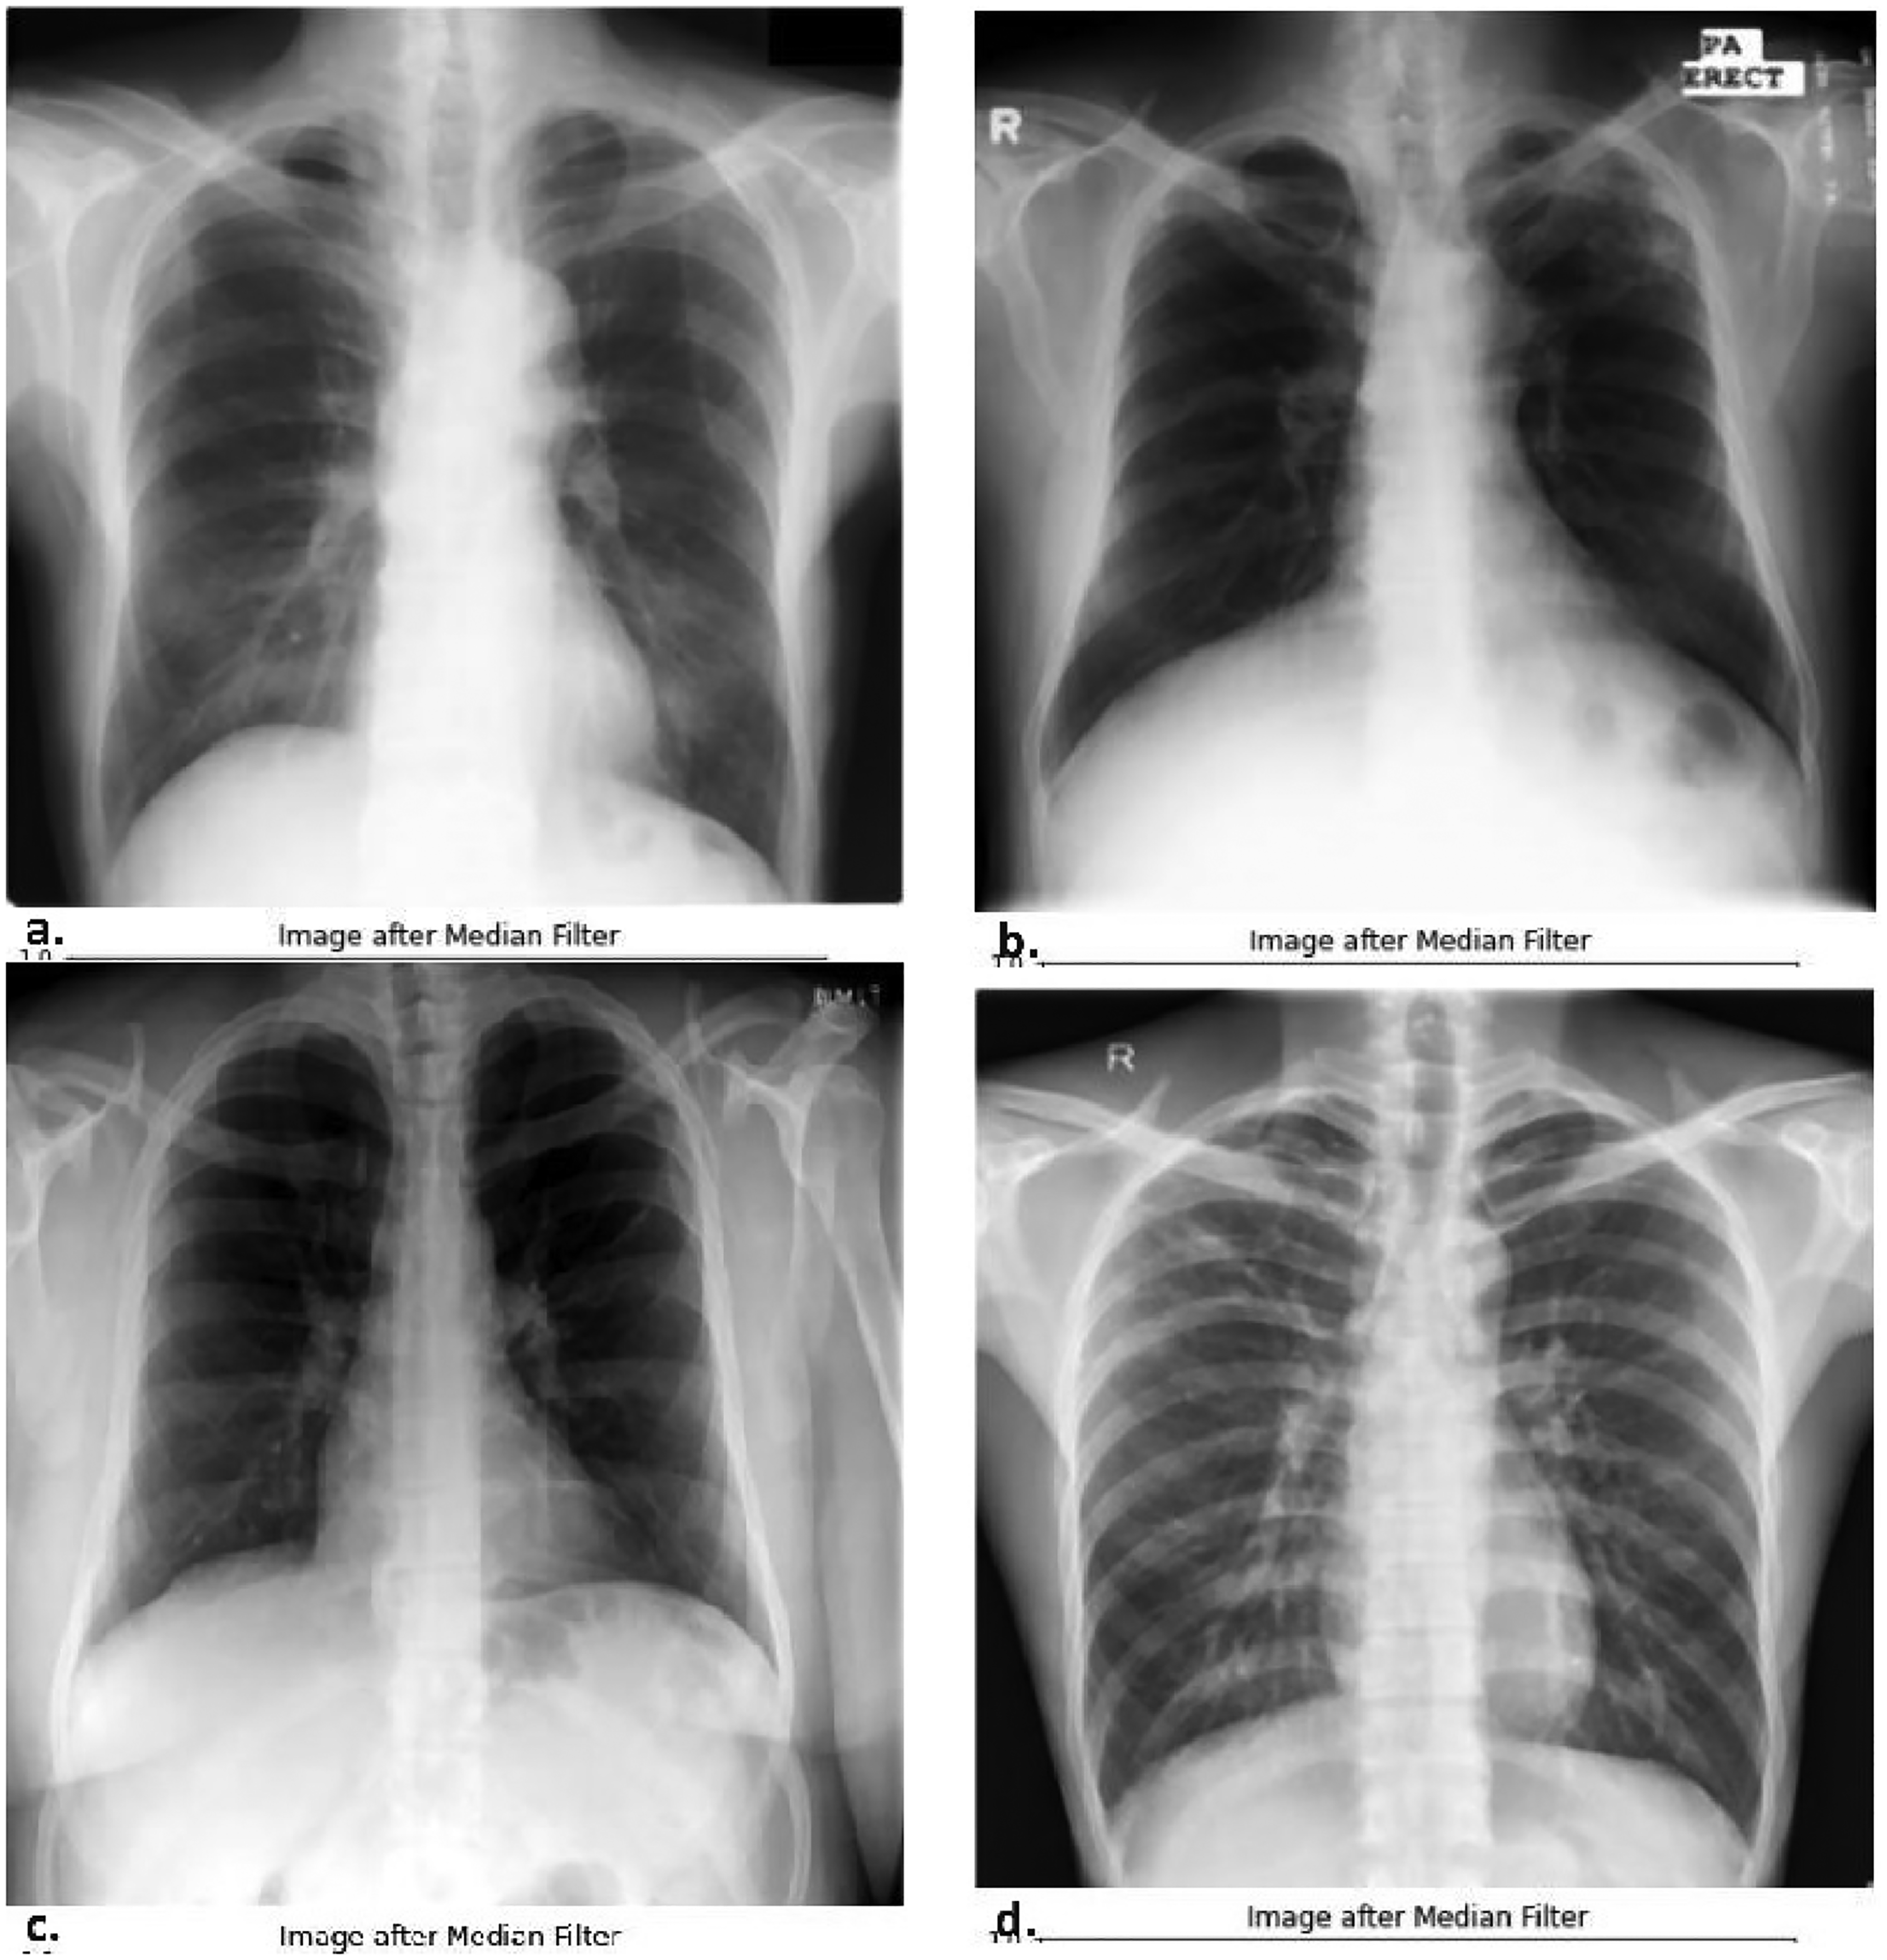
Median filter output for datasets, (a) JSRT, (b) Montgomery County, (c) NLM, and (d) Shenzhen. JSRT: Japanese Society of Radiological Technology; NLM: National Library of Medicine.
Segmentation
After pre-processing, the next step is image segmentation. For image segmentation, the RW technique, a semi-supervised algorithm, is used. Segmentation processes are discussed below.
Figure 6 shows the resultant filtered Image for JSRT, Montgomery County, NLM, and Shenzhen datasets and is used as input images to apply the random walker segmentation. The image is loaded for seeds pointing from users in different colors that denote different regions.
Image with seeds
Figure 7 shows the resultant seeded images for JSRT, Montgomery County, NLM, and Shenzhen datasets with different color seeds used for every region white seeds define the right lung, black seeds define the left lung, green define bone, red seeds define suspected infected part and blue defines the non-lung region, and beta value is set to 900. Beta is the penalization coefficient for the RW motion (as the value of beta increases, the diffusion will become more difficult)
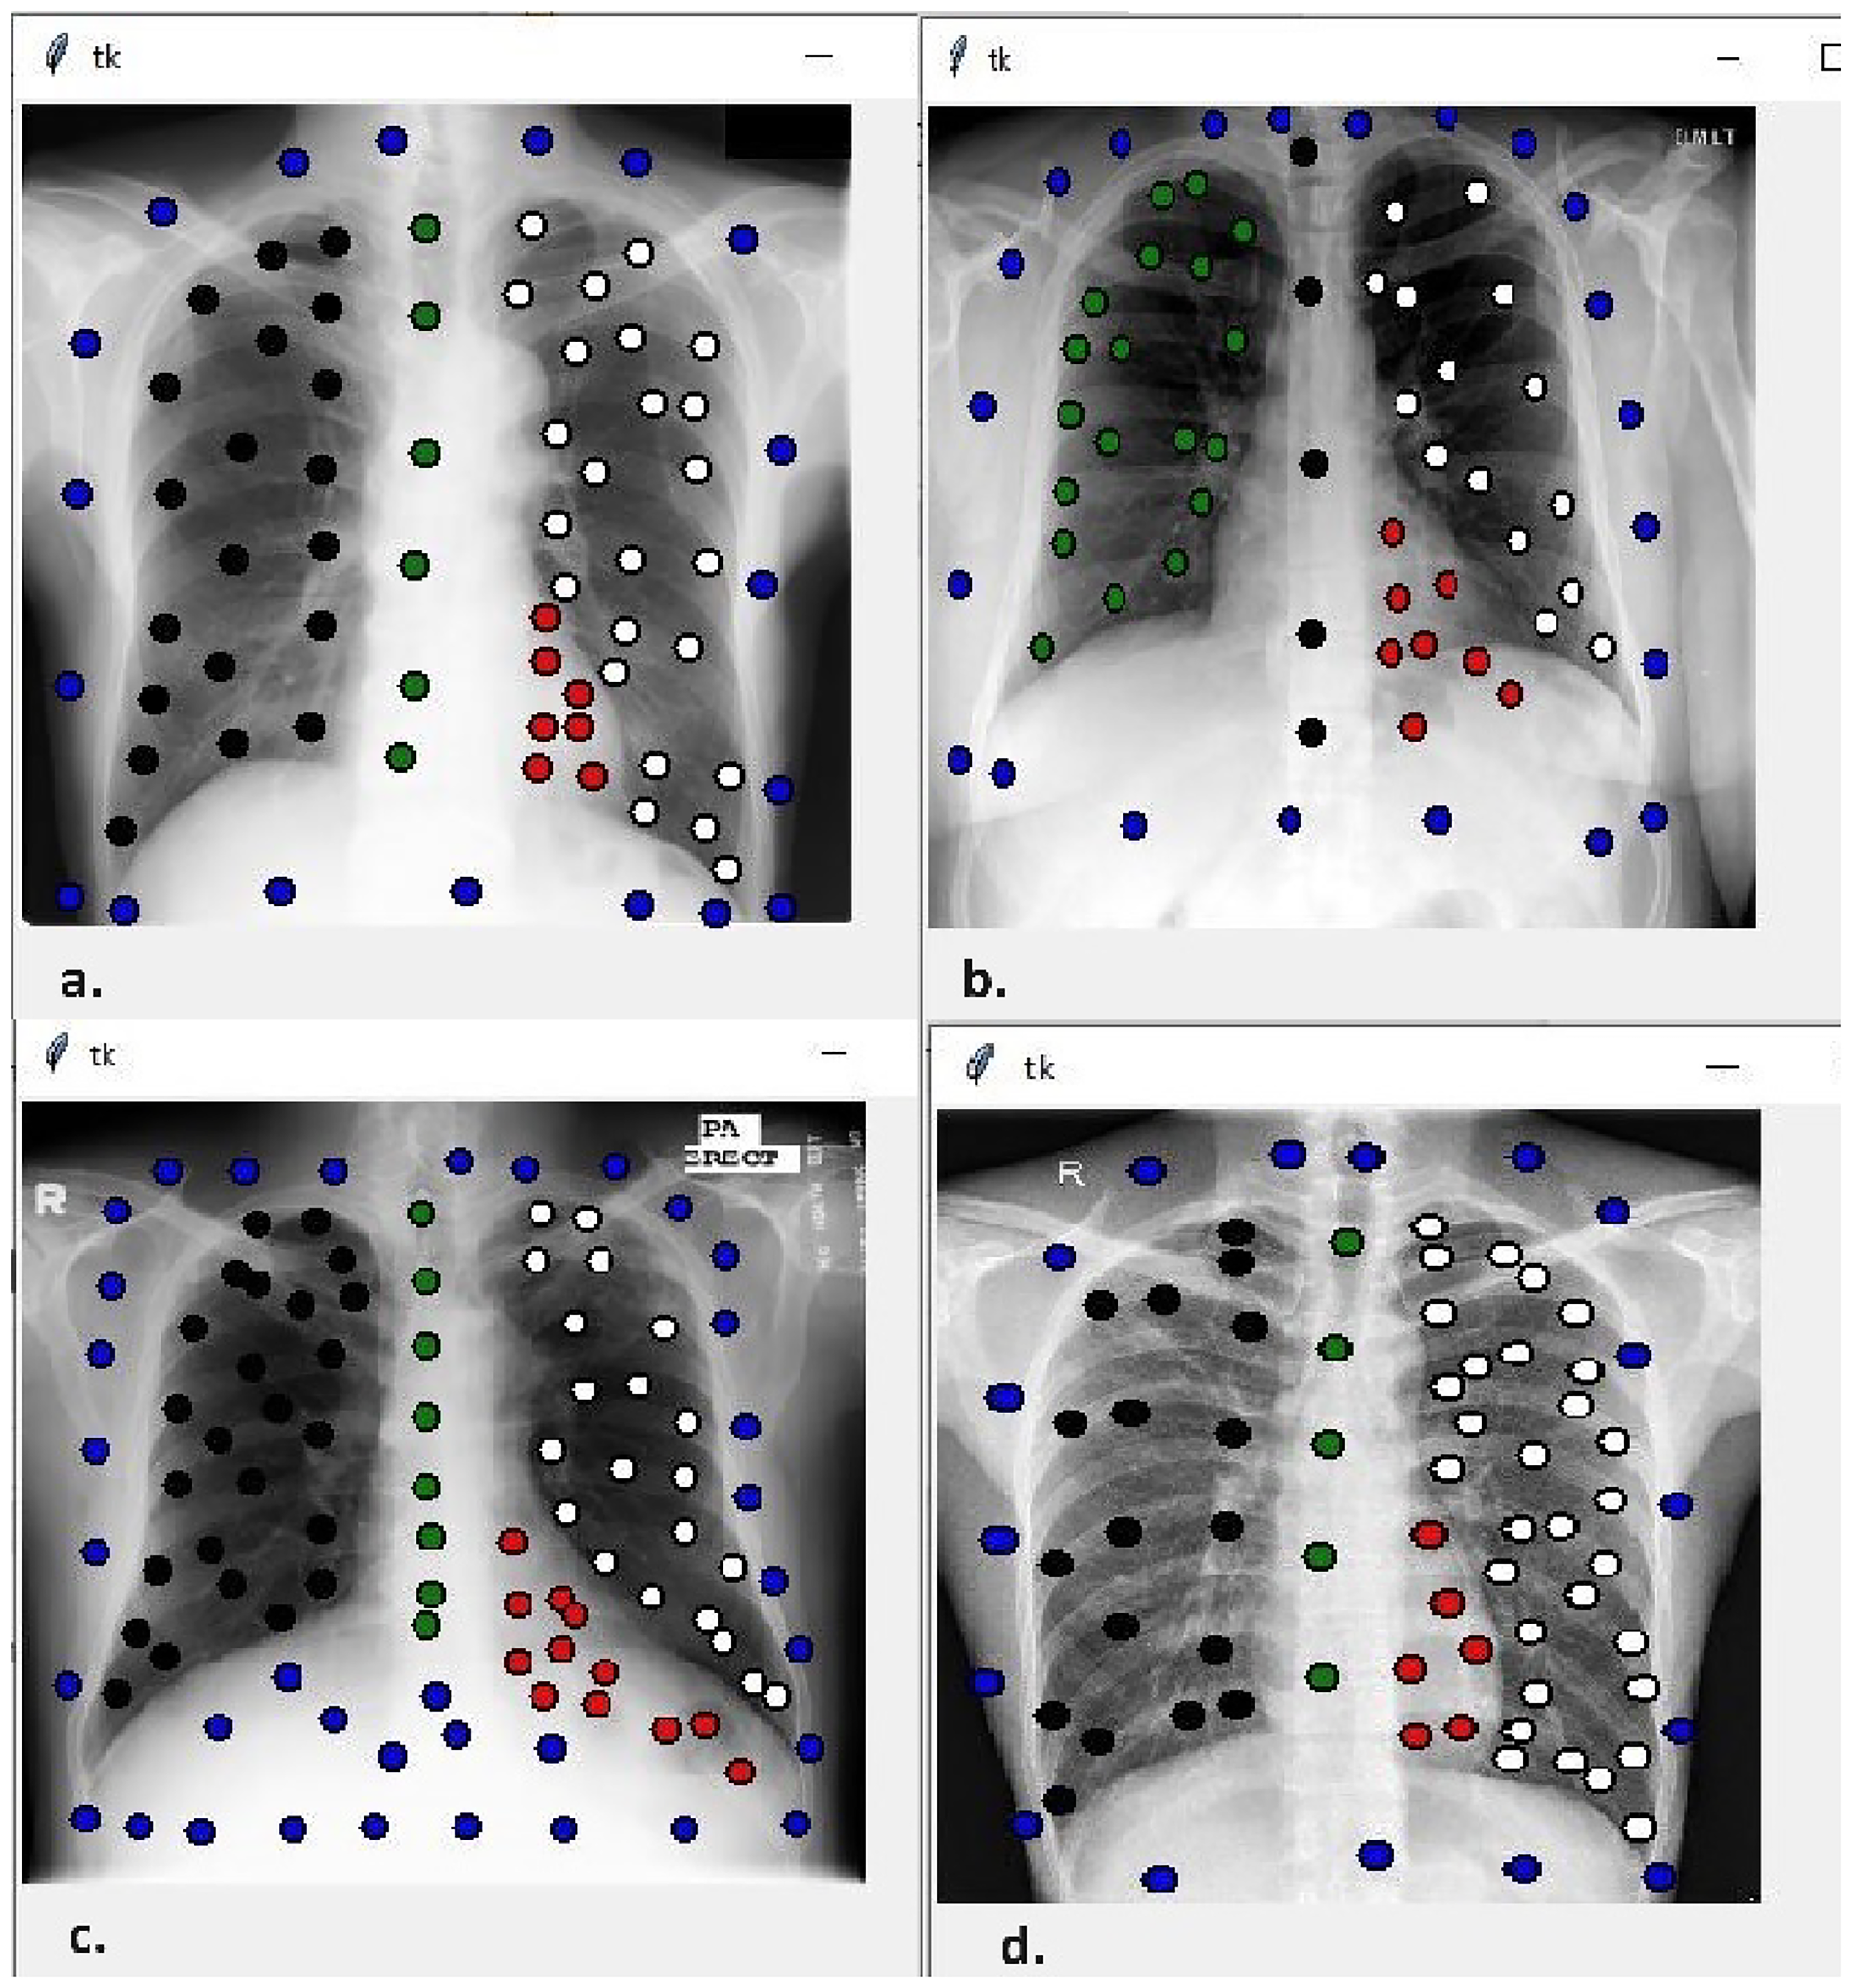
Seeded images for datasets, (a) JSRT, (b) Montgomery County, (c) NLM, and (d) Shenzhen. JSRT: Japanese Society of Radiological Technology; NLM: National Library of Medicine.
Segmented image
Figure 8 shows the resultant segmented images for JSRT, Montgomery County, NLM, and Shenzhen datasets in which every region is segmented through boundaries generated around pixels of the same intensity.

Segmented images for datasets, (a) JSRT, (b) Montgomery County, (c) NLM, and (d) Shenzhen. JSRT: Japanese Society of Radiological Technology; NLM: National Library of Medicine.
The next step is to extract features from the segmented image, which should be inputted into the classifier for classification.
Feature extraction
Here, we used two algorithms for feature extraction, as given below.
Local binary patterns
A LBP technique is used to extract texture features as shown in Figure 9. LBP and histogram of the datasets (a) JSRT, (b) Montgomery County, (c) NLM, and (d) Shenzhen.
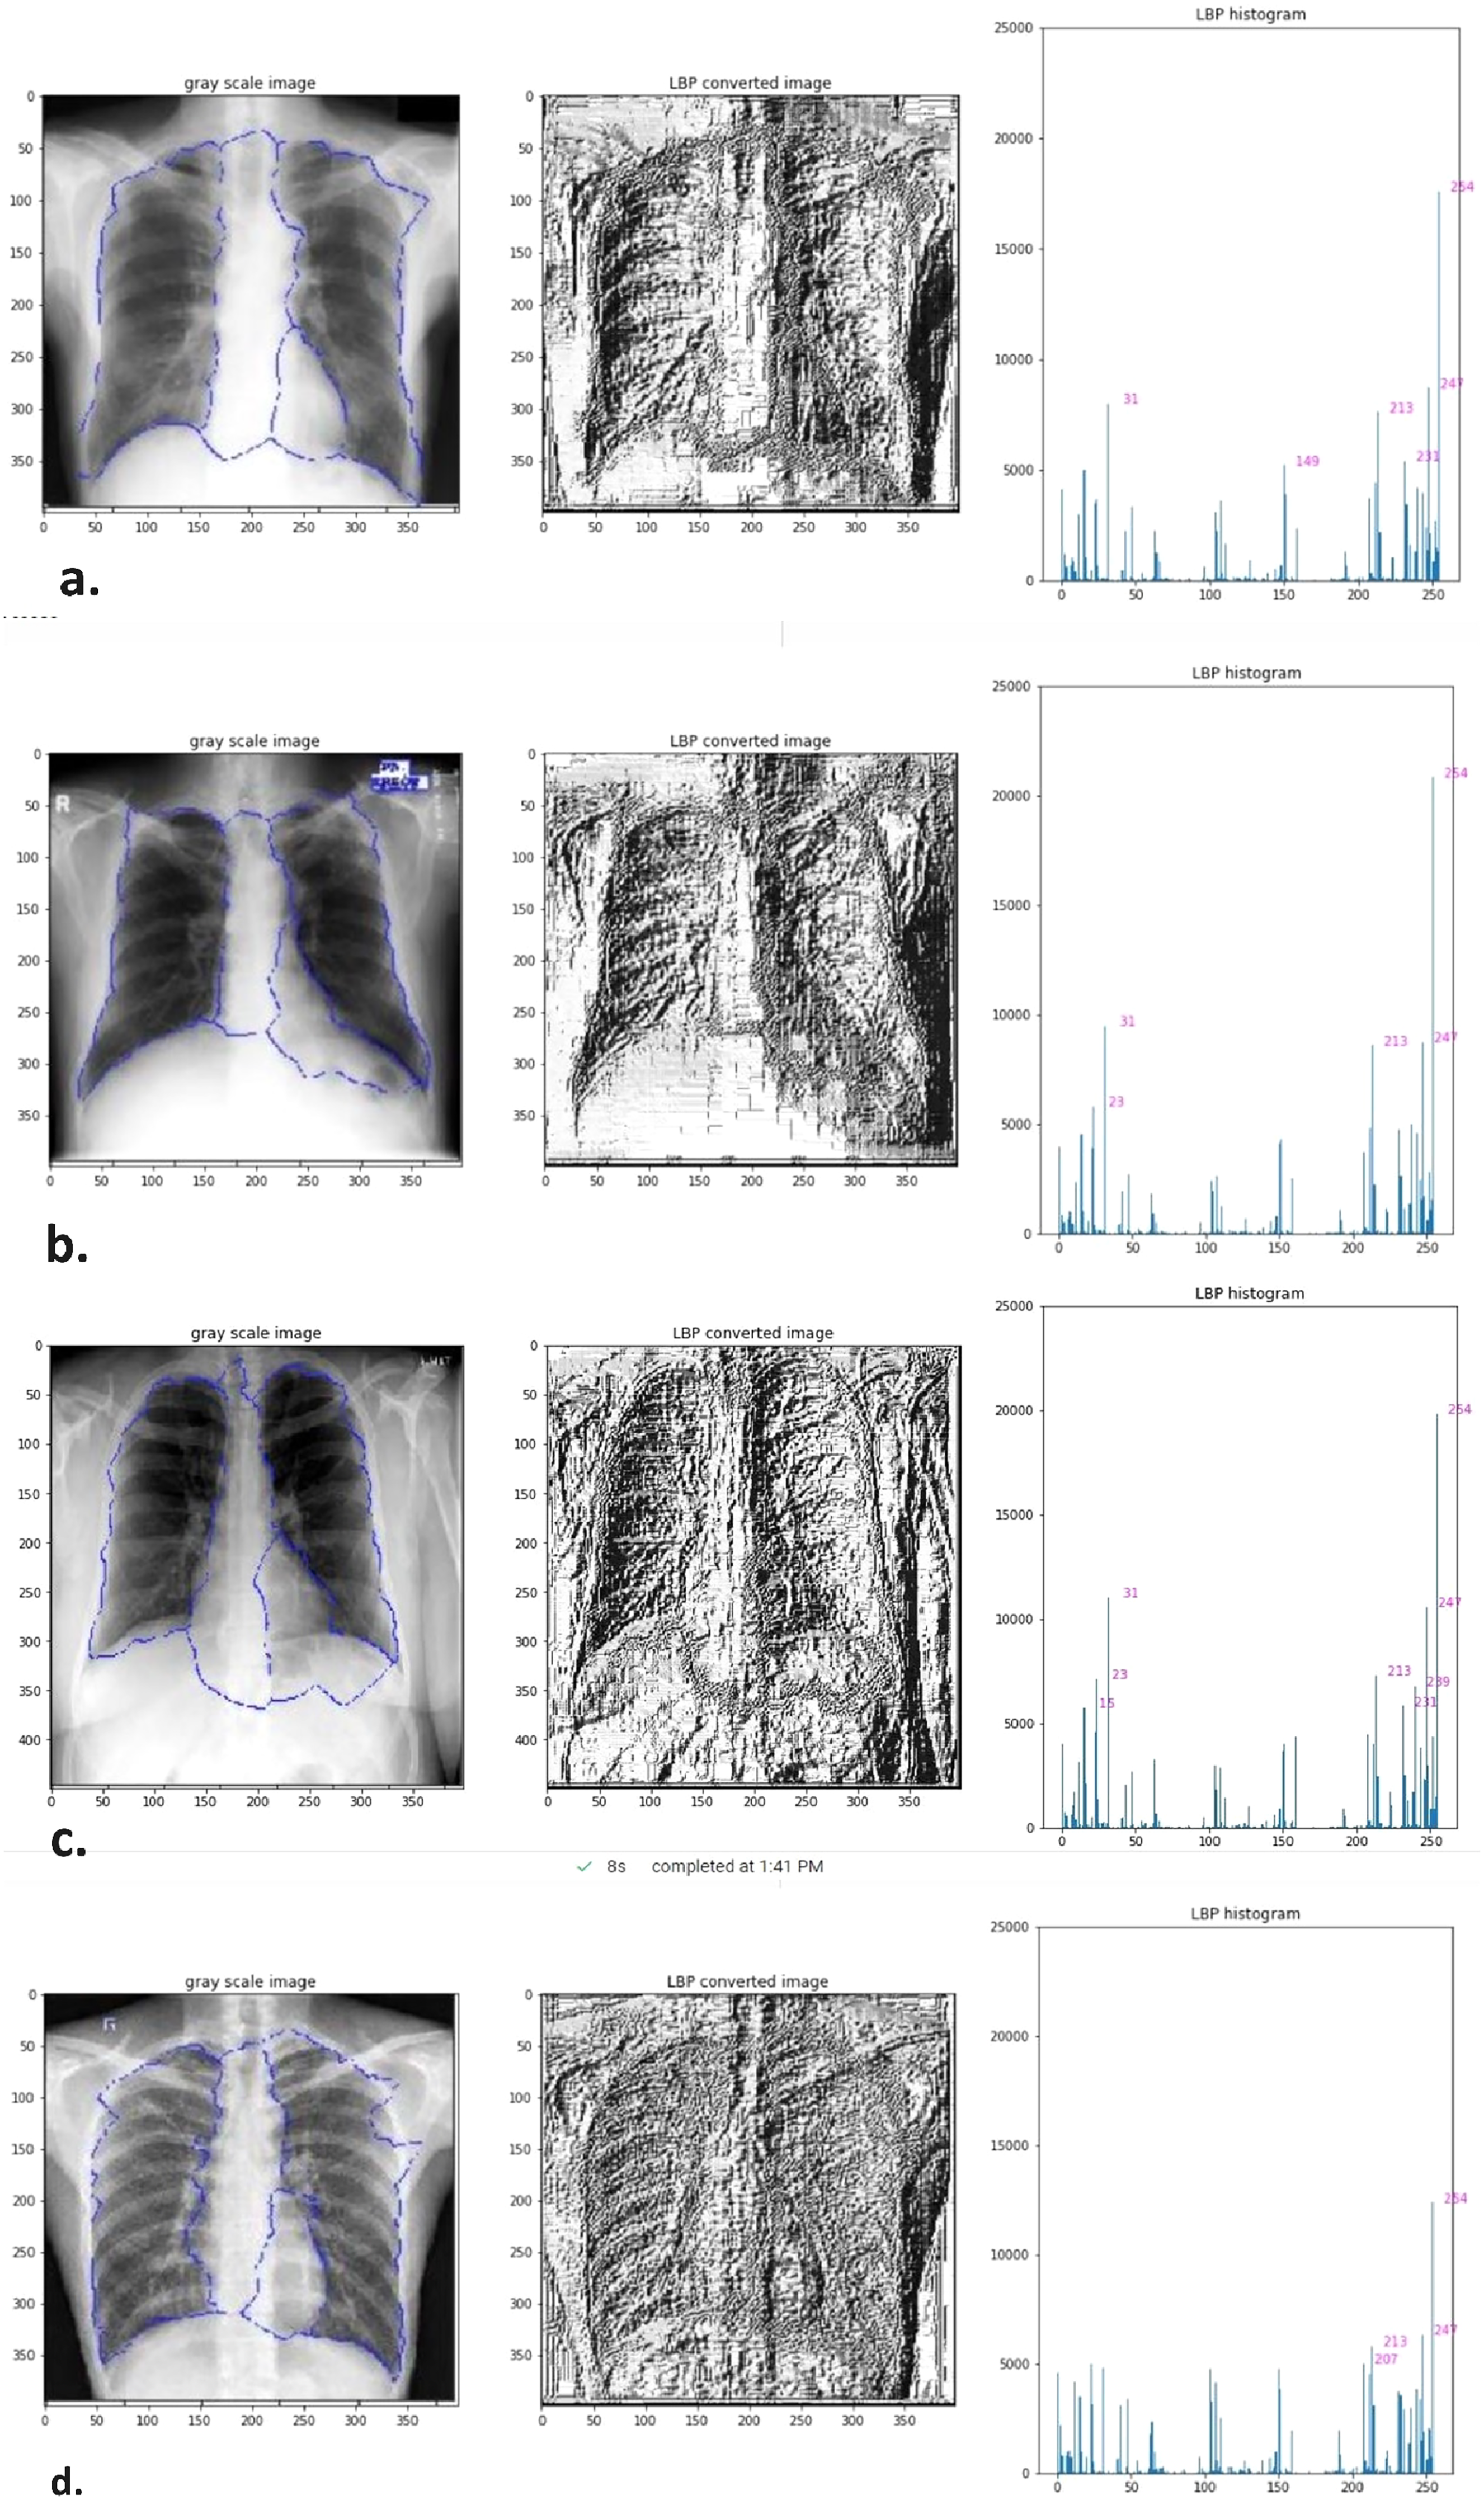
Features extraction using LBP for datasets, (a) JSRT, (b) Montgomery County, (c) NLM, and (d) Shenzhen. JSRT: Japanese Society of Radiological Technology; NLM: National Library of Medicine.
The features can be represented in numerical values. The feature vector can be manipulated using an SVM, heavy ML, or some other ML algorithm for image classification.
HOG feature descriptor
HOG feature extraction technique is used for the extraction of structure and shape features as shown in Figure 10.

HOG for datasets, (a) JSRT, (b) Montgomery County, (c) NLM, and (d) Shenzhen. JSRT: Japanese Society of Radiological Technology; NLM: National Library of Medicine.
HOG descriptors can be used to identify objects by providing them as properties of a ML algorithm. The property can be represented in scalar values. The feature vector can be manipulated using an SVM, heavy ML, or some other ML algorithm for image classification. Features Vectors from both descriptors LBP and HOG are used as input to classifiers.
Classification
The SVM classifier attempts to select the best hyperlink level from as many data points as possible. In the next step, we call the abnormal and healthy portions with different values, for example,

Train images of Japanese Society of Radiological Technology (JSRT) dataset.

Train images of Montgomery County dataset.

Train images of National Library of Medicine (NLM) dataset.
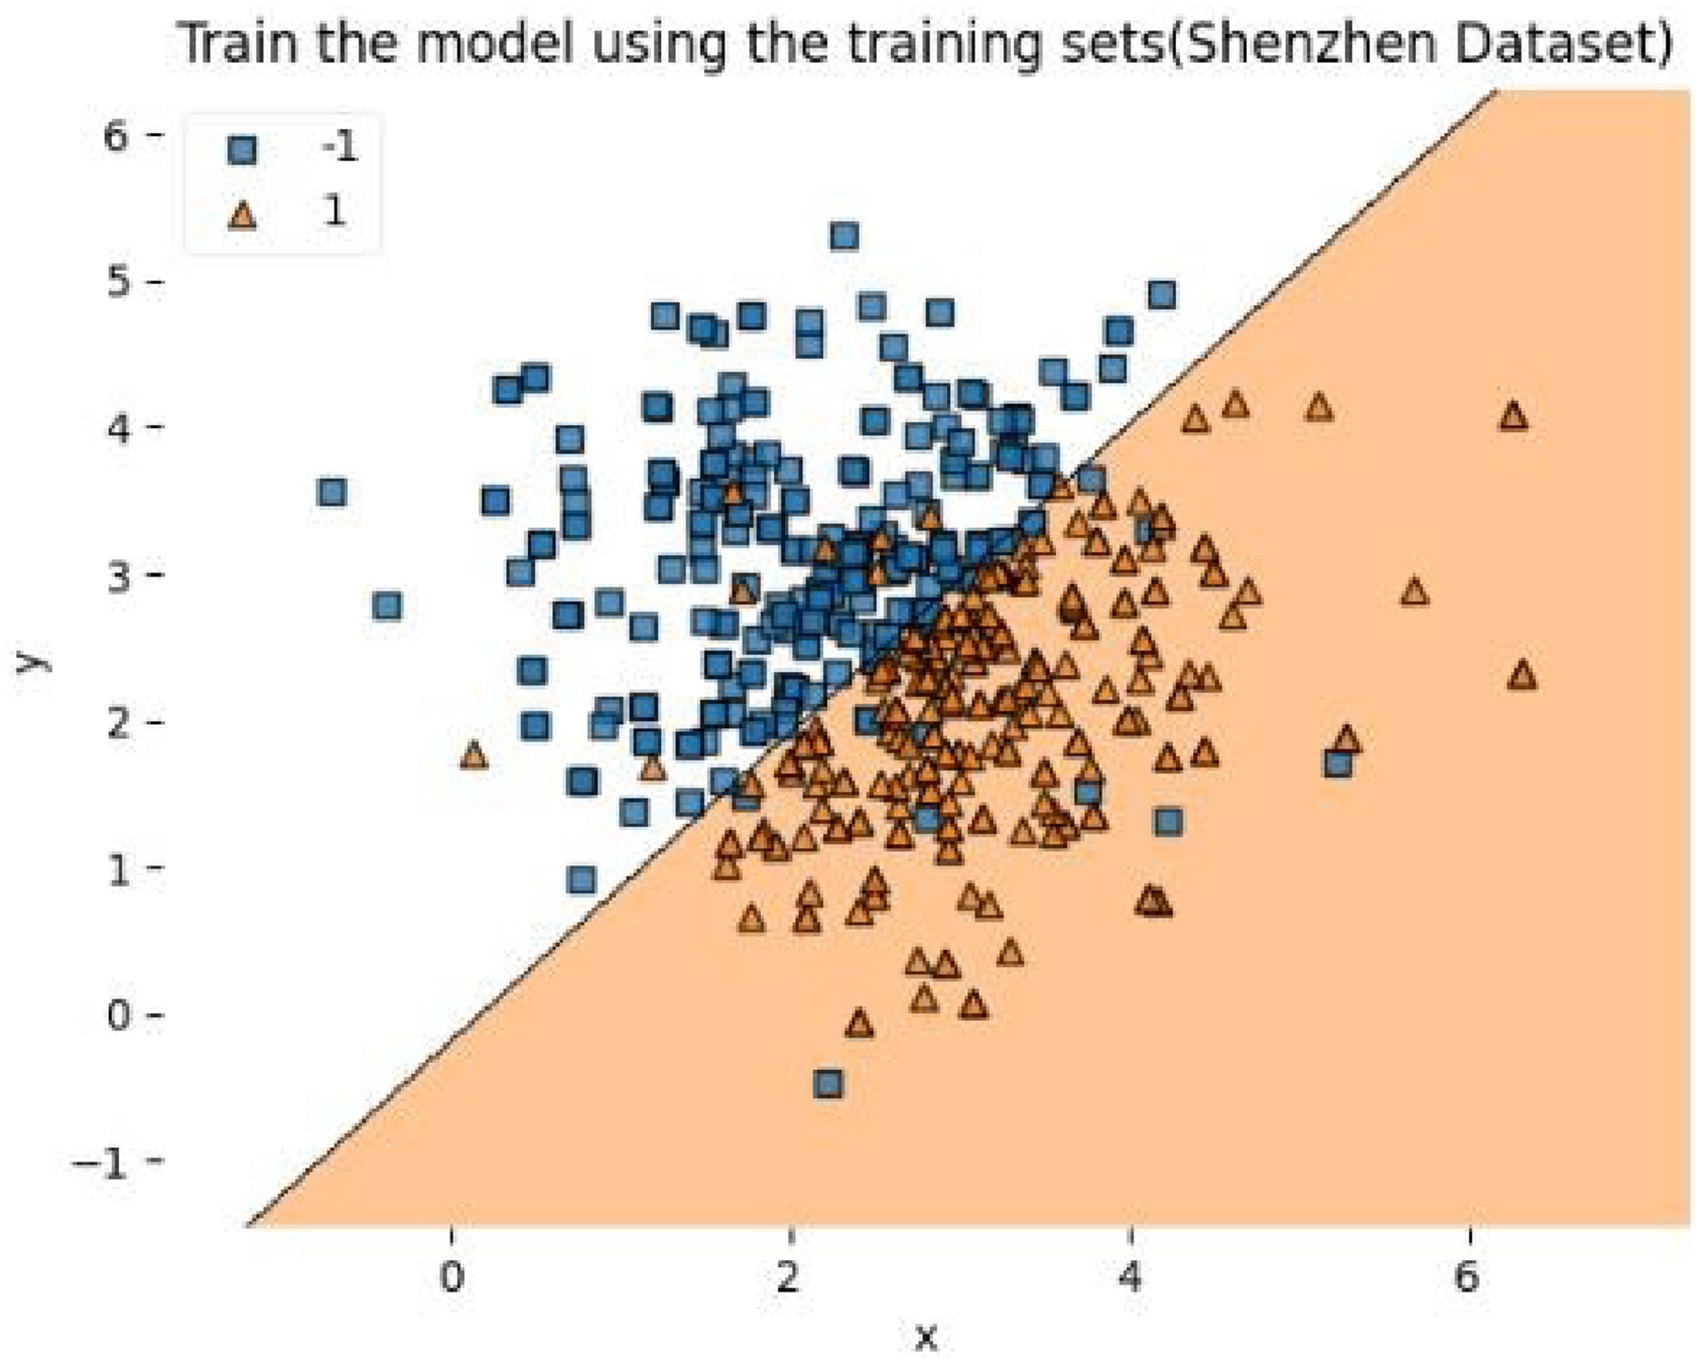
Train images of Shenzhen dataset.
Figure 15 shows the result of the SVM classifier for test data from JSRT, Figure 16 shows the result of the SVM classifier for test data from Montgomery County, Figure 17 shows the result of the SVM classifier for test data from NLM, and Figures 18 and 19 shows the result of the SVM classifier for test data from Shenzhen, both classes are separated by a hyperplane which is the boundary line between both classes.

Test images of Japanese Society of Radiological Technology (JSRT) dataset.

Test images of Montgomery County dataset.

Test images of National Library of Medicine (NLM) dataset.

Test images of Shenzhen dataset.

Automatic segmentation and classification to detect tuberculosis (AuSC-DTB) approach comparison with other studies.
Statistical analysis
The qualitative results of segmentation are presented in Figure 8, and the statistical results are presented in Table 2. The performance of the RW technique is evaluated by considering four known performance matrices, that is, accuracy, dice coefficient, precision, and recall.
Statistical results of segmentation using random walker technique.

The study’s main focus is on classifying TB detection in X-ray images, and segmentation is performed as a prerequisite for better classification. The results can be improved further by choosing more suitable segmentation techniques in the future.
For classification, known assessment measures such as accuracy (recognition level), retrieval (sensitivity), accuracy, and F-score are used to assess our proposed model’s performance and the pre-tell’s performance. The metrics and associated formulas are briefly discussed.
Accuracy
Accuracy is the number of all correct predictions divided by the total number of samples in the dataset.
Recall
The recall measures the integrity of the model, that is, the percentage of advanced sets are marked as such. Its formula is given as follows:
Precision
Precision is the number of correct positive predictions divided by the total number of positive predictions. It is also called a positive predictive value (PPV) and it is given by the following formula:
F-score
The F-score metric provides the best way to measure incorrectly classified labels. It balances precision and recall procedures and provides the following formula:
Confusion matrix
A confusion matrix is a tool used to analyze how well the classification model recognizes records of different classes. Table 3 summarizes the performance of the proposed work.
Evaluation matrix.
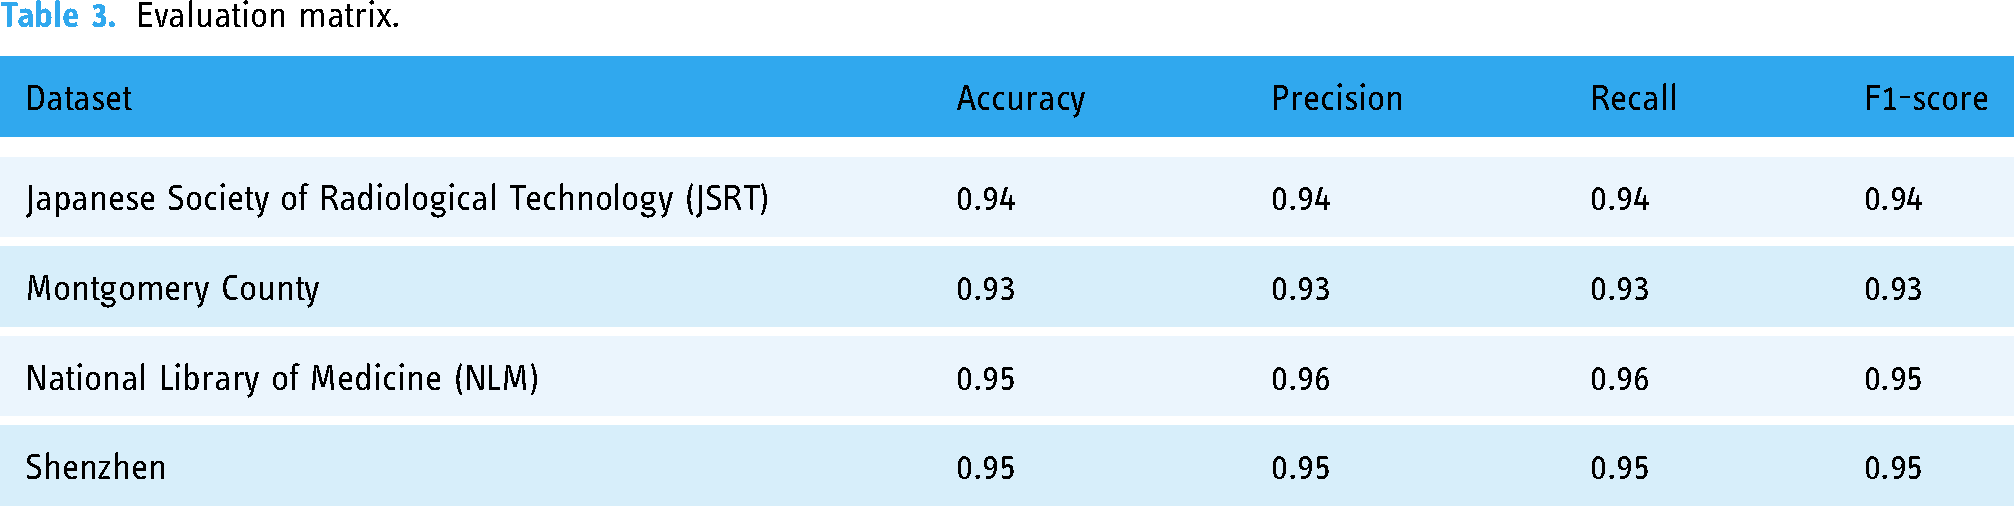
Table 4 summarizes the performance comparison between the proposed and previous work.
Result comparison of AuSC-DTB with other studies.

TB: tuberculosis; CNN: convolutional neural network; ROI: region of interest; LBP: local binary pattern; CXR: chest X-ray; HOG: histogram of oriented gradient; AUC: area under the curve; ACC: accuracy.
In 19, the comparison of the AuSC-DTB approach with other studies is shown in graphical form. the result on different datasets used in the literature review has been shown, On JSRT, the proposed AuSC-DTB approach achieved a higher accuracy of 93%, on Montgomery archives 94%, on Shenzhen archives 95%, on NLM archives 95% accuracy and hence shows better results on all used datasets.
All the steps required for problem-solving are discussed in detail, like preprocessing, image segmentation, feature extraction, and classification. In this article, all results include images taken from the database segmented, and finally classified successfully and identified the healthy and infected CXR images. The proposed technique gives 94% accuracy on JSRT, 93% accuracy on Montgomery, 95% accuracy on NLM, and 95% accuracy on Shenzhen.
Table 5 compares the results of AuSC-DTB with other studies for all four datasets. The study by Evans Kotei et al. achieved 98.46% accuracy in TB detection using a CNN model with unified approaches by employing unified approaches to improve the accuracy-stability of disease detection. The dataset used in this study for training and testing the CNN model was not explicitly mentioned in the provided excerpts. For the Montgomery dataset, the study mentions 81% accuracy, and for the Shenzhen dataset, the accuracy is 90%.
Result comparison of AuSC-DTB with other studies – dataset-wise.

Discussions
The AuSC-DTB framework presented in this study offers a novel approach to enhancing the diagnostic accuracy of TB detection in CXR images. By leveraging image processing techniques within the healthcare domain, the study addresses the challenges radiologists face in accurately diagnosing TB, particularly in resource-constrained regions where the disease poses a significant health threat. The experimental evaluation results demonstrate promising results, with high accuracy rates achieved across four distinct datasets such as JSRT, Montgomery, NLM, and Shenzhen. The accuracy rates of 94%, 95%, 95%, and 93% for these datasets, respectively, highlight the effectiveness of the proposed hybrid approach in distinguishing between healthy and infected CXR images. One of the key strengths of the proposed approach is its multi-step process, which includes image preprocessing, segmentation using the RW algorithm, and feature extraction utilizing LBP and HOG descriptors. The subsequent classification of extracted features using the SVM classifier further enhances the system’s ability to accurately detect TB in CXR images.
In addition, the generalizability of the AuSC-DTB framework is a viable feature, as the combination of image processing techniques employed allows the system to work effectively across various types and formats of datasets. This adaptability contributes to the high accuracy rates achieved across different datasets, making the proposed approach a valuable tool for radiologists and clinicians in the early detection of TB, particularly in rural areas where access to healthcare resources may be limited. While the study demonstrates significant progress in improving TB diagnostic accuracy, several limitations should be acknowledged. These may include constraints related to dataset size and diversity, the need for further clinical validation, and the complexity of the algorithms utilized. Addressing these limitations through future research and development efforts could enhance the robustness and applicability of the AuSC-DTB framework in real-world clinical settings.
However, it is common for a research study to have certain limitations that impact the output, such as the size of datasets, clinical validation, approach complexity, interpretability, and generalizability or applicability of the findings. Some potential limitations of the study could include:
The study may have been limited by the size or diversity of the datasets used for evaluation. Despite of the use of four different datasets which is a big advantage of the study can be more beneficial if Larger and more diverse datasets is used. The more diverse datasets could provide a more comprehensive assessment of the proposed approach’s performance. The study demonstrates promising results in image analysis using four datasets, the lack of clinical validation or real-world testing could be a limitation in terms of practical application in healthcare settings which can be overcome developing a comprehensive application. The complexity of the image processing techniques and classification models used in the study could pose challenges in terms of implementation and scalability in real-world clinical environments. The interpretability of the results and the decision-making process of the proposed approach may not be fully transparent, which could impact healthcare professionals’ trust and adoption of the system. The study may have focused on specific datasets or imaging conditions, which could limit the generalizability of the results to other settings or populations and implementation towards real-world clinical settings.
It is important to acknowledge the study’s limitations, which provide a more comprehensive understanding of the implications and potential constraints of the findings.
Conclusion
The article “AuSC-DTB” makes several significant contributions to the field of medical image analysis and TB detection using CXR images. The article introduces a novel hybrid approach, the AuSC-DTB framework, for detecting TB in X-ray images. This approach combines image preprocessing, segmentation techniques, feature extraction methods, and ML classification to enhance the accuracy of TB detection. The AuSC-DTB framework aims to improve the diagnostic accuracy of TB detection in CXR images across multiple datasets. The article includes a comparative analysis of the AuSC-DTB approach with other studies in the literature, showcasing superior accuracy rates on different datasets. This comparative evaluation highlights the effectiveness and robustness of the proposed framework in TB detection using CXR images.
The AuSC-DTB framework, which demonstrates promising results in the accurate diagnosis of TB from CXR images. This framework addresses the challenges faced by radiologists when dealing with TB diagnosis and aims to overcome limitations observed in previous techniques applied to diverse datasets. The experimental results obtained on four different datasets (JSRT, Montgomery, NLM, and Shenzhen) have shown impressive diagnostic accuracy, with performance metrics ranging from 93% to 95%. The experimental results show high accuracy for TB diagnosis on these datasets: 94% for JSRT, 95% for Montgomery, 95% for NLM, and 93% for Shenzhen. The results are compared with recent studies, and the proposed hybrid approach outperformed them. The ability to consistently achieve high accuracy across different datasets is a crucial step towards a more robust and reliable TB diagnosis system.
The AuSC framework has many potentials for further advancements and improvements in the field of medical image analysis and disease diagnosis for healthcare, such as
Dimensionality reduction techniques such as PCA or t-distributed stochastic neighbor embedding (t-SNE) are commonly used in ML to reduce the number of features and improve computational efficiency. Their specific application in the AuSC-DTB framework will enhance both computational and detection efficiency. To make the framework ready for clinical use, rigorous validation and clinical trials are necessary. Collaboration with healthcare institutions to assess its real-world impact and usability is essential. The developed approach has the potential to be generalized for the diagnosis of other diseases based on X-ray images. Extending the framework to detect and classify other respiratory or thoracic diseases can significantly enhance its clinical utility. Expanding the framework to work with different imaging modalities, such as computed tomography (CT) scans and magnetic resonance imaging (MRI) images, can provide a more comprehensive and accurate diagnostic system. The AuSC-DTB framework can be integrated into telehealth platforms to enable remote diagnosis, particularly in areas with limited access to specialized healthcare. Real-time diagnosis: Developing the framework to provide real-time diagnosis and support for healthcare professionals during the diagnostic process can be immensely valuable in clinical settings. Improving the framework’s ability to handle diverse datasets can be achieved through advanced data augmentation techniques and transfer learning, allowing it to adapt to new data sources more effectively. The classification results can be improved further by choosing more suitable segmentation techniques in the future. Enhancing the interpretability of the AI model’s decisions can build trust among healthcare practitioners and ensure transparency in the diagnostic process. Designing a user-friendly interface for the framework to make it accessible and intuitive for healthcare providers, even those with limited expertise in image analysis. Collaborating with global health organizations and institutions to deploy the framework in regions with limited resources can have a significant impact on early TB detection and treatment.
Footnotes
Acknowledgements
This research has no funding.
Author contributions
MK: supervision; conceptualization; methodology; validation; writing–review and editing; investigation; roles/writing original draft preparation. AZ: conceptualization; methodology; formal analysis; and investigation. SSK: conceptualization; methodology; formal analysis; investigation; and roles/writing original draft preparation. MA: supervision; validation; and writing–review and editing.
Consent statement
The dataset contains images (chest X-rays) with complete anonymity which are available online. The demographic information of the patients was not extracted.
Data availability statement
The datasets are available online publicly.
Declaration of conflicting interests
The author(s) declared no potential conflicts of interest with respect to the research, authorship, and/or publication of this article.
Funding
The author(s) received no financial support for the research, authorship, and/or publication of this article.