
Abstract
Background
Falls pose a serious health risk for the elderly, particular for those who are living alone. The utilization of WiFi-based fall detection, employing Channel State Information (CSI), emerges as a promising solution due to its non-intrusive nature and privacy preservation. Despite these advantages, the challenge lies in optimizing cross-individual performance for CSI-based methods.
Objective
This study aimed to develop a resilient real-time fall detection system across individuals utilizing CSI, named TCS-Fall. This method was designed to offer continuous monitoring of activities over an extended timeframe, ensuring accurate and prompt detection of falls.
Methods
Extensive CSI data on 1800 falls and 2400 daily activities was collected from 20 volunteers. The grouped coefficient of variation of CSI amplitudes were utilized as input features. These features capture signal fluctuations and are input to a convolutional neural network classifier. Cross-individual performance was extensively evaluated using various train/test participant splits. Additionally, a user-friendly CSI data collection and detection tool was developed using PyQT. To achieve real-time performance, data parsing and pre-processing computations were optimized using Numba's just-in-time compilation.
Results
The proposed TCS-Fall method achieved excellent performance in cross-individual fall detection. On the test set, AUC reached 0.999, no error warning ratio score reached 0. 955 and correct warning ratio score reached of 0.975 when trained with data from only two volunteers. Performance can be further improved to 1.00 when 10 volunteers were included in training data. The optimized data parsing/pre-processing achieved over 20× speedup compared to previous method. The PyQT tool parsed and detected the fall within 100 ms.
Conclusions
TCS-Fall method enables excellent real-time cross-individual fall detection utilizing WiFi CSI, promising swift alerts and timely assistance to elderly. Additionally, the optimized data processing led to a significant speedup. These results highlight the potential of our approach in enhancing real-time fall detection systems.
Keywords
Introduction
Background
Falls are the leading cause of fatal and nonfatal injuries among older people, especially those living alone. Society faces significant healthcare issues caused by an aging population. The number of people aged over 65 is expected to reach 1.6 billion by 2050. 1 The World Health Organization (WHO) reported that about 35% of them fall at least once a year. 2 Approximately 20 million older adults in China fall at least once annually. The direct medical cost of these falls is approximately 5 billion yuan, while the indirect social costs reach about 60–80 billion yuan. 3 Approximately 25% of adults aged 65 and over in the United States have experienced a fall, resulting in an annual expenditure of $30 billion in medical costs.4,5 The mortality rate from falls has been observed to increase, especially in the elderly over the age of 75.6,7 Effective and prompt fall detection strategies may profoundly benefit society. In other words, the earlier the falls are detected, the lower the mortality rate. 8 Quick and timely detection of these falls is crucial to providing urgent assistance.
Method of fall detection
The following three approaches can be used to perform fall detection: wearable device-based, vision-based and ambiance device-based. 9 Wearable devices must be fixed to the human body at a certain position, 10 which can cause a disconnection problem. This makes wearable devices unfavorable, especially for the elderly. Continuous surveillance using vision-based systems can yield satisfactory detection results. 11 However, this approach raises ethical concerns related to confidentiality and privacy, issues that are currently under active consideration and resolution. Using ambiance devices, such as radar, infrared array sensors, microphone array sensors or Wi-Fi devices, can help circumvent the aforementioned issues. For instance, radar-based methods may detect fall motions by extracting features from radar-reflected signals using deep neural network models. 12 Infrared array sensor-based methods can detect fall motions based on temperature changes between consecutive frames. 13 Microphone array sensor system comprises a circular microphone array that captures sounds in a room. When a sound is detected, the system locates the source, enhances the signal and classifies it as “fall” or “non-fall.” 14 The Wi-Fi-based fall detection method relies on channel state information (CSI), which contains multi-path information from the transmitter to the receiver. This method detects falls by analyzing the interference of human activity on amplitude and phase information of CSI. Among these, WiFi offers advantages such as contactless, confidentially and widespread use.
Channel state information
In a typical indoor environment, Wi-Fi signals propagate through multiple paths via ceilings, floors, walls and furniture, resulting in “multipath effects.” Wi-Fi commonly employs orthogonal frequency division multiplexing (OFDM) modulation that divides high-speed data into multiple low-speed data streams modulated on different orthogonal subcarriers. In multiple-input multiple-output (MIMO) systems, the receiver can obtain CSI corresponding to multiple transmit antennas. CSI reflects the amplitude attenuation and phase shift characteristics of the multiple propagation paths from the transmitter to the receiver. When a human body moves in the Wi-Fi environment, its scattering affects the original propagation paths of the wireless signals. The received signals will contain information about human motion in the environment. By analyzing CSI across OFDM subcarriers and multiple antenna pairs in MIMO systems, applications in lip language recognition, 15 people counting, 16 user authentication, 17 gesture recognition,18,19 moving speed estimation, 20 activity recognition21–24 and fall detection25–35 can be achieved.
CSI-based fall detection
By analyzing the amplitude and phase information of CSI across OFDM subcarriers and multiple antennas in MIMO systems, substantial progress has been made in CSI-based fall detection. The fine-grained multipath profile contained in CSI can capture minute motions and environmental changes caused by human falls. Various machine learning techniques like random forests (RF), 25 support vector machine (SVM),26–31 convolutional neural network (CNN)32,33 and long short-term memory (LSTM)30,34,36 have been applied on these features to build robust fall detection models. Despite the tremendous effort, most existing methods do not distinguish between individuals during model training and testing. This approach achieves high accuracy for the target user but results in poor generalization for new individuals.
For instance, Shalaby et al. 32 collected CSI from six volunteers, but they amalgamated all the CSI data before cross-validation. Meanwhile, Guo et al. 21 gathered CSI from 10 volunteers and attained an accuracy of 93.50% within the same individual dataset. Nevertheless, when applied to a cross-individual dataset, the accuracy dropped to approximately 60%. To overcome this challenge, cross-individual models that can maintain high performance across different users are needed.
Aims of the study
The aim of this study was to develop the TCS-Fall method for cross-individual real-time fall detection using CSI. This method was designed to offer continuous monitoring of activities over an extended timeframe, ensuring accurate and prompt detection of falls. Additionally, a user-friendly tool for the collection and analysis of CSI data was developed to facilitate ease of use and enhance the overall applicability of the proposed fall detection system.
Methods
Ethics approval
The data collection was approved by the Medical Ethics Committee of the Affiliated Hospital of Xuzhou Medical University (Document No.: AF-35/06.1, Opinion No.: XYFY2021-KL269-01). Written informed consent was obtained from all study participants prior to the commencement of the study, as required by the Ethics Committee.
Study design
This research is a method development and evaluation study, which involves the collection of a substantial amount of WiFi CSI data from 20 volunteers, the creation of a deep learning model capable of performing real-time cross-individual fall detection, and the development of a corresponding application tool. The study was carried out between July and August 2022 in the home simulation laboratory at Xuzhou Medical University.
In the data collection part, WiFi CSI was meticulously gathered from a diverse group of 20 volunteers (equally divided between male and female). This encompassed data from 1800 falls, 2400 confusing events and 36,000 s of time-continuous actions.
In the model construction part, the novel TCS-Fall method was introduced, utilizing the grouped coefficient of variation (GCV) of CSI amplitudes as input features for a CNN classifier. Cross-individual performance was thoroughly assessed with various train/test volunteer splits, and model performance was evaluated on test data. In addition to the commonly used AUC metric, this study employed the no error warning ratio (NEWR) and correct warning ratio (CWR) metrics to assess the performance of time-continuous fall detection.
In the tool development part, a data collection, data preprocessing and fall detection tool was developed based on the PyQT package in a Python environment. To achieve real-time performance, data parsing and preprocessing computations were optimized using Numba's just-in-time (JIT) compilation.
Data collection (study 1)
Room environment
The data were collected in the room with one transmitter (Tx), one signal receiver (Rx), two chairs, a mattress (180 × 200 × 25 cm), a table with a book, a waterglass and a mobile phone, as shown in Figure 1. All the volunteers performed daily activities and fell around chairs A and B.
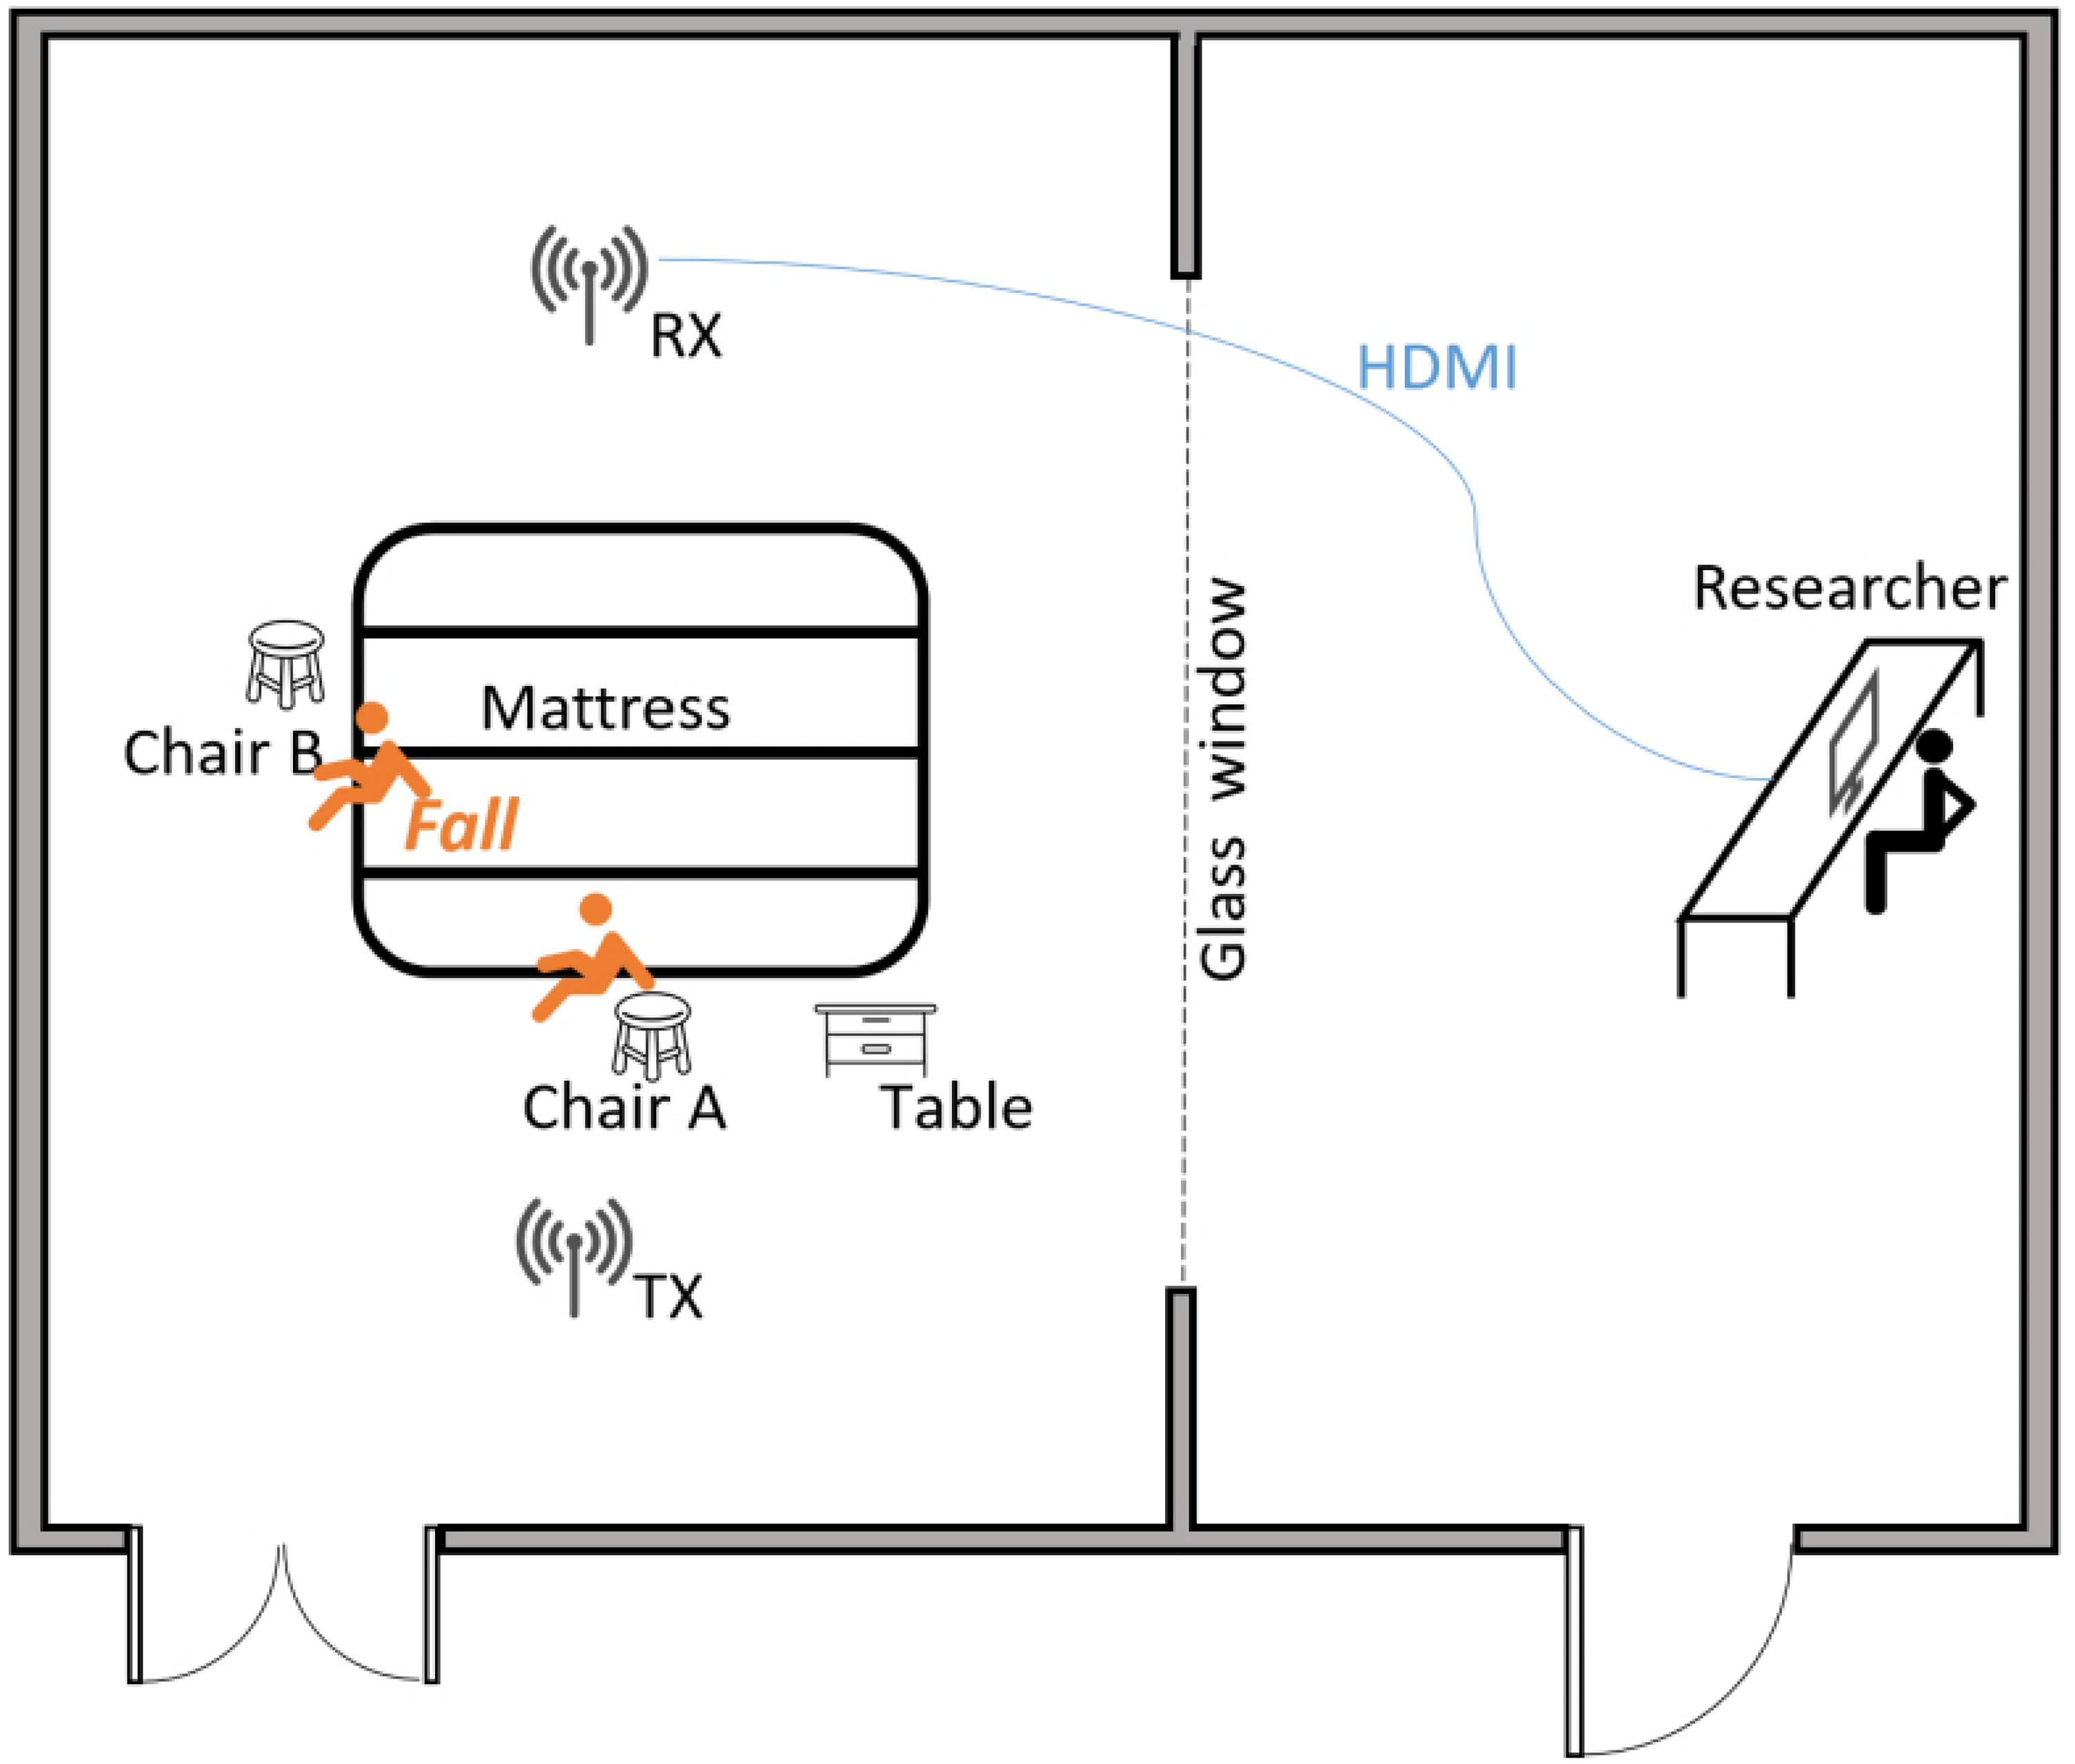
Room environments.
Hardware and software
A computer with an Intel Core i3-3240 CPU was used as the transmitter, and a computer with an Intel Core i5-9400F CPU was employed as the receiver. Both computers were equipped with an IEEE 802.11n Intel Wi-Fi Link 5300 chipset. The CSI tool proposed by Halperin et al. 37 was deployed on computers to collect CSI data.
Volunteer's attributes
Twenty volunteers, comprising of 10 males and 10 females, were recruited to participate in this experiment in order to mitigate any potential gender-related errors. Their ages ranged from 19 to 26 years old, heights from 153 to 181 cm, and weights from 40 to 80 kg to control for differences in body composition. The detailed data are shown in Table 1.
Volunteer's attributes.

Single-action and time-continuous stack samples
A series of single-action (SA) samples and time-continuous stack (TCS) samples were collected from 20 volunteers. The actions detailed in Table 2 were repeated multiple times from different angles, directions and postures. This approach ensured a comprehensive and varied dataset for analysis.
Detail of SA samples and TCS samples.

For SA samples, 8 s of data were collected in each sample, repeated 30 times. SA samples were collected from 1800 falls and 2400 confusing events. For TCS samples, 150 s of data were collected in each sample, repeated two times. In the initial 120 s, volunteers engaged in various daily activities. In the final 30 s, volunteers experienced a single fall at a randomly chosen moment, and the time of the fall was recorded. TCS samples were collected from approximately 36,000 s of time-continuous actions.
Data format
All filenames were saved in the format of “a_[Volunteer ID]_[Action ID]_[Repetition times].dat.” The volunteer ID ranged from 1 to 20, representing the 20 volunteers in the data collection. The Action ID refers to the activity being performed, as detailed in Table 2. The activities include falls as well as daily routines like sitting, standing, walking, etc. Repetition times indicate the repeat number of that action, ranging from 0 to 29.
For example, the filename “a_01_02_03.dat” indicates the data file for volunteer with ID “01” performing action “02” for the fourth time, since the repetition is “03.” This systematic naming format allowed clear organization of the extensive dataset collected in the study.
Model construction (study 2)
Get CSI data from file with numba
This study analyzed the construction of binary “.dat” files based on the initial version of csitool released by Halperin et al.37,38 The binary file contains multiple packets. The binary file contains multiple packets, and the structure of each packet is illustrated in Figure 2. Each block in the figure represents one byte.

Structure of the binary packet.
When the value of “code” is 187, the packet contains CSI information; otherwise, it contains other information. In the packet, the length of the packet is parsed using big-endian byte order, while the other parameters are parsed using little-endian byte order. The “Ntx” field means the number of transmit antennas, while the “Nrx” field means the number of receive antennas. The fields “rssi_a,” “rssi_b” and “rssi_c,” respectively, represent the received signal strength indication (RSSI) on antennas A, B and C. The “noise” field represents the level of background noise present in the received signal. The field “agc” represents the automatic gain control value, indicating the level of signal amplification adjustment performed by the receiver. The ”antenna” field denotes the antenna selection, indicating which antennas are being utilized for reception. The “fake_rate_n_flags” field denotes the fake rate and associated flags, providing information about the simulated transmission rate and additional flags.
The CSI data is stored in the field “payload,” the structure of which is illustrated in Figure 3. For the sake of illustration, the figure depicts two subcarriers, each containing only two data points. Each small block in the image represents 1 bit, and 8 blocks make up one byte.
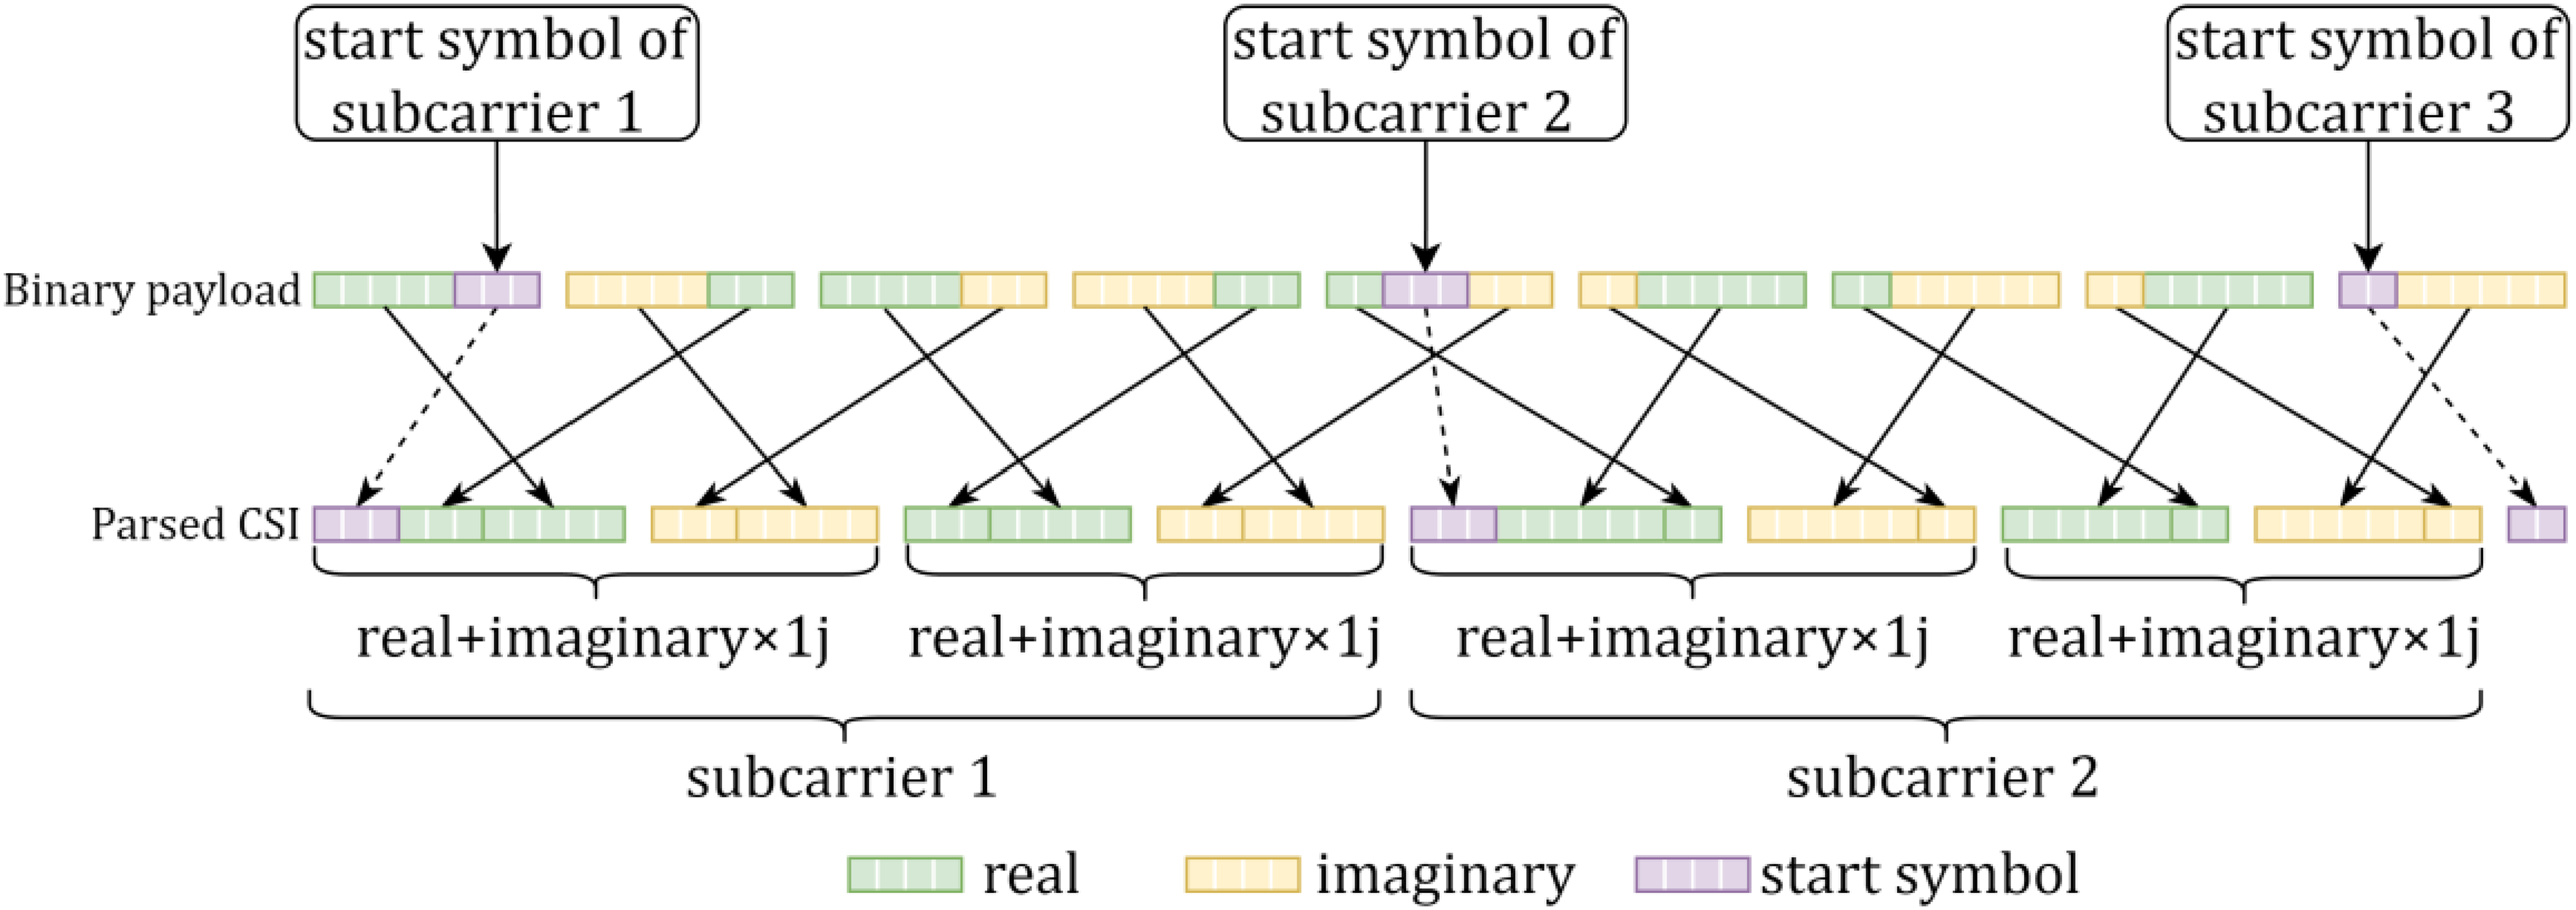
Structure of the binary payload.
To improve the speed, the method for parsing CSI from Payload was optimized using Numba, as presented in Algorithm 1. In this algorithm, the “mod” function refers to the modulo operation, the “div” function refers to the division operation and the “int8” function is used to convert a numerical value to an 8-bit signed integer type.
CSI ← ℂNtx × Nrx × 30 index ← 0 index ← index + 3 r ← s ← real ← (payload[s] >> r)|(payload[s + 1] << (8 − r))&255 imag ← (payload[s + 1] >> r)|(payload[s + 2] << (8 − r))&255 CSI[k, j, i] ← index ← index + 16 End for End for End for Return CSI
To eliminate the effects of attenuation and interference as much as possible, 38 the csi data must be scaled as illustrated in Figure 4. The “dbinv()” function in the figure converts dBm values to linear power values, and the “GetTotalRss()” function calculates the total RSSI from a CSI struct.
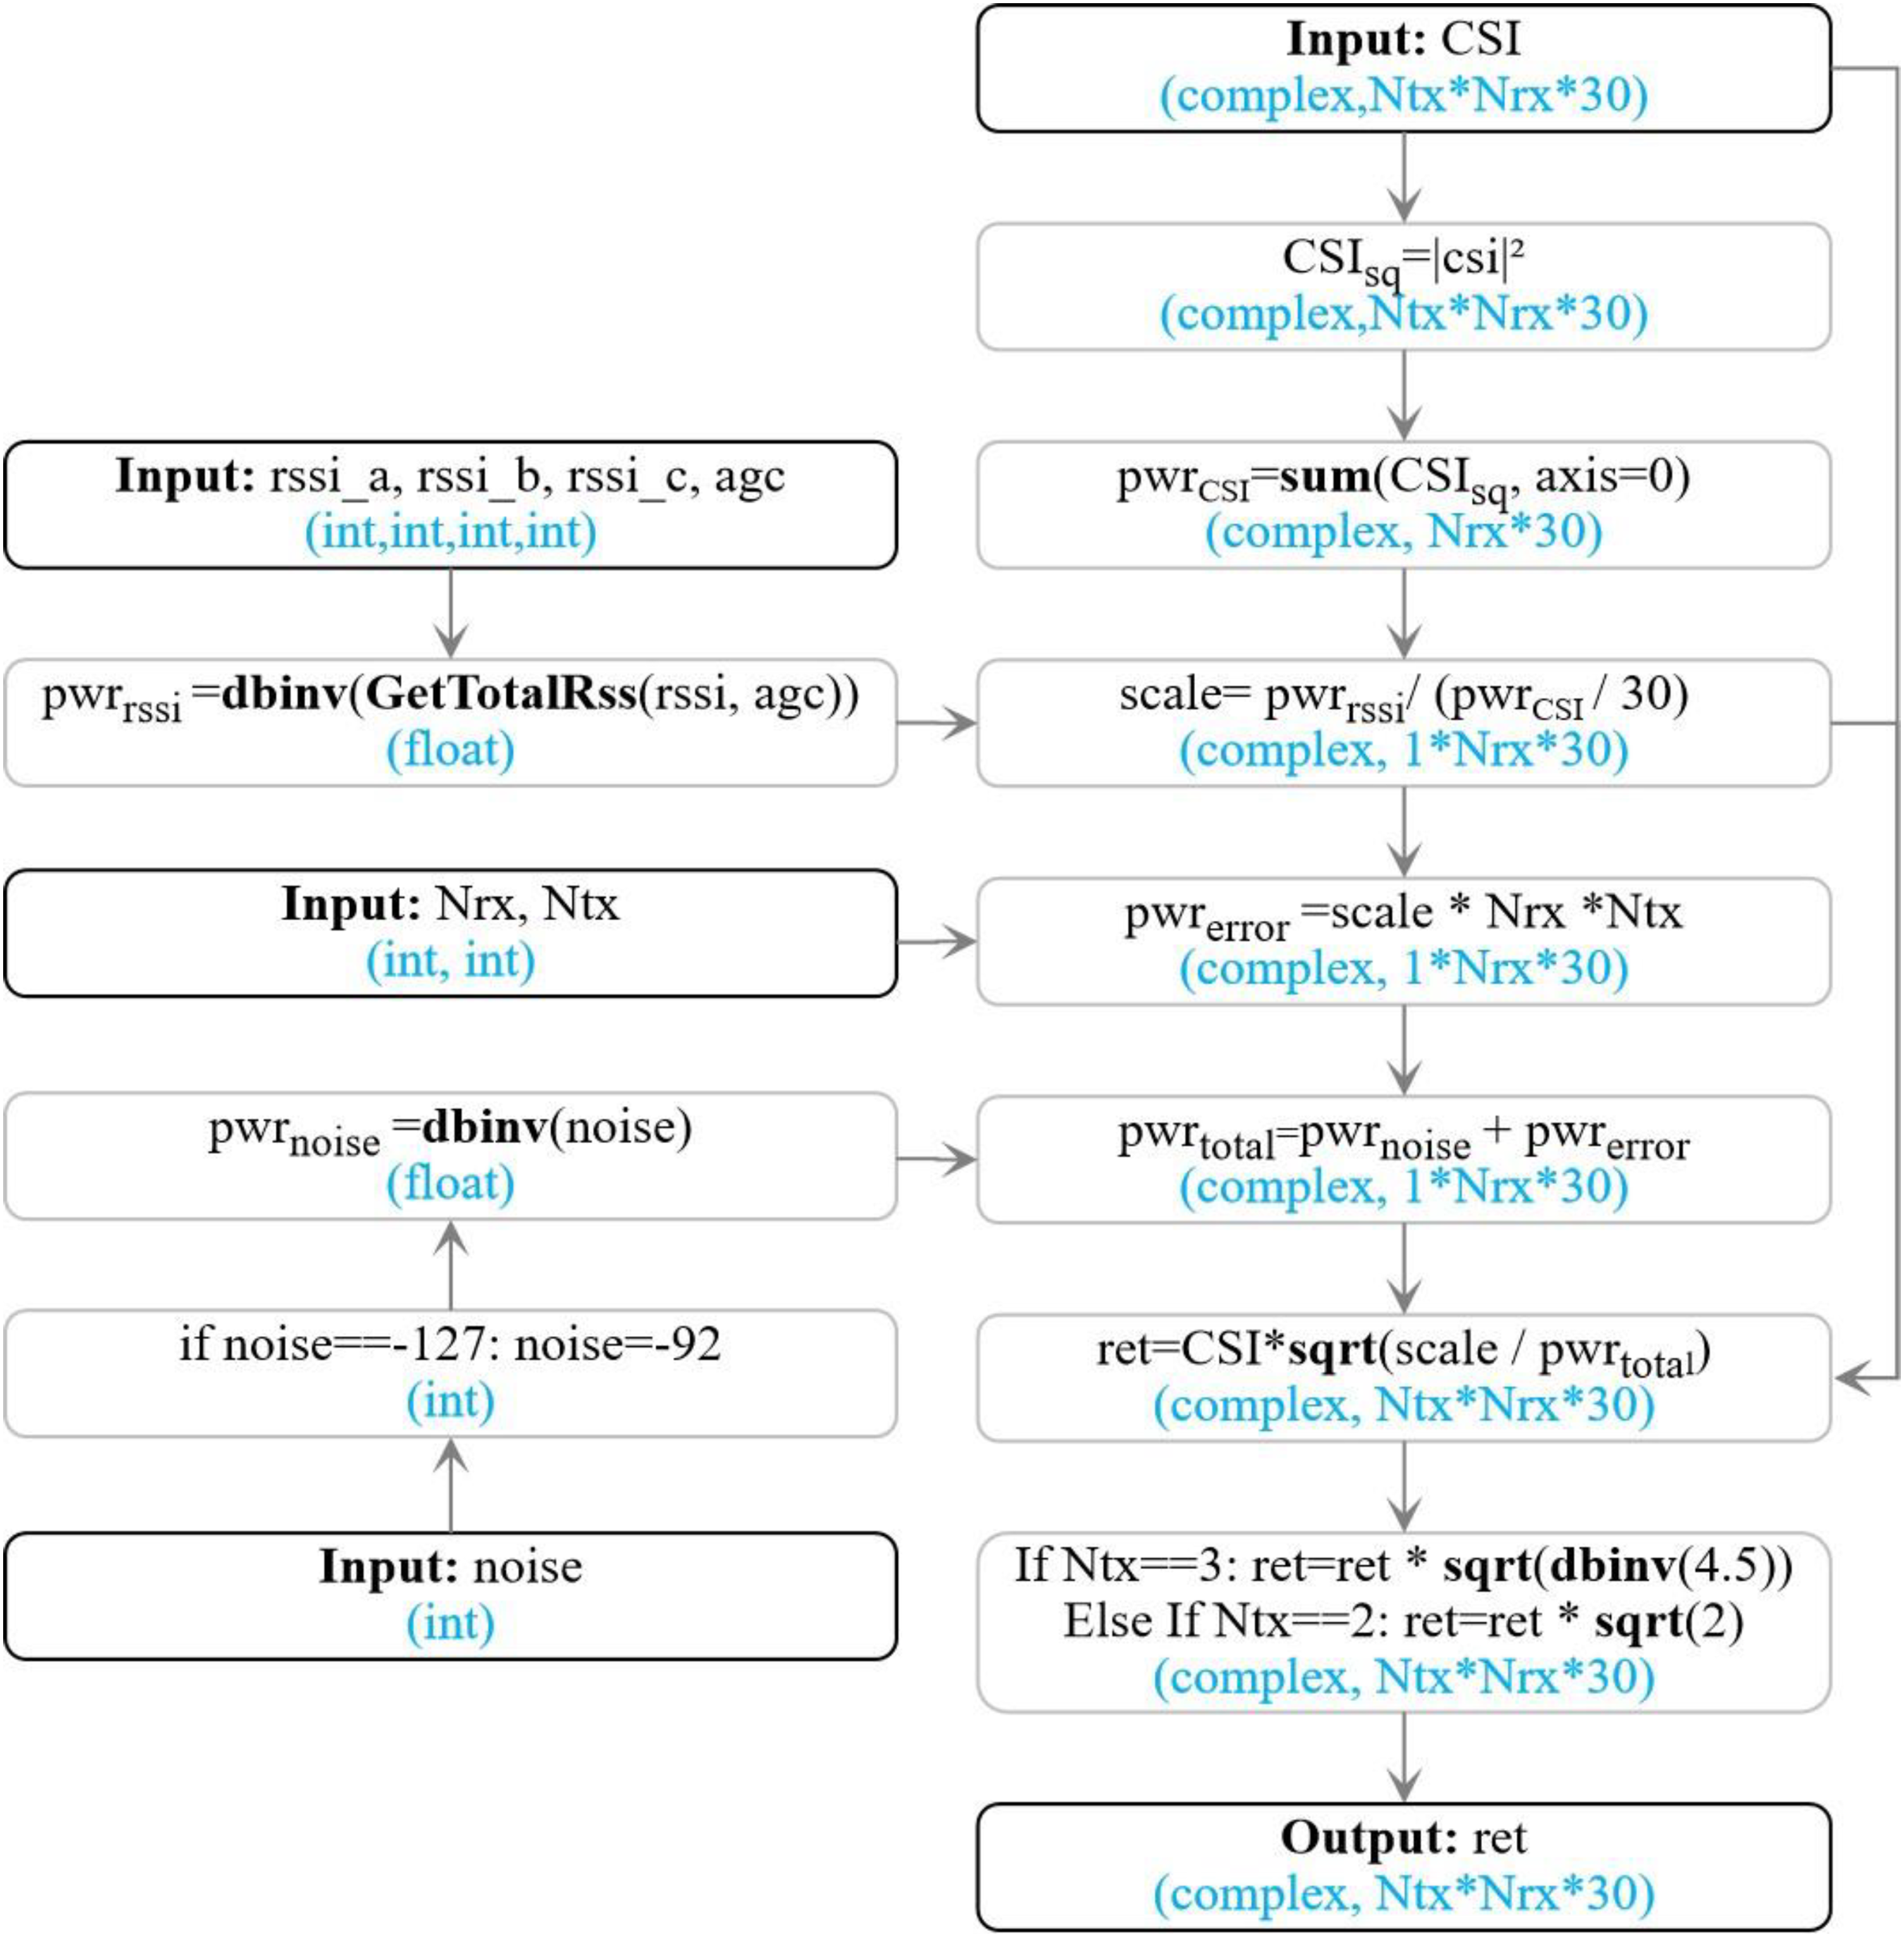
Get scaled CSI with numba.
Standardization of samples
The SA and TCS samples data were standardized in the same format. For the SA samples, each sample contained 8 × 1000 = 8000 packets. For the TCS samples, an 8-s time window was adopted to slide forward by 1 s each time to obtain the sliced item as shown in Figure 5. Each sliced item contained 8 × 1000 = 8000 packets.

Standardization of samples and dataset split.
The communication between the transmitter and receiver employs 3 × 3 MIMO data. Each transmitter–receiver pair comprises 30 groups of subcarriers reported by the Intel 5300 NIC. 37 A standardized sample includes 8000 × 3 × 3 × 30 elements. Due to the homogeneity of the transmitter data, only 8000 × 1 × 3 × 30 = 8000 × 90 elements were used in this study. The original amplitude signals for various actions are shown in Figure 6(a)–(c).
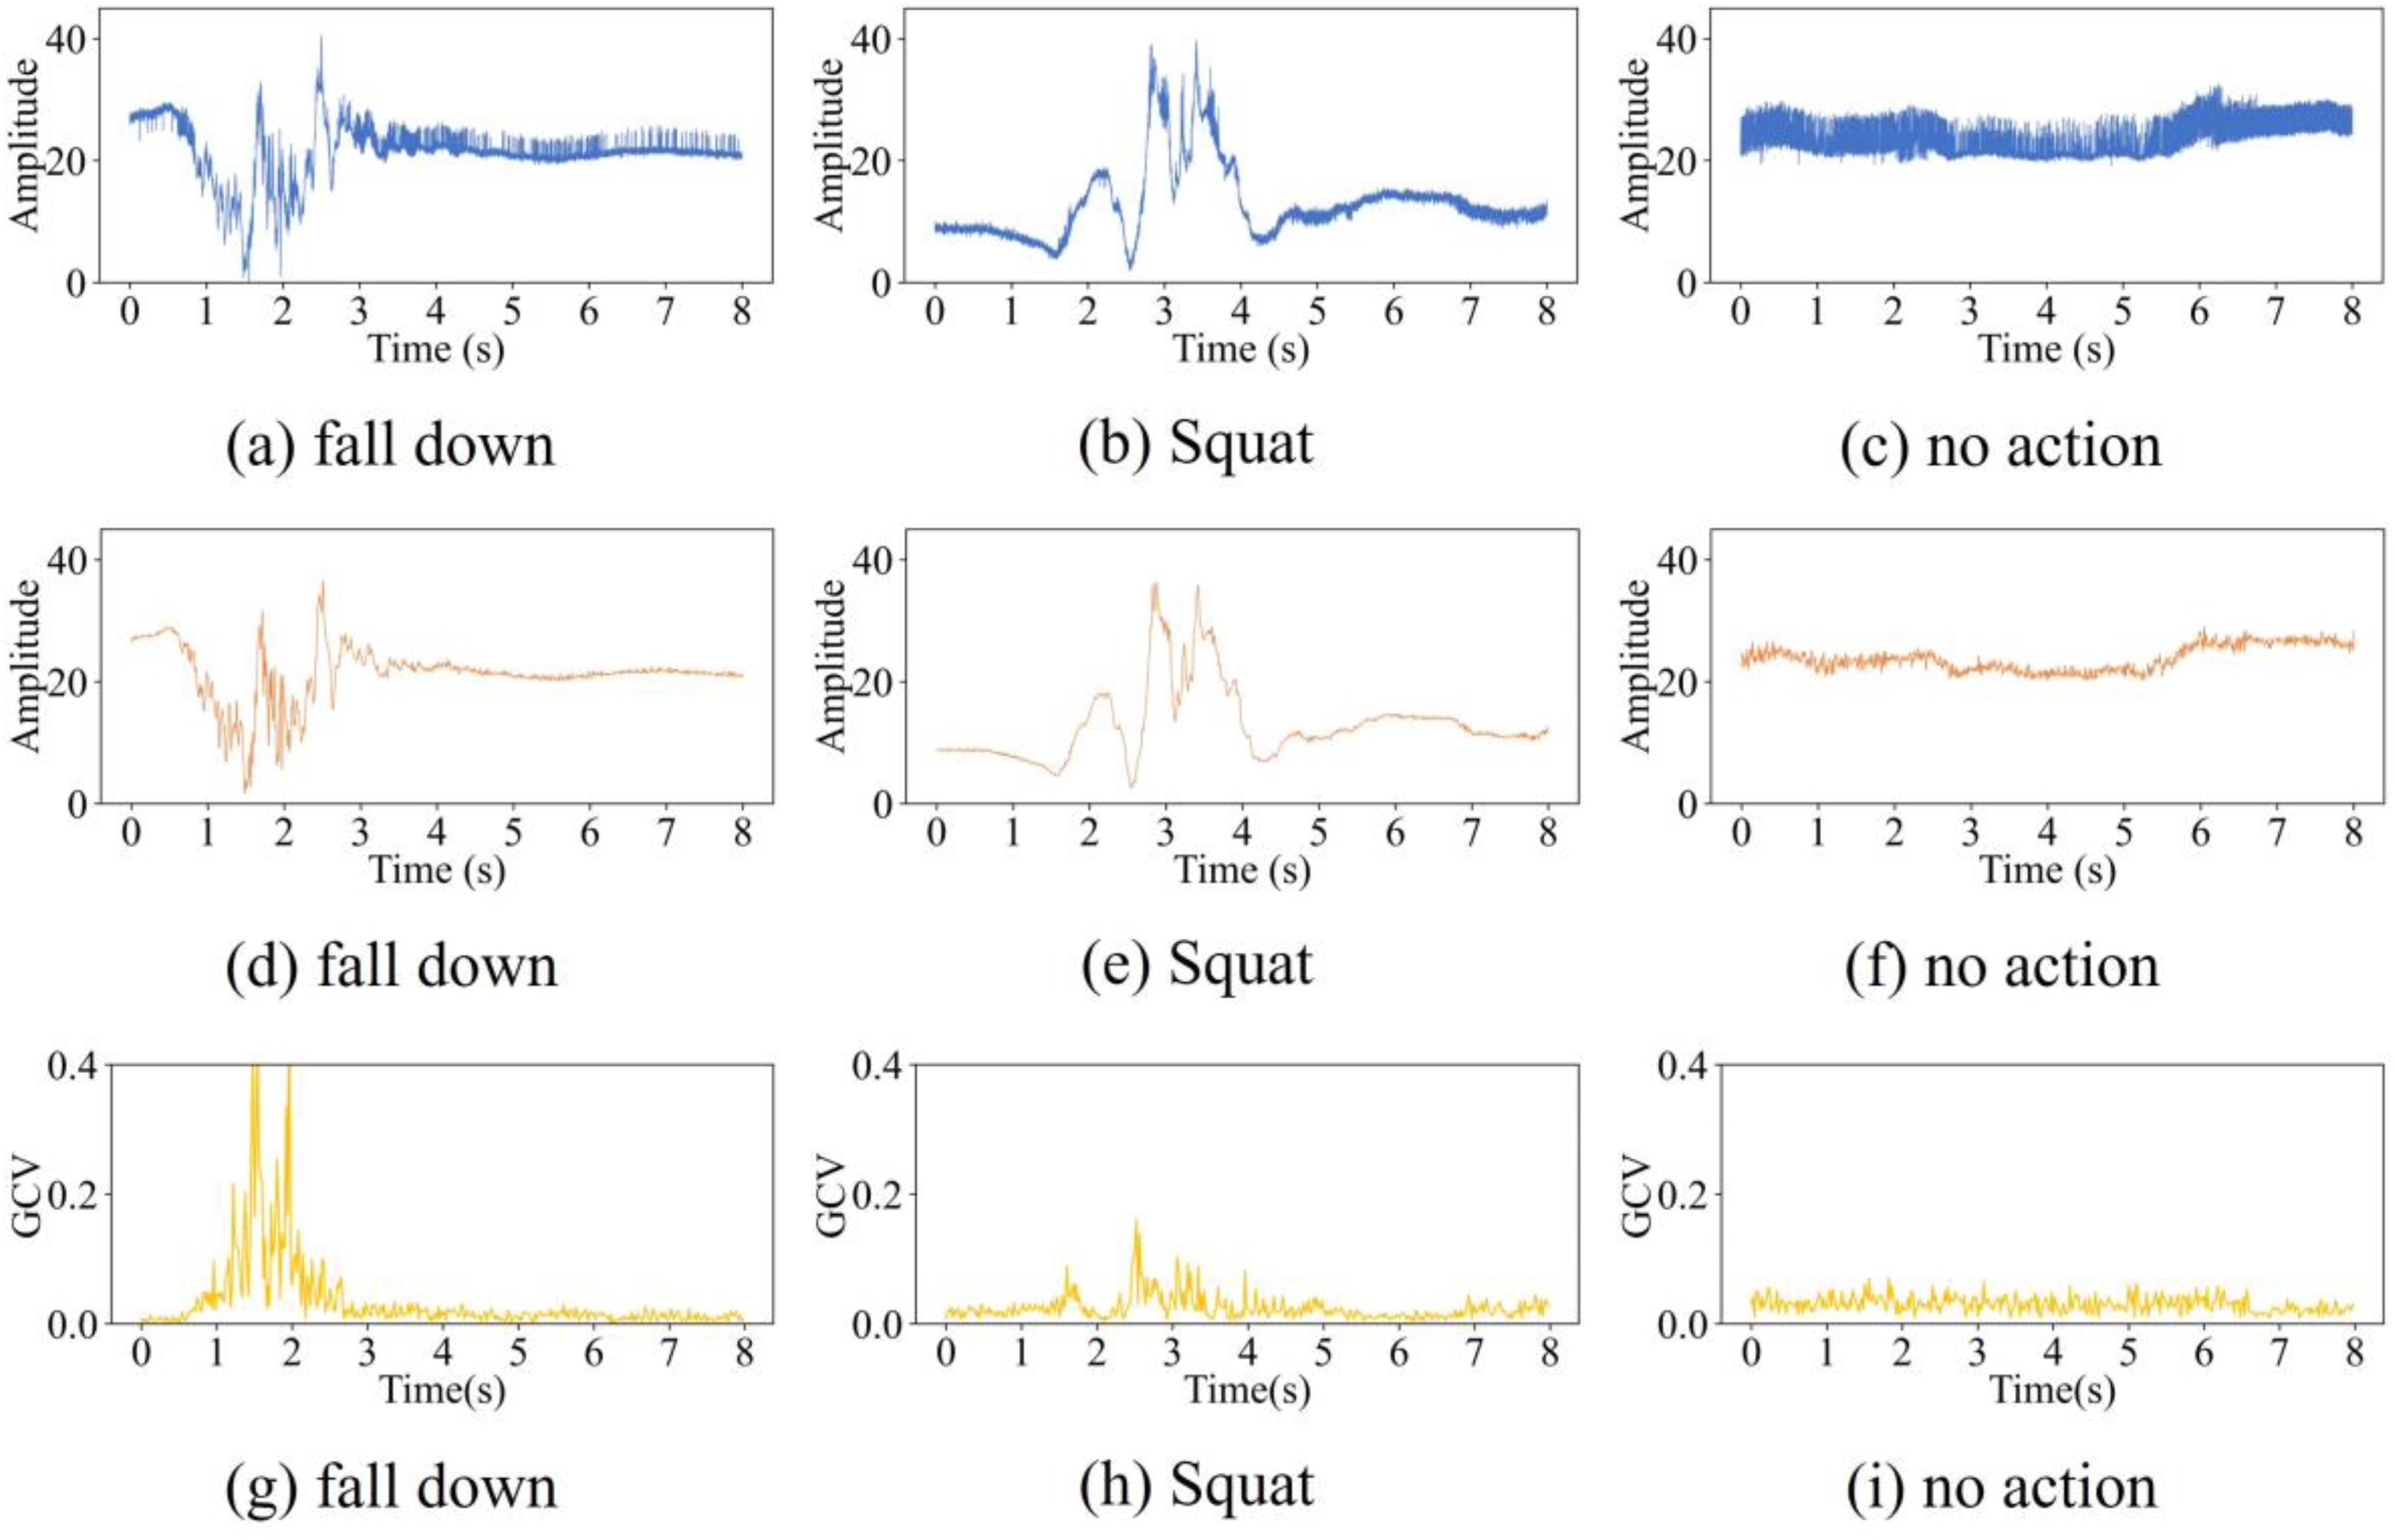
The waveforms of different actions. (a–c): the original amplitude signal of CSI. (d–f): the filtered amplitude signal of CSI. (g–i): the GCV features of CSI.
Dataset split
Training and test dataset: As shown in Figure 5, the training and test dataset comprised SA samples and sliced items extracted from the initial 120 s of TCS samples. SA samples containing falls were designated as positive samples, while the rest were labeled as negative samples. To avoid the over-fitting problem and perform cross-individual identification, the k-fold method was employed to divide the training and test sets based on the volunteer ID rather than the sample ID. If a volunteer is assigned to the training set, all the samples generated by that volunteer will also be allocated to the training set.
This study employed three modes to divide the training and test sets to evaluate the model's performance under different training data sizes. Mode 1: 10-fold cross-validation is used, with data from 2 volunteers used for training and data from the other 18 volunteers used for testing in each validation. Mode 2: 2-fold cross-validation is used, with data from 10 volunteers used for training and data from the other 10 volunteers used for testing in each validation. Mode 3: 10-fold cross-validation is used, with data from 18 volunteers used for training and data from the other 2 volunteers used for testing in each validation. To mitigate the effects of randomness, all evaluation metrics presented in the results are calculated as the average of k-fold cross-validation.
TCS dataset: As shown in Figure 5, the TCS dataset consisted of all sliced items extracted from TCS samples. This dataset was utilized to assess the model's performance over an extended duration. To avoid data overlap, only the data from volunteers in the test dataset was used during the model evaluation.
Noise filter
Butterworth filter is the most commonly used infinite impulse response (IIR) filters. 28 It does not introduce any ripple in the passband or stopband, making it ideal for applications where a smooth frequency response is required.
In this step, the bidirectional Butterworth low-pass filter was used to remove the background noise in the experimental environment with high frequency above 100 Hz. The original and filtered amplitude signals of different actions are shown in Figure 6 (d)–(f).
GCV of CSI amplitude
To extract features of CSI amplitude variations, this article employs the GCV method. GCV can reflect the degree of change in CSI amplitude and is not influenced by baseline values. The calculation formula is as follows:
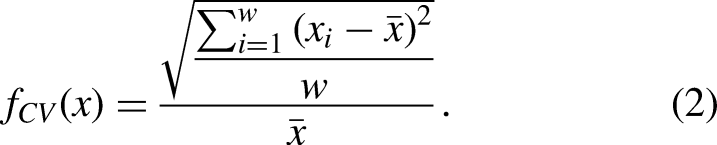
After dimensional reduction by GCV, the dimension of CSI signal in time axis is decreased to 1/w of the original signal. These GCV features are fed as inputs into the neural network model, which can effectively improve the classification performance. By adjusting the size of w, data compression and computational efficiency can be balanced. Excessive compression may lead to reduced features while insufficient compression cannot effectively optimize efficiency. In this study, w = 20 is chosen through optimization to achieve the best balance between efficiency and feature integrity. Finally, a 400 × 1 × 3 × 30 matrix is obtained and used as inputs for the subsequent neural network process. The GCV features of different actions are shown in Figure 6(g)-(i).
Standardization of data
To obtain better performance of the neural network models, each sub-carrier data was converted into a matrix with a mean of 0 and a standard deviation of 1, as shown in the following formula:
Convolution neural network model
Firstly, we evaluated three to six-layer CNN networks and found out that a five-layer CNN effectively minimized computation time while preserving a high accuracy rate. As shown in Table 3, the final best CNN model comprises an input layer, five convolutional layers, a fully connected layer and an output layer.
The CNN model of TCS-fall.
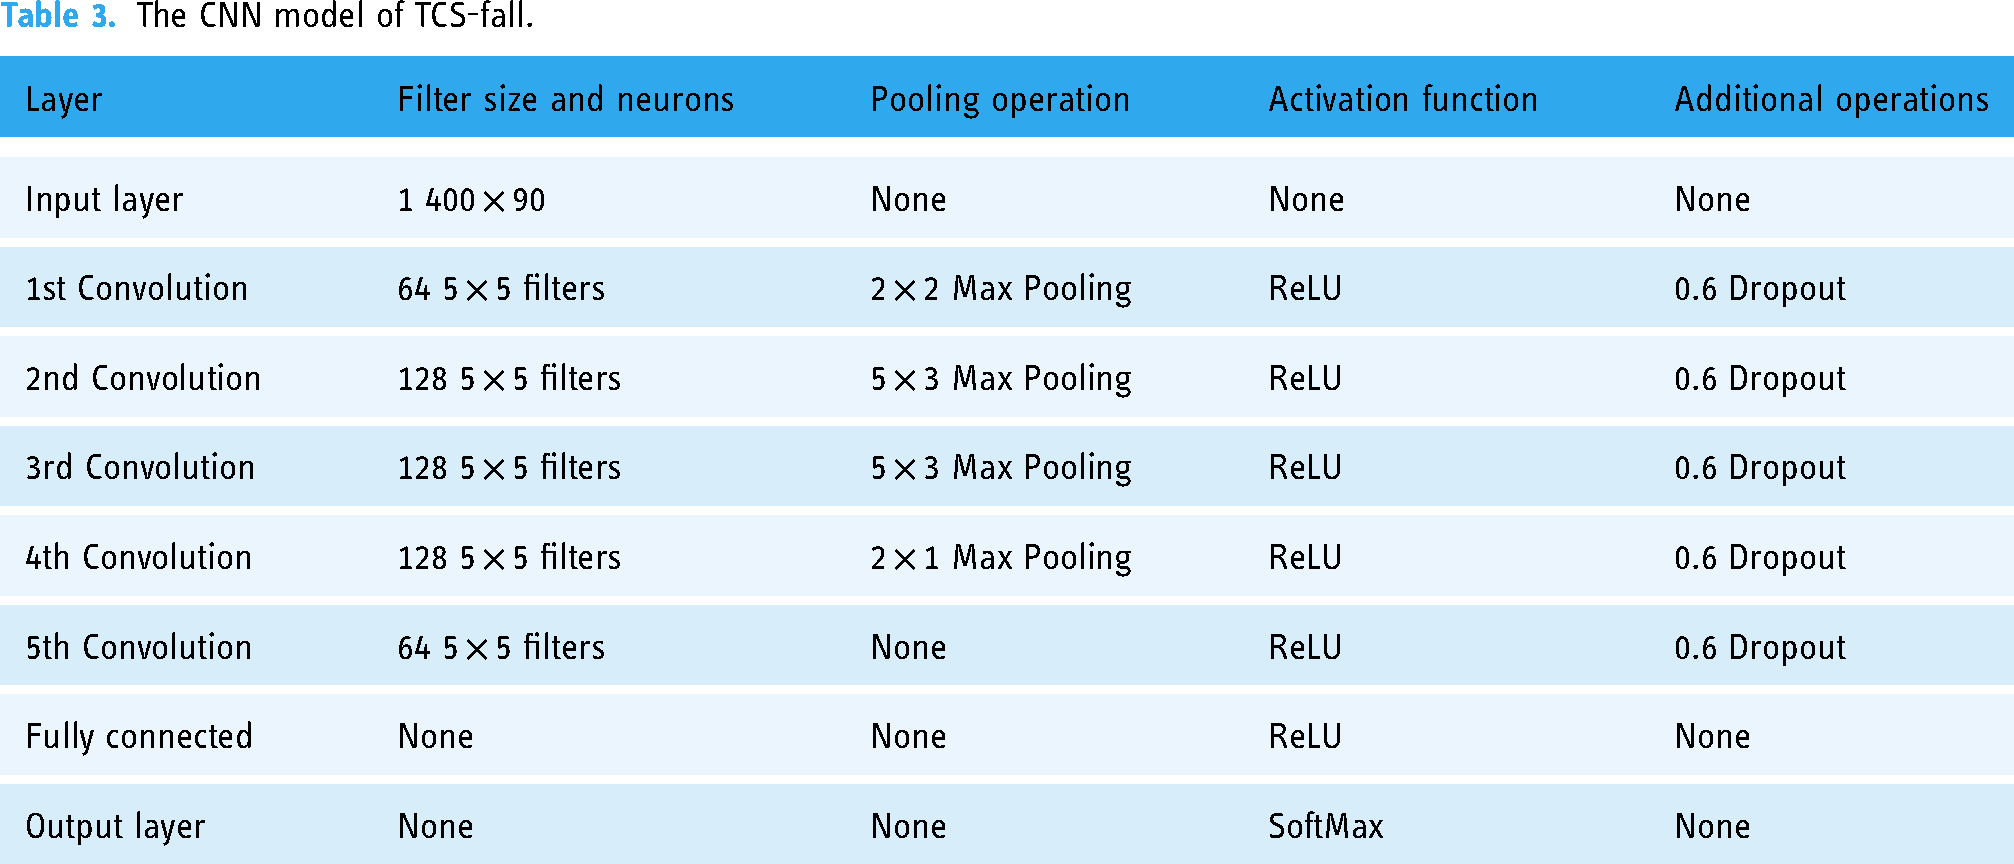
The neural network comprises an input layer that receives a 400 × 90 CSI data matrix. Five convolutional layers follow, each consistently applying a dropout rate of 0.6 after convolution and max-pooling operations to prevent over-fitting. ReLU activation is employed in all convolutional layers, introducing nonlinearity. The first convolutional layer uses 64 filters of size 5 × 5 with 2 × 2 max pooling. Subsequently, the second and third convolutional layers utilize 128 filters of size 5 × 5 with 5 × 3 max pooling. The fourth convolutional layer employs 128 filters of size 5 × 5 with 2 × 1 max pooling. The fifth convolutional layer applies 64 filters of size 5 × 5 without pooling.
The extracted features undergo flattening and are fed into a fully connected layer, which uses ReLU activation. Finally, the output layer, employing SoftMax activation, classifies the features for accurate fall detection. The consistent application of regularization and activation functions in each convolutional layer contributes to robust feature learning and the non-linear transformation of CSI data.
Evaluation metrics
Evaluation on test datasets: The metrics used for the evaluation of the test dataset were area under the curve (AUC) score. AUC is a statistical measure that evaluates the performance of a binary classification model by measuring the area under the receiver operating characteristic (ROC) curve and can easily calculated with the python package “scikit-learn.” 40
Evaluation on TCS dataset: Each sliced item of TCS sample corresponds to an 8-s activity. It is easy to know if each sliced item contains a fall by comparing the fall time for TCS sample. A TCS sample was recorded as error warnings if any sliced item without a fall was erroneously predicted as a fall. In contrast, a TCS sample was recorded as correct warnings if any sliced item with a fall was correctly predicted as a fall. The evaluation metrics used for the TCS dataset are NEWR and CWR. These metrics used to evaluate the time-continuous fall detection effect of the model are calculated as shown in the following formulas:

Tool development (study 3)
Main window of PyQT CsiTool
A program called “PyQT CsiTool” to facilitate CSI data collection and human activity detection was developed here in this work. This program can perform functions such as signal reception, CSI data collection, event marking, and human activity detection.
The program's main window contains four panels: waveform display area, signal panel, collection panel and analysis panel as shown in Figure 7.

PyQT CsiTool.
Waveform display area
The primary function of waveform display area is to display the signal waveform, including the waveform graph of amplitude, the waveform graph of GCV and slider of a cutoff frequency slider.
The original and filtered amplitude are displayed in dark and bright color tones, respectively. To modify the Butterworth low-pass filter's cutoff frequency, users only need to drag the slider. The waveform graph of GCV displays the GCV values relative to the amplitude.
Signal panel
The primary function of the signal panel is to select the signal source. CSI signal extraction from the Intel 5300 network card can only be done in the Ubuntu operation system, while the playback function can be used in both Windows and Ubuntu.
Collection panel
The primary function of the collection panel is to save the CSI signal and event data. The operator only needs to input the name prefix and select the saved file type such as “dat,” “csv,” “npy” and “mat.” Then, the program will automatically increase the file name number after each data collection. To record an event, press [0–9, a-z, A-Z] on the keyboard, then the event and its occurrence time will be recorded in the CSV file with the same name.
Analysis panel
The analysis panel depends on the open neural network exchange (ONNX) 41 file exported from the neural network model. After importing the fall detection model, the panel will continuously transmit the latest amplitude data to the classification model and display the prediction results.
In addition to the fall detection model mentioned in this article, any neural network models such as action recognition, individual recognition, gesture recognition, person counting, etc., can also be loaded as long as they were built using the ONNX framework.
Results
Data collection (study 1)
The dataset encompasses 4200 SA samples, capturing falls and actions closely resembling falls. Additionally, it contains 18,000 s of TCS samples, featuring daily actions with falls inserted.
Performance of model (study 2)
Performance of proposed method
A k-fold cross-validation method was employed to enhance the reliability of the experimental results. The evaluation findings are shown in Table 4. This method demonstrated robustness. The proposed method yielded satisfactory results even with the utilization of CSI data from only two volunteers for training. It is worth highlighting that the model's proficiency increases as the size of the training dataset grows.
Evaluate performance using varying numbers of volunteers for training.

Mode 1: 10-fold cross-validation is used, with data from 2 volunteers used for training and data from the other 18 volunteers used for testing in each validation.
Mode 2: 2-fold cross-validation is used, with data from 10 volunteers used for training and data from the other 10 volunteers used for testing in each validation.
Mode 3: 10-fold cross-validation is used, with data from 18 volunteers used for training and data from the other 2 volunteers used for testing in each validation.
Performance comparison of different filter parameters
In order to obtain the optimal model performance, different filtering methods were tested on the CSI data and the results were compared.
First, models were trained using Butterworth low-pass filter, Hampel filter, Gaussian filter and without filtering. The results showed that only the Butterworth low-pass filter could significantly improve the model performance. Other filtering methods may filter out important fall information and reduce performance (see Table 5).
The influence of different parameters on model performance a .

This performance is from 10-fold cross-validation, where data from 2 volunteers was used for training and data from the other 18 volunteers was used for testing in each validation.
Then, bidirectional Butterworth low-pass filters with different cutoff frequencies were tested. High cutoff frequencies retained more signal components but also more noise, while low cutoff frequencies filtered out more noise but potentially useful signal components as well. As shown in Table 5, using a 100 Hz cutoff achieved the optimal balance—removing noise while retaining useful information for fall detection.
In summary, using the Butterworth low-pass filter with a 100 Hz cutoff frequency to preprocess the CSI data was chosen, in order to obtain the optimal model performance.
Optimization of window-size for GCV
To extract features of CSI amplitude variations, the GCV method is utilized in this study. As shown in Algorithm 1, the window-size w determines the degree of data compression by GCV. Table 5 demonstrates our exploration with different values of w (i.e. 5, 10, 20 and 40). From the results, it is evident that a larger w leads to higher data compression but may discard useful features for detecting falls, reducing the CWR. In contrast, a smaller w retains more features but cannot effectively optimize computational efficiency.
To achieve the best balance between retaining useful features and improving efficiency, we selected w = 20 through optimization. This window-size achieves high NEWR and CWR scores simultaneously. In summary, adjusting the window-size allows balancing between data compression and preserving features critical for fall detection.
Performance comparison with other models
Based on our current knowledge, the majority of existing fall detection methods utilizing WiFi CSI rely on non-cross-individual mixed data for training and testing purposes, without reporting cross-individual fall detection results. Therefore, we compared several recently published works with our proposed TCS-Fall method using this cross-individual dataset. As shown in Table 6, the utilization of GCV features in our proposed method offers a significant advantage in reducing NEWR compared to other methods in fall detection.
Predictive performance across different methods a .

This performance is from 10-fold cross-validation, where data from 2 volunteers was used for training and data from the other 18 volunteers was used for testing in each validation.
Performance of tools (study 3)
Performance of PyQT-CSITool
The PyQT-CSITool program is built on the Python packages “PyQT5” and “Numba.” The analysis of CSI binary data employs the JIT precompile technology of Numba to enhance its speed. All operations that have the potential to block threads, including socket listening, data playback, and action recognition, are executed in sub-threads to prevent the main thread from being obstructed.
Through the optimization of multi-threading and precompile technology, the program can operate seamlessly even on a low-performance machine. For example, on a system equipped with an N2840 CPU, this tool can adeptly parse 1 s of CSI data and detects the fall using neural network prediction within 100 ms. With this sub-second latency, the system can detect falls in real-time.
Performance comparison with other tools
While most classification tasks are completed within a negligible timeframe of 5–20 ms, 33 reading and preprocessing CSI data can take several seconds. This significant disparity highlights the need to optimize data pre-processing for real-time applications.
This study compared the processing times for reading and pre-processing an 8-s CSI data file stored in the “.dat” format. Four methods were evaluated: (a) the Python-based “CSIKit,” 42 (b) the Python-based “CSI reader,” 43 (c) the MATLAB-based method 38 and (d) the proposed method accelerated by Numba. As shown in Figure 8, the proposed method achieved a significant speedup exceeding 20-fold compared to the other approaches.

Speed performance of different method.
Discussion
Evaluation metrics NEWR and CWR
Most existing CSI-based fall detection studies use classification metrics like accuracy, precision, recall or AUC to evaluate model performance.25–35 However, these metrics are suitable for evaluating the classification of independent data samples, but have limitations in assessing continuous fall detection over an extended period.
Specifically, existing metrics cannot effectively evaluate the occurrence of false alarms—when the system erroneously detects falls during daily non-fall activities over a long duration. To address this, we introduced two new evaluation metrics—NEWR and CWR.
NEWR measures the ratio of time windows with no false alarms during normal activities to the total monitoring duration. It indicates how effectively the system can avoid erroneously detecting falls during routine daily activities over time. A higher NEWR means the system has fewer false alarms over time. CWR measures the ratio of time windows that correctly detect falls over the total monitoring duration. A higher CWR ratio means more falls are correctly detected in a timely manner.
Both NEWR and CWR are essential to evaluate real-life performance—the system needs to detect actual falls accurately while avoiding false alarms during normal activities. The extensive experiments in this study demonstrate that the proposed TCS-Fall method can achieve high NEWR and CWR simultaneously, highlighting its ability for continuous cross-individual fall detection.
In this work, if the model was trained using data from only two volunteers, the NEWR was 0.955. This means that given one TCS sample as 150 s long, the probability of no false alarms in this duration is 0.955. Therefore, if a user performed different activities continuously for 1 h (3600 s), the probability of producing a false alarm would be 3600/150 * 0.045 = 1.08, indicating a high likelihood of approximately 1 false alarm occurrence.
However, when the model was trained using data from 10 volunteers, the NEWR value reached 1. This indicates that the probability of generating false alarms during long periods of continuous motion approaches 0. In such a scenario, no false alarms would be produced throughout an entire day. Therefore, the model trained by 10 volunteers is recommended for the real world applications.
MATLAB or Python&Numba
MATLAB is a common tool used to analyze CSI data because there are many signal processing toolkits available in this software.21,39 However, it is difficult to perform due to many unwanted functions. It is also difficult to commercialize because of its charging mechanism. These limitations have led some researchers to analyze CSI data using Python, a free, lightweight platform.29,42
Python's appeal in data science stems from its efficient, dynamic programming paradigm. However, this very flexibility presents a double-edged sword. While the untyped, high-level syntax simplifies development, it can lead to performance bottlenecks in data- and computation-intensive programs. Compiled code offers significant speed advantages in such scenarios, often running orders of magnitude faster than dynamically interpreted code. 44
Numba, 45 a JIT compiler, addresses Python's performance limitations by translating Python functions into optimized machine code. By leveraging type information of input parameters, the Numba compiler utilizes the LLVM library to generate efficient machine code, achieving performance comparable to compiled languages like C or Fortran. 46
By capitalizing on Python's flexibility and Numba's ability to compile code for faster execution, this study achieved a 20-fold performance improvement compared to conventional methods. This finding suggests that the Python-Numba combination offers a compelling alternative to MATLAB, particularly for researchers seeking an open-source, high-performance solution for CSI data analysis.
Limitations
While this paper presents an interesting WiFi-based fall detection system using CSI, there are some limitations that should be considered.
First, the experiments were conducted in a controlled lab environment with volunteers performing scripted actions. Real-world environments can be much more complex and unpredictable.
Second, the demographics of the volunteers were quite homogeneous—mostly young students in their 20 s. Testing in a more diverse population, including the elderly, will be crucial. However, due to the high-risk nature of falls, collecting fall data from elderly individuals is nearly impossible.
Third, the system's hardware limitations necessitate the installation of a dedicated WiFi transmitter and receiver within the home, potentially restricting widespread adoption. In the future, there is a need to develop devices that can seamlessly integrate with existing home WiFi networks to enhance feasibility.
Overall, this research presents promising technical development but further real-world testing across more diverse situations is needed to evaluate limitations and practical viability.
Conclusions
In this study, we proposed TCS-Fall, a novel deep learning method for real-time cross-individual fall detection using WiFi CSI. This method utilizes GCV of CSI amplitudes as input features to effectively capture fluctuations caused by falls. The GCV features are fed into a Convolutional Neural Network classifier optimized through extensive architecture exploration.
The proposed method was evaluated on an extensive dataset collected from 20 volunteers performing falls as well as daily activities. The results demonstrated that TCS-Fall can achieve exceptional cross-individual performance, with AUC reaching 0.999, NEWR score reaching 0.955 and CWR score reaching 0.975 when trained on just 2 volunteers. The accuracy improved further as more training data was utilized.
Additionally, this study developed a user-friendly tool for CSI data collection and analysis using PyQT and optimized the performance using Numba. The optimized data parsing/preprocessing achieved over 20x speedup compared to previous methods. The tool could parse and detect falls within 100 ms, enabling real-time performance.
In conclusion, this study makes significant contributions in addressing the challenge of cross-individual fall detection using WiFi CSI. The proposed TCS-Fall method enables highly accurate real-time detection. Additionally, the optimized data processing and user-friendly tool facilitate practical deployment. This work advances the field and brings us closer to WiFi-based fall monitoring systems that can provide timely assistance to the elderly.
Footnotes
Acknowledgments
We wish to thank Xu Yang and Yuqing Yin in China University of Mining and Technology for their helpful advices. We appreciate ChatGPT's contribution to polish the language of manuscript. It is important to clarify that its role was solely focused on linguistic refinement, without involvement in any content generation, literature creation or knowledge point formulation.
Contributorship
Ziyu Zhou was responsible for the experimental design, programming, data collection, model development and program deployment. Xiao Zhang and Shuyan Li provided guidance and supervision. The other authors assisted with data collection for the experiments.
Data Availability
The data sets generated during or analyzed during this study are available from the corresponding author on reasonable request.
Declaration of Conflicting Interests
The authors declared no potential conflicts of interest with respect to the research, authorship, and/or publication of this article.
Ethical approval
The data collection was approved by the Medical Ethics Committee of the Affiliated Hospital of Xuzhou Medical University (Document No.: AF-35/06.1, Opinion No.: XYFY2021-KL269-01).
Funding
The authors disclosed receipt of the following financial support for the research, authorship, and/or publication of this article: This work was supported by the national key research and development program of China (2020YFC2006600) and the Unveiling & Leading Project of XZHMU (JBGS202204).
Guarantor
SL