
Abstract
Objective
To optimize workplace health promotion, a simple method for quantifying allostatic load response is needed. This study examines the feasibility of optimizing objective anxiety and presenteeism monitoring using daily smartwatch-measured ultra-short heart rate variability (HRV).
Methods
Office workers without diagnosed disease prospectively performed 30 s HRV self-measurement each morning for two months and responded to the State-Trait Anxiety Inventory (STAI) and Work Limitation Questionnaire (WLQ). Logistic regression analysis examined daily HRV parameters in the high-trait anxiety group (HTA, STAI ≥ 40) using mean and variance HRV, age, self-reported gender, and body mass index (BMI). The ideal cutoff value enabled comparison of WLQ using the Mann–Whitney U test. Heart rate variability data were collected for 279 participants (male ratio, 83.9%; age, 42 ± 10 years) who completed questionnaires and monitored HRV for 30+ days.
Results
Compared to the low-trait anxiety group, HTA exhibited higher variance of the log-transformed coefficient of component variance of high-frequency component (LnccvHF) and low-frequency per HF (Lnccv L/H), in addition to differences in the means of these HRV parameters. In addition to BMI (odds ratio [OR] = 0.92, p = 0.02) and mean LnccvL/H (OR = 10.75, p < 0.01), the variance of Lnccv L/H was an independent predictor of HTA (OR = 2.39E + 8, p = 0.011). The daily Lnccv L/H dispersion group had a lower WLQ productivity loss score (p = 0.02, r = 0.17).
Conclusions
By focusing on HRV dispersion status, this simple and instantly applicable daily HRV monitoring system enables optimized quantitative monitoring of anxiety and productivity.
Introduction
Psychological distress, prevalent in modern society, can impair work performance and lead to major global health problems.1–4 When implementing health promotion activities in the workplace to reduce healthcare costs and increase work productivity, it is important to quantitatively visualize the response to allostatic loads. Nevertheless, self-reporting—the gold standard for these evaluations—has several limitations, including subjectivity, 5 potential recall, reporting bias, and the influence of social conditions.
One promising quantitatively visualized index is heart rate variability (HRV). A meta-analysis reported reduced HRV in older adults with depression 6 and patients with anxiety disorders. 7 Occupational stress is also associated with lowered HRV based on the reduced root mean square successive difference (RMSSD) and high-frequency component (HF). 8 Despite its usefulness, these findings were obtained through a > 10 min-long assessment using a traditional electrocardiograph, which hinders daily HRV monitoring. To overcome this limitation, the capability of ultra-short-term (within 60 s) HRV analysis has been investigated to detect physical and psychological conditions.9–12 However, this method has proven insufficient for frequency component analysis in ultra-short-term HRV analysis using a smartwatch. That is, ultra-short-term HRV obtained via a smartwatch with a lower sampling rate may specifically affect variables based on short-term variability. 13 Accordingly, we developed a novel technology to enable the automated visualization of HRV values, including frequency components, in real time. This technology calculates the RR interval using the maximum entropy method based on electrocardiograms (ECGs) acquired at high frequencies (1000 Hz). This real-time evaluation method has been successfully applied to cardiac rehabilitation.14,15 This technological advantage enables the accurate measurement of HRV values based on ultra-short-term analysis (30 s) and can be applied to simpler day-to-day monitoring of responses to allostatic loads.
Recently, Internet of Things (IoT) devices and technologies have become widespread, 16 enabling the convenient self-acquisition of beneficial information using a smartwatch. 17 Compared to conventional ECG, smartwatches are expected to serve as simpler home monitoring devices of allostatic load using HRV analysis based on single-lead ECG, 17 the verification of which is underway. 18 Additionally, smartwatches can be applied to our real-time HRV analysis system to accurately assess RR intervals, that is, the beat-to-beat fluctuation in the HR. Such methods that facilitate simple measurement and real-time analysis can forestall physical and mental diseases. This has the potential to create a healthier society by facilitating early behavioral modification based on quantitative visualization of the daily response to allostatic load. However, there is limited evidence regarding the practical application of such methods. Moreover, to the best of our knowledge, no previous study has directly elucidated the association between HRV and work performance.
The present study investigates whether daily ultra-short HRV measurements using a novel smartwatch-based methodology can enable quantitative visualization of anxiety as an important index in the workplace.
Methods
Participants
This prospective study recruited healthy office workers from a single Japanese company from March to May 2022. The inclusion criteria were an age of 20–65 years, and the exclusion criteria were current severe neurological, cardiovascular, or psychological diseases. Finally, 395 participants were included in this study. All applicable institutional and governmental regulations concerning the ethical use of human volunteers were followed. The study protocol was conducted in compliance with the ethical guidelines for medical and health research involving human subjects and was approved by the Ethics Committees of Keio University School of Medicine (Approval No. 20200194). Oral informed consent for participation and publication of findings was obtained from the study participants before enrollment.
Procedure
Upon enrollment, smartwatches were individually provided to all participants. Instructions were then provided to each participant to enable the accurate assessment of their ECG. All participants performed daily resting short-term ECG (30 s) in the morning for 60 days. The measured ECG data were collected using analysis software (Croswell, Yokohama, Japan), which was used to immediately calculate several HRV parameters. Three weeks after the commencement of data accruing, stress sensitivity was measured based on trait anxiety scores using the State-Trait Anxiety Inventory (STAI). Work performance was assessed using the Work Limitation Questionnaire (WLQ). The CONSORT diagram in Figure 1 presents the study flow.

CONSORT diagram. Flowchart of the study according to the CONSORT guidelines. CONSORT: Consolidated Standards of Reporting Trials; HRV: heart rate variability; STAI: State-Trait Anxiety Inventory; WLQ: Work Limitation Questionnaire.
Outcomes
Heart rate variability
All participants were requested to perform a 30 s ECG using a smartwatch once daily between waking up and breakfast. The measurement window was selected based on a previous study. 9 A smartwatch (Apple Watch model A2473, Apple Inc., Cupertino, CA, USA) was tightly placed on the participant's preferred wrist, and the measurement was unified within the study period. The participants were also requested to abstain from movement (walking and standing), caffeine intake, or smoking prior to measurement. Each measurement was completed in a sitting position in the absence of visual or auditory stimuli (e.g., TV, music, computer, or smartphone). Each raw ECG with a sampling rate of 512 Hz was submitted as an image file to the analysis software (Croswell, Yokohama, Japan) via smartphone. The software automatically measured and recorded RR intervals through image processing with upsampling to 1000 Hz using the spline interpolation method. Subsequently, it instantaneously performed power spectral analysis using the maximum entropy method to calculate frequency components: HF (0.15–0.4 Hz), low-frequency component (LF; 0.04–0.15 Hz), and LF-to-HF power ratio (L/H). The magnitude of each component was presented as the power and coefficient of component variance (ccv, square root of power/mean RR interval) in accordance with a previous report. 19 Additionally, the coefficient of variation for the RR intervals, standard deviation of the normal-to-normal interval, and RMSSD was calculated as a time-domain index to evaluate indices of autonomic nerve activity. 19 Furthermore, the sample entropy value (SampEn) was calculated to indicate the regularity. Preliminary validation was performed by measuring HRV using a smartwatch in 10 additional healthy persons; the results demonstrated a high correlation coefficient between RR intervals obtained using the smartwatch and a medically certified HR monitoring device (LRR-03, GMS Co. Ltd, Tokyo, Japan), as shown in Supplementary Figure 1 (r = 1.000, p < 0.01).
Questionnaire
Anxiety propensity
Trait anxiety (TA) subscales of the STAI were used to assess the TA levels. This instrument was a 20-item self-report scale to measure the general propensity to experience different states of anxiety in response to perceived threats. 20 The TA score ranges from 20 to 80, with higher scores indicating greater TA levels. 20 For broad detection of people with these propensities, participants with a score < 40 were classified into the low TA group (LTA), and those with a score ≥ 40 were classified into the high TA group (HTA), according to a previous report. 21
Presenteeism
Presenteeism was evaluated after participating in daily HRV monitoring. The Japanese version of WLQ (WLQ-J) was used to measure the rate of deterioration in work performance and work productivity. 22 Work Limitation Questionnaire is a self-administered questionnaire comprising 25 items under the following subscales: time management, physical tasks, mental interpersonal tasks, and output tasks. 22 These four subscale scores range from 0 (not limited) to 100 (always linked), with a high score denoting a scenario where work performance was highly limited and presenteeism was high. Based on the four subscales, with each weight determined by the developer, the WLQ at-work productivity loss score was calculated as the ratio of at-work productivity loss relative to a healthy benchmark sample. Contrary to the interpretation of the subscale, a high WLQ at-work productivity loss score was interpreted as low productivity loss and low presenteeism.
Statistical analysis
Parametric data were expressed as mean ± standard deviation, and nonparametric data were expressed as median (interquartile range). Among all collected daily HRV data, noncanonical data were excluded based on time criteria. Subsequently, participants with remaining canonical daily HRV data for less than 30 days (half of the study period) were excluded. Residual-eligible participants were included in the final analysis. To clarify the dispersion of HRV parameters within the study period, individual mean and variance per participant were calculated based on daily HRV parameters for which log transformation was performed. All differences between groups were statistically assessed for significance using the Mann–Whitney U test due to the non-normality of the distribution. Based on the effect size, we calculated r using the z-score. 23 Additionally, the ratio was compared using the chi-squared test. Multiple logistic regression analysis was conducted to calculate the adjusted odds ratio (OR) with a 95% confidence interval (95% CI) and construct the prediction model for higher TA persons using candidate independent factors among the calculated individual HRV parameters and participant characteristics. The predictive performance of the obtained model was assessed using receiver operating characteristic (ROC) analysis. The WLQ score was compared in the high model score group (< cutoff score) and low model score group (> cutoff score), which was divided based on the cutoff value calculated via ROC analysis. All probability values were two-tailed, with p-values < 0.05 considered statistically significant. All statistical analyses were performed using SPSS version 27.0 (SPSS Inc., Chicago, IL, USA).
Results
Data processing
Of the 395 enrolled participants, 366 provided complete responses to the STAI and underwent daily HRV monitoring for 60 days. Among the collected 18,036 data points, 3409 were excluded based on time criteria. Moreover, 93 participants were excluded as they did not achieve daily HRV data collection for more than half of the study period (>30 days). Consequently, the remaining 279 participants and 14,079 HRV data points were included in the final analysis (Figure 1). The mean number of daily HRV data points collected was 53 ± 17. The baseline characteristics of eligible participants are summarized in Table 1. The study included 234 men and 45 women (based on self-reports) with a mean age of 42 ± 10 years, height of 172 ± 8 cm, body weight of 70 ± 14 kg, and body mass index (BMI) of 23 ± 4. A mean TA score of 45 ± 9 years was obtained with 95 individuals assigned to the LTA group and 184 to the HTA group (34 ± 4 vs. 50 ± 7, p < 0.01). Body weight and BMI were significantly higher in the LTA group than in the HTA group (p = 0.02, r = 0.14 and p = 0.01, r = 0.15, respectively).
Baseline characteristics of participants in low group and high group.

LTA: Low trait anxiety group with score < 40.
HTA: High trait anxiety group with score ≧40.
Bold number indicates statistical significance.
Comparison of HRV parameters
Figure 2 compares the average, variance, and SampEn of HRV parameters between the LTA and HTA groups. Among the averaged variables, only log-transformed L/H (LnL/H; p = 0.043, r = 0.12) and LnccvL/H (p = 0.034, r = 0.13) in the HTA group were significantly higher than those in the LTA group. Plotting all daily HRV parameters within the study period revealed that the data points for the HTA group were spaced further apart, resulting in a diffuse plot, whereas the LTA group data created a condensed plot. Each representative plot is shown in Figure 3. The statistical comparison between HTA and LTA groups demonstrated significant differences of variance in LnHF (0.15 (0.07) vs. 0.13 (0.07), p = 0.011, r = 0.15), LnLF (0.19 (0.07) vs. 0.17 (0.07), p = 0.035, r = 0.13), LnL/H (0.22 (0.07) vs. 0.19 (0.08), p = 0.022, r = 0.14), LnccvHF (0.03 (0.01) vs. 0.03 (0.02), p = 0.013, r = 0.15), and LnccvL/H (−0.75 (0.21) vs. −0.78 (0.21), p < 0.01, r = 0.16), as shown in Figure 2. Among the SampEn variables, RMSSD was significantly lower in the HTA group (p = 0.04, r = 0.15), indicating high regularity, whereas the CVRR was higher in the HTA (p = 0.04, r = 0.13), indicating low regularity.
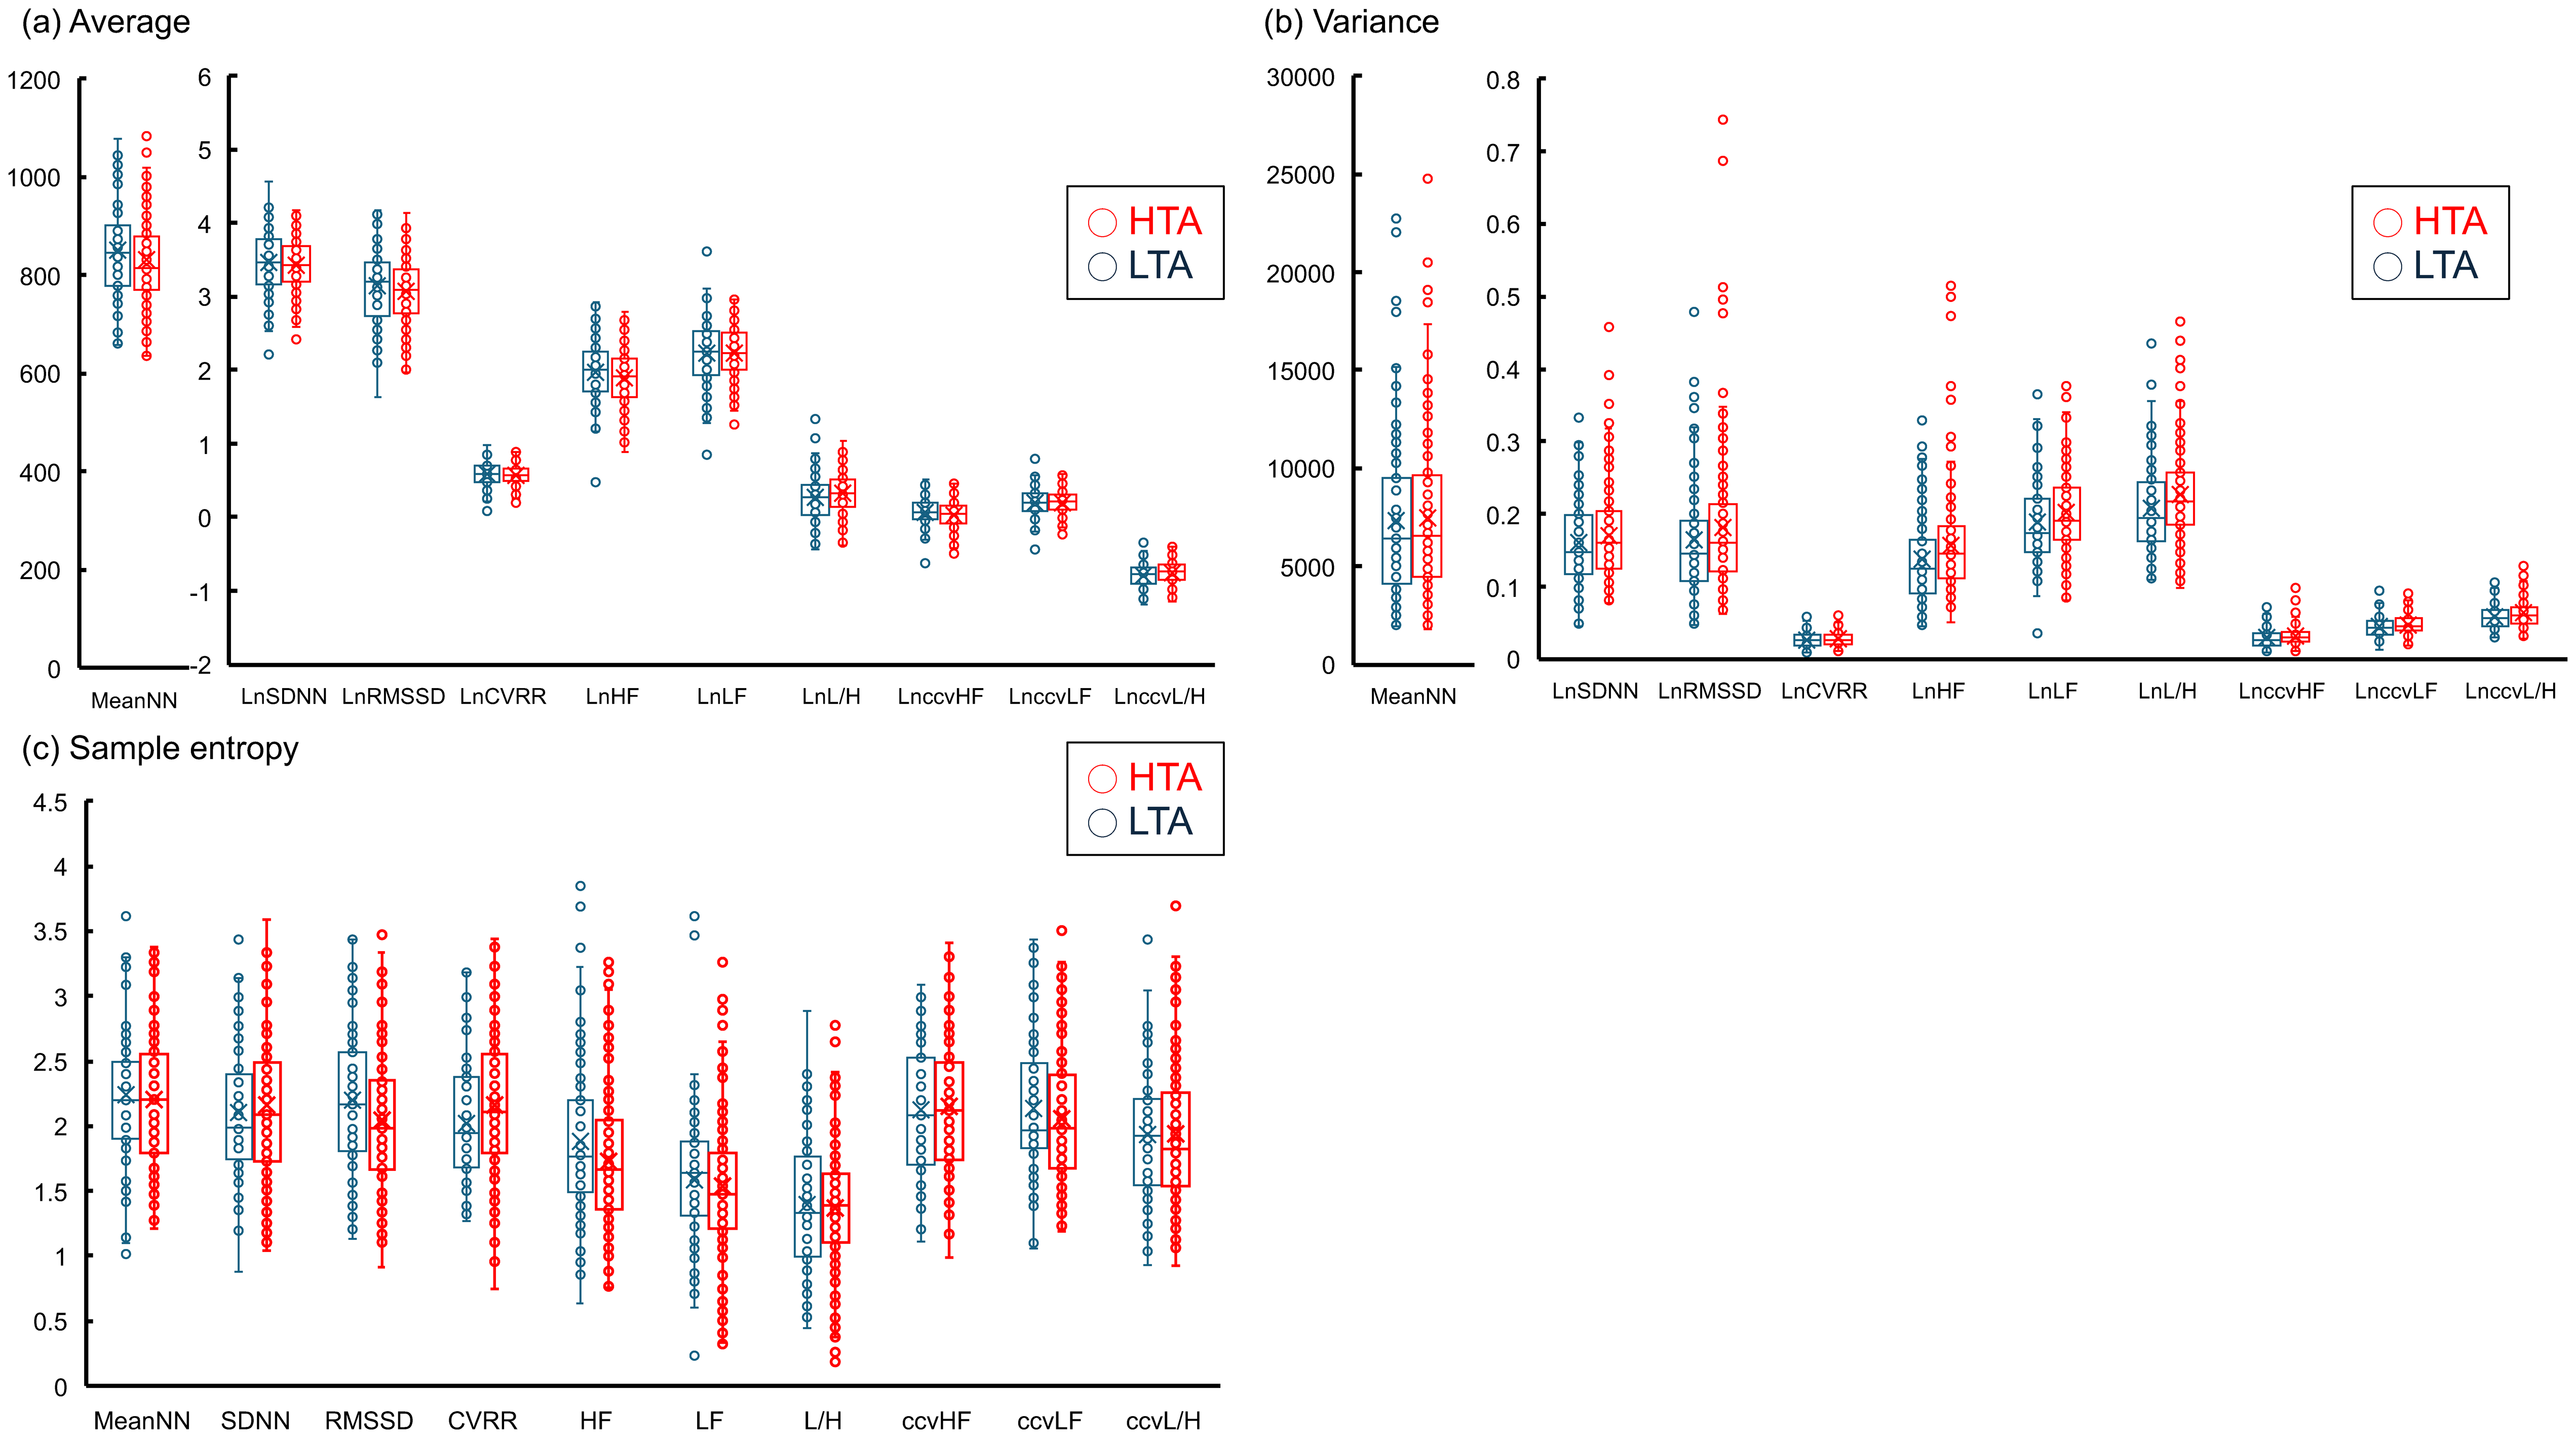
Comparison of all variables based on daily monitoring of HRV. Comparison of (a) average, (b) variance, and (c) sample entropy of daily HRV variables between the low-trait anxiety (LTA) and high-trait anxiety (HTA) groups.* p < 0.05; n.s: not significant. HRV: heart rate variability; MeanNN: mean of the normal-to-normal interval; LnSDNN: log-transformed standard deviation of the normal-to-normal interval; LnRMSSD: log-transformed root mean square successive difference; LnHF: log-transformed high-frequency component; LnLF: log-transformed low-frequency component; LnL/H: log-transformed low-frequency component to high-frequency component power ratio; LnccvHF: log-transformed coefficient of component variance of the high-frequency component; LnccvLF: log-transformed coefficient of component variance of the low-frequency component; LnccvL/H: log-transformed coefficient of component variance of the low-frequency component to high-frequency component power ratio; LnCVRR: log-transformed coefficient of variation of R-R interval; RMSSD: root mean square successive difference.

Representative HRV data obtained by daily measurement using a smartwatch. These graphs depict the overall plot for each of the two representative participants based on daily LnHF and LnccvL/H during the study period. (a) The person with high-trait anxiety (68 points) presented high dispersion of LnccvL/H and LnHF, whereas (b) the person with low-trait anxiety (29 points) presented low dispersion of these HRV outcomes. Each ellipse depicts the approximate ellipse with the dispersion of the daily measured HRV result during the measurement period by defining the long and short axis using the maximum and minimum values of LnccvL/H and LnHF, respectively, and tilting based on the angle of inclination of the approximate line. LnHF: log-transformed high-frequency component; LnccvL/H: log-transformed coefficient of component variance of the low-frequency component to high-frequency component power ratio.
Factors associated with a HTA score
Among the mean, variance, and SampEn of HRV parameters and participant characteristics with significant differences between the HTA and LTA groups, excluding weight due to collinearity, multiple logistic regression analyses with the forward selection method (likelihood ratio) revealed that LnccvL/H variance was greatly associated with higher TA (OR = 2.39E + 8, 95% CI: 79.62–7.18E + 14, p = 0.011; Table 2). Additionally, mean LnccvL/H (OR = 10.75, 95% CI: 1.95–59.25, p = 0.006) and BMI (OR = 0.92, 95% CI: 0.85–0.99, p = 0.021) were associated factors (Table 2). Moreover, ROC curve analysis revealed an area under the ROC curve of 0.644 (p < 0.01, 95% CI: 0.573–0.716, Supplementary Figure 2) with the optimal cutoff values of the model score using the above factors as 0.493 (sensitivity, 76.6%; specificity, 52.6%, respectively).
Multiple logistic regression analysis of factors affecting higher trait anxiety.

Model score = −0.088 × BMI + 2.375 × mean LnccvL/H + 19.292 × variance LnccvL/H + 3.416.
SD: standard errors; CI: confidence interval; BMI: body mass index; HRV: heart rate variability; L/H: low frequency component per high frequency component.
Bold number indicates statistical significance.
Work performance
Applying the abovementioned cutoff value for the model score, the 196 participants for whom WLQ was acquired were separated into the high (n = 128) (>0.493, mean score: 1.06 ± 0.45) and low (n = 68) (≤0.443, mean score: 0.15 ± 0.29) model score groups. Significant differences were observed in the mental interpersonal (22 (19) vs. 17 (21), p = 0.02, r = 0.17), work output (25 (20) vs. 15 (25)), p < 0.01, r = 0.19), and WLQ at-work productivity (0.94 (0.05) vs. 0.95 (0.06), p = 0.02, r = 0.17) scores between the groups (Figure 4). These differences suggested that the high model score group, comprising high mean and variance LnccvL/H values and low BMI, had low work performance and high presenteeism.

Comparison of presenteeism based on a predicted model score for trait anxiety. * p < 0.05; ** p < 0.01; n.s: not significant. Comparison of four subscales and the WLQ at-work productivity loss score based on WLQ. WLQ: Work Limitation Questionnaire.
Discussion
The present study investigated the feasibility of achieving quantitative visualization of anxiety and presenteeism using daily ultra-short HRV collected via a novel smartwatch-based methodology. The most notable finding was that the inter-day variance of HRV parameters was significantly high in patients with high anxiety sensitivity (Figure 5). The variance in ccvL/H was strongly associated with high anxiety sensitivity. Additionally, a high variance in ccvL/H was associated with high presenteeism. These findings suggest that day-to-day ultra-short HRV represents an applicable potential marker that responds to allostatic load or other effectors. The application of our novel methodology for long-term monitoring is expected to provide individual reference values in accordance with dispersion characteristics. This will enable the development of novel algorithms assessing instant anxiety or presenteeism to enhance health and work productivity.

Scheme of daily short ECG monitoring using a smartwatch to predict work performance. Focusing on the dispersion status in HRV, this easy and instantly applicable daily HRV monitoring system using a smartwatch enables optimized quantitative monitoring of anxiety and productivity. ECG: electrocardiography; HF: high-frequency component; L/H: low-frequency component to high-frequency component power ratio.
Beneficial daily monitoring of ultra-short HRV
The recent development of IoT devices and technologies enables the acquisition of vital data with minimal invasiveness and high accuracy. This advancement yields easy access to monitoring day-to-day vital data 24 and enables the elucidation of specific indices under disease or predisease conditions by detecting critical data transition and variation. In our study, this progression induced a desirable contribution of collected day-to-day vital data, even at home, for healthcare via early behavior modification, which may provide a paradigm shift in forestalling strategies. In practice, numerous novel applications for diabetes monitoring and management have been reported. 25 Originally, various psychologists strenuously attempted to clarify the instant response to allostatic load by repeatedly collecting data, called the “ecological momentary assessment (EMA)” approach. These challenges have accelerated due to technological advancements in wearable devices, which have led to several meaningful findings.26–28 Nevertheless, controversial results have led to ongoing disagreements regarding the optimal biomarker(s) 26 and noncompletion of the practical application of allostatic load prediction systems. One possible reason for this controversy is that the existence of many modifiers affecting HRV values 29 may imply the need for a larger sample size (participants and measurement period) to more accurately determine the biomarker response to allostatic load. Additionally, retrospective analysis methods may impede its practical application. Conversely, compared with a previous systematic review, 26 in which HRV data for 219 individuals over five days were analyzed, our investigation prospectively achieved immediate and simple collection and analysis of vast data aimed at a wider range of people for a longer duration. Finally, the individual trend of frequency components in HRV highlighted its potential as an objective index of anxiety sensitivity and presenteeism.
Influence of allostatic load on daily HRV
The present study achieved the visualization of TA through the analysis of fluctuated HRV day-to-day. As HRV parameters exhibit high interindividual variation, 30 it is difficult to apply a uniform common reference interval (RI) for HRV. Thus, a within-individual RI for HRV must be determined. Heart rate variability placement within that range may indicate a mentally stable state, whereas deviation from this RI indicates a response to allostatic load. Hence, the HRV of participants with LTA, or high allostatic load resistance, is only slightly affected by daily allostatic load, and their HRV is less scattered and falls within-person RI. Conversely, participants with HTA, which stands for low allostatic load resistance, are strongly affected by this; their HRV varies greatly and deviates from the intraindividual RI. The scatter plots based on HRV revealed a difference in variance between groups with high and LTA, allowing us to visualize responsiveness to allostatic load with high sophistication without establishing within-individual RI. Years of research have identified that single-measured variables of HRV were associated with anxiety. 7 In contrast, different findings have been reported regarding the association between HRV and TA.31–33 In the present study, while averaged variables of HRV differed significantly based on TA score, a variance of HRV was a more crucial explanatory variable for the detection of HTA. This novel finding could be supported by de Vries's report that increasing fluctuation of LnRMSSD was associated with increasing stress over time. 34 In contrast, the visualization of daily status requires a daily judgment as to whether the HRV obtained that day is within or outside the prior setting within-individual RI. Therefore, additional effort is needed to individually optimize the applicable within-individual RI.
Detection of harmful anxiety sensitivity and presenteeism
High anxiety sensitivity impairs task performance, including visual working memory 35 and cognitive flexibility, 36 and can lead to mental disorders 37 or Alzheimer's disease.38,39 Trait anxiety has mutability influenced by behavior modification or healthcare.40,41 Additionally, self-prehension with the identification of anxiety-sensitive hallmarks can help avoid allostatic loads, highlighting the need for a simple and quantitative evaluation method of TA for repeated usage. Although brain imaging has been reported as a candidate, it is not readily accessible, requires expensive equipment, has a long analysis time, and is not feasible for multiperson applications. Several studies using the EMA approach have clarified that the HRV parameter has a moderating role in the stressor–strain process.28,42 Additionally, the trend of fluctuating HRV or HR is related to stress.27,34 The present study specifically identified factors strongly related to anxiety sensitivity by analyzing trends in HRV based on a large amount of daily data collected using our novel method. As HRV was found to be associated with high presenteeism, daily HRV monitoring for 30 s can provide a visual representation of the effectiveness of strategies to promote enhanced health and work productivity among offices or communities. Additionally, this system is expected to contribute to the extraction of desirable promotional activities through the subjective evaluation of TA.
Limitations
Our results should be interpreted based on the following limitations. First, the heterogeneity of age and gender among the current participants might influence the findings from the collected HRV. Furthermore, some of the participants may have had undiagnosed diseases. Additionally, we did not collect variables related to the daily lives of the participants, including sleep, diet, or exercise, which might affect health status. However, this type of bias was expected to be minimal as the prediction model primarily adopted within-person dispersion of HRV, not independent variable values. Second, adherence to the prescribed measurement environment and method at home was dependent on the individual. Third, participants performed HRV measurements at a predefined time from waking to breakfast, although other recommendations with more rigorous measurement time, which might invite contamination of several biases, have been reported. 28 However, it is important to note that our lenient measuring protocol was more feasible and practical for the simultaneous evaluation of vast samples (e.g., company, school, or city) and achieved meaningful findings. Finally, the ultra-short-term HRV, collected once daily, based on the R-to-R interval of the ECG was analyzed to detect anxiety characteristics. Combined with HRVs under different situations, such as during work or under stressors, a more accurate algorithm to detect allostatic load could be developed. In addition, a system employing 24-h continuous photoplethysmography monitoring and automated analysis of pulse-to-pulse interval could be advantageous. This multimedia strategy is expected to continually improve with optimization and further development.
Conclusions
This prospective study demonstrates that interday variance of ccvL/H is strongly associated with high anxiety sensitivity and presenteeism. This finding could pave the way for novel methods to enhance health and work productivity.
Supplemental Material
sj-docx-1-dhj-10.1177_20552076241239240 - Supplemental material for Visually assessing work performance using a smartwatch via day-to-day fluctuations in heart rate variability
Supplemental material, sj-docx-1-dhj-10.1177_20552076241239240 for Visually assessing work performance using a smartwatch via day-to-day fluctuations in heart rate variability by Hiroki Okawara, Yasuyuki Shiraishi, Kazuki Sato, Masaya Nakamura and Yoshinori Katsumata in DIGITAL HEALTH
Footnotes
Acknowledgments
Contributorship
All authors contributed to the study concept and design. Data collection and analysis were performed by HO and YK. HO wrote the first draft of the manuscript. The manuscript was edited and revised by YK, YS, KS, and MN. All authors read and approved the final manuscript.
Declaration of conflicting interests
The authors declared the following potential conflicts of interest with respect to the research, authorship, and/or publication of this article: This study was conducted in collaboration with NISSIN FOODS HOLDINGS CO., LTD. However, this corporation was not involved in data analysis and manuscript writing.
Ethical approval
The study protocol was conducted in compliance with the ethical guidelines for medical and health research involving human subjects and was approved by the Ethics Committees of Keio University School of Medicine (Approval No. 20200194). Oral informed consent for participation and publication of findings was obtained from the study participants before enrollment.
Funding
The authors disclosed receipt of the following financial support for the research, authorship, and/or publication of this article: This work was supported by JST [grant number JPMJPF2101], JSPS KAKENHI [grant number 22K11477], and NISSIN FOODS HOLDINGS CO., LTD.
Guarantor
YK
Supplemental material
Supplemental material for this article is available online.
References
Supplementary Material
Please find the following supplemental material available below.
For Open Access articles published under a Creative Commons License, all supplemental material carries the same license as the article it is associated with.
For non-Open Access articles published, all supplemental material carries a non-exclusive license, and permission requests for re-use of supplemental material or any part of supplemental material shall be sent directly to the copyright owner as specified in the copyright notice associated with the article.