
Abstract
Objectives
Sarcopenia and frailty have been associated with an increased risk of suffering health-related adverse events but the combination of both conditions results in worse health-related outcomes than either condition alone. Since both syndromes are reversible states, their early detection is fundamental. This study aims to validate a video analysis-based App to detect the presence of frailty or prefrailty plus sarcopenia syndromes and to analyze its construct validity with health-related risk factors.
Methods
A total of 686 community-dwelling older adults (median-age: 72, 59% female) were enrolled. Muscle power generated during a sit-to-stand test using the App and calf circumference were considered the index test. The reference standards were the EWGSOP2 criteria (five-chair stand test plus appendicular skeletal mass or skeletal muscle index) and Fried's frailty phenotype. Area under the curve (AUC), sensitivity, specificity, positive and negative predictive values (PPV and NPV) were calculated.
Results
The prevalence of both syndromes varied from 2.9% to 7.2% depending on the diagnostic criteria used for sarcopenia assessment. Excellent-to-outstanding AUC values were observed (range 0.80–0.92). Sensitivity and specificity ranged from 75% to 100% and 81.7% to 87.2%, respectively. PPV and NPV ranged from 12.1% to 37.5% and 97.9% to 100%, respectively. Individuals diagnosed by the App showed an increased risk of polypharmacy, depression, comorbidities, falls, hospitalization, low socioeconomical and educational levels, and smoking and poor self-perceived health compared to their healthy counterparts.
Conclusions
This App seems to be reliable to detect the simultaneous presence of both syndromes in community-dwelling older adults. Individuals diagnosed by the App showed more odds to have health-related risk factors.
Keywords
Introduction
Sarcopenia and frailty represent two of the main concerns related to the biological ageing process, given their intimate relationship with adverse health-related outcomes. Concretely, sarcopenia is a formally recognized disease (ICD-10-CM Diagnosis Code) defined as the generalized and progressive loss of strength, skeletal muscle mass, and/or physical function. 1 Sarcopenia increases the risk of suffering physical disabilities, depression, polypharmacy, falls, hospitalization, and mortality. 1 On the other hand, frailty is defined as a biological state characterized by reduced muscle strength, endurance, and physiological function that increases vulnerability to stressor events. 2 Similarly, the presence of frailty has been related to an increased risk of falls, fractures, disability, hospitalization, and premature death. 3
Nowadays, there is no gold standard for the detection of frailty and sarcopenia syndromes leading to differences in prevalence estimate ranging from 4% to 59% and 1% to 23% in European community-dwelling older adults, respectively.4,5 However, one of the most used criteria for diagnosing these conditions are the Fried's frailty phenotype and The European Working Group on Sarcopenia in Older People 2 (EWGSOP2).4,5 The Fried's frailty phenotype assessment includes gait speed, unintentional weight loss, physical activity levels, exhaustion levels, and muscle weakness determined by handgrip strength test, 6 whereas the EWGSOP2 guideline defines sarcopenia as a reduction in muscle mass and strength, this latter also usually measured using handgrip strength test. 5 Regardless of the similarities between their definitions and diagnosis, these two terms do not refer to the same state and cannot be used interchangeably.7,8 In fact, sarcopenia could be considered a precursor of frailty. 7 In spite of the debate on which syndrome manifests first, scientific literature has observed that its simultaneous presence is predictive of worsening disability 9 and has been associated to up to threefold of risk of mortality compared to those without neither sarcopenia nor frailty. 10 Moreover, transitions between robustness to frailty states (prefrail or frail) are more frequent in sarcopenic individuals whereas improvement from frailty states are more frequent in non-sarcopenic individuals. 7 Since both sarcopenia and frailty are reversible states, their early detection covers a fundamental role in the management of their progression. Unfortunately, sarcopenia and frailty assessment is not implemented routinely in clinical practice due to the lack of equipment and time constrains.11,12
Muscle power declines with aging at an earlier and faster rate compared with muscle mass and strength,13,14 being both the base of the definition of sarcopenia, and it has been considered a predictor of frailty.15,16 Although muscle power has been usually recorded thought specialized instrument such as 3D-motion capture cameras, inertial measurement units and force plates,15,17,18 recent advances in smartphone technology provide the opportunity to access muscle power during a simple functional test using a video analysis-based App in a clinical setting.17–19 Muscle power derived from this App during the sit-to-stand test has been associated to several measures of physical function and frailty determinants such as handgrip strength or reduced gait speed in community-dwelling older adults.17–19 Moreover, a recent study showed that muscle power using this App had the ability to discriminate between sarcopenic and non-sarcopenic individuals without the need of using expensive muscle mass measurement techniques such as dual-energy X-ray absorptiometry or bioelectrical impedance analysis which are not always accessible in a clinical setting. 19 Thus, one could think that adding to this App a proxy of muscle mass could improve its potential for diagnosis both sarcopenia and frailty syndromes. For instance, simple measurements of calf and mid-upper arm circumferences have been observed to represent acceptable surrogates of muscle mass in clinical practice. 20 Reduced calf and mid-upper arm circumferences have been associated to the presence of frailty syndrome 21 and sarcopenia22,23 in community-dwelling older adults. Thus, integrating both muscle power as a proxy of muscle weakness and calf or mid-upper arm circumference as a proxy of muscle mass in a unique tool would be capable of early detecting the simultaneous presence of sarcopenia and frailty syndromes with the advantage of responding to the demands of the clinical setting. Although research in sarcopenia and frailty has increased in recent years, much remains to be done regarding the implementation of these syndromes in clinical practice. Several surveys have highlighted that most healthcare professionals do not use validated instruments for diagnosing frailty and/or sarcopenia and many of them having no clear knowledge of how to diagnose it.24–26 For many healthcare professionals lack of time and lack of appropriate tools are considered the main barriers for screening and diagnosis in clinical practice.11,12,24,25,27 Therefore, the development of a valid and reliable tool to diagnosis both syndromes that is feasible in the clinical setting is much needed. This App might overcome these barriers providing an affordable and valid easy-to-use instrument to rapidly diagnose both syndromes.
The aims of this study were (a) to validate a video analysis App based on muscle power generated during a simple sit-to-stand test and calf or mid-upper arm circumference as a proxy of muscle mass to detect the simultaneous presence of both syndromes in community-dwelling older adults, and (b) to determine its construct validity with health-related adverse events such as falls, hospitalization, comorbidities, depressive symptoms, poor self-perceived health, low socioeconomical and educational levels, and smoking habits and polypharmacy.
Methods
Design and protocol registration
This study aims to report the results of a previous published protocol. 28 Briefly, this was a retrospective diagnostic accuracy study based on Standards for Reporting of Diagnostic Accuracy Studies (STARD) recommendations. The study protocol was registered on ClinicalTrial.gov database (NCT05148351; registration date: 21/12/08) and approved by the Ethical Committee of Catholic University of Murcia (CE022108). The study completely fulfilled the principles stated in the Declaration of Helsinki.
Study participants and eligibility criteria
Individuals aged 60 or more from elderly social centers of the Region of Murcia (Spain) were enrolled over an 8-month period (starting date: February 2022; finishing date: October 2022). Potentially eligible participants were recruited using a convenience model. First, elderly social centers were contacted, providing them information about the development of the study. Once centers gave their consent to carry out the study, potentially eligible participants were contacted either via telephone or face to face, furnishing them a complete explanation (written and oral) of the study procedure. Finally, written consent from each participant was obtained. Participants reporting any severe cardiovascular condition (e.g. heart valve disease, uncontrolled arrythmias, cardiac implants or pacemakers), a Barthel Index score lower than 90 points, a Mini-Cog test score lower than 3 points, as well as inability to stand up from a chair without assistance were excluded from the study.
Data collection procedure
Data collection was performed on a single day and information was gathered by a single researcher on a spreadsheet and another researcher crosschecked each data point by point. The following information was collected: (a) a single sit-to-stand test and calf and mid-upper arm circumference measurement, (b) frailty assessment, (c) sarcopenia assessment, and (d) clinical interview.
Muscle power recorded during the sit-to-stand test and anthropometric circumferences were used as index test to diagnose the simultaneous presence of both syndromes through a video analysis-based App, while the EWGSOP2 recommendations and Fried's frailty phenotype were considered as the reference standards. Furthermore, a clinical interview about health-related risk factors was used as construct validity of the index test.
Index test: muscle power, calf and mid-upper arm circumference
A single sit-to-stand test was carried out and recorded using the Sit to Stand App (version 2.0.1.) installed on an iPhone 13 device running iOS 15.3 (Apple Inc., Cupertino, CA, USA). This app aimed to determine muscle power derived from the rising phase of the sit-to-stand test using a slow-motion video-captured camera (240 frames-per-second). Briefly, participants sat on a rigid and adjustable chair, having their arms crossed over their chest with their hip, and both knee and ankle joints positioned at 90 degrees. Participants had to stand up completely from the chair to the best of their speed. The smartphone was placed horizontally on a 0.7-m-high tripod placed 3 m from the right or left side of the participant. Relativized values of muscle power (W/Kg) generated during the test were determined by the App using the following regression equation:

In which t is the rising time, i.e. the time transition from seat off to complete upright position with the full extension of knee and hip joints, and d represents the vertical distance covered during the test, represented by femur length. Femur length was defined as the distance between the superior aspect of the greater trochanter and the femoral lateral condyle. Following the instructions of the App, to accurately determine the beginning and the end of the movement, a reflective marker was placed on the superior aspect of participants’ greater trochanter. The rising phase started when the pelvis began to move forward after anterior trunk tilt which is time-matched when the reflective marker crossed the first horizontal grid line on the screen of the App. The end of the rising phase was determined when full extension of hip and knee joints was reached which is time-matched when the reflective marker achieved the highest vertical point. This entire procedure has been previously validated and reported negligible bias and small errors compared to force plates and 3D-motion cameras in adults with a broad age range (21–91 years).17,18
Additionally, calf and upper-mid arm circumference were measured as a proxy of muscle mass and entered together with muscle power values in a set of multiple logistic regression equations to determine its ability to predict the presence of both syndromes. Calf circumference was measured through a flexible and inelastic tape placed on the point of greatest circumference of the non-dominant leg, while participants were in a sitting position with the knee and ankle at 90 degrees.21,23 Dominant mid-upper arm circumference was measured placing the tape at the midpoint of the tip of the acromion and olecranon of the arm with participants sitting on a chair. 22 Skin compression was avoided for both measurements. Researchers performed the index test were blinded to the reference standards.
Reference standards
The Fried's frailty phenotype and the EWGSOP2 guideline were used as reference standards to determine the presence of both syndromes in combination. The presence of both syndromes was considered when the participant was classified as prefrail or frail plus confirmed sarcopenia. Since both reference standards share the criteria of muscle weakness using handgrip strength test, we used the alternative criteria recommended by the EWGSOP2 for assessing muscle weakness which involves the five times sit-to-stand test (5STS) instead of handgrip strength test. This was selected in order to avoid overlap between diagnostic criteria. Researchers performed the reference standards were blinded to the index test.
Frailty Assessment. The Fried's frailty phenotype determines frailty state assessing five domains: muscle weakness, unintentional weight loss, physical activity levels, exhaustion levels, and gait speed. 6 Briefly, handgrip strength was used to measure muscle weakness using a digital dynamometer (Takei Scientific Instruments Co., Ltd, Tokyo, Japan) and employing the cut-off points stratified by sex and body mass index (BMI). Self-reported unintentional weight loss was defined as a loss of 4.5 Kg or more during the prior year. Physical activity levels were measured through the Spanish-validated short version of the Minnesota leisure time physical activity questionnaire. To determine the exhaustion levels, participants were asked to rate from 0 (rarely or none of the time) to 3 (most of the time) the frequency with which they experienced the following statements during the prior week: “I felt that everything I did was an effort” and “I could not get going.” Gait speed was assessed with the 4 m usual gait speed test, in which participants were asked to walk at their usual pace a 4 m haul. Cut-off points were stratified by gender and height of the participants. 6 Participants were classified as robust (met none of the frailty criteria), prefrail (met one or two criteria), or frail (met three or more criteria) according to Fried and colleagues. 6
Sarcopenia Assessment. The EWGSOP2 guideline defines probable sarcopenia as a reduction in muscle strength determined as more than 15 s to complete the 5STS test. Then, sarcopenia is confirmed whether a reduction in appendicular skeletal muscle mass (ASM) is present either in absolute values or relative to squared-height, also named skeletal muscle index (SMI). 1 The analysis of muscle mass was performed using a TANITA MC-580 (Tanita Corp., Tokyo, Japan) and reactance and resistance index raw values were introduced in Sergi's validated equation. 29 The cut-off point for ASM was lower than 20 Kg for men and 15 Kg for women whereas the cut-off point for SMI was lower than 7 kg/m2 in men and 5.5 kg/m2 in women. Therefore, two definitions of sarcopenia were obtained, sarcopenia5STS + ASM and sarcopenia5STS + SMI.
Construct validity: risk factors for adverse health-related outcomes
A face-to-face interview was used to obtain information regarding the presence of depressive symptoms (Geriatric Depression Scale; cut-off point: ≥ 2), self-perceived health (low self-perceived health cut-off point: very bad, bad or fair), socioeconomic status (annual net salary <10,000€), educational level (low educational level cut-off point: primary or less), presence of comorbidity (two or more chronic conditions), polypharmacy (daily intake ≥5 drugs), presence of two or more falls in the last year, hospitalizations in the last year, and current smoking habit was registered and dichotomized in order to assess the construct validity of our index test to determine the presence of risk factor for adverse health-related outcomes in those classified with both syndromes. Detailed information about general data collection can be found in the published version of the study protocol. 28
Sample size estimation
In a Spanish-based community-dwelling older population, the simultaneous prevalence of both syndromes is reported in a range from 10.5% to 13.7%.8,9 To ensure the most realistic sample size calculation, the lowest prevalence rate was taken as reference. Consequently, according to Bujang and Adnan's, 30 a minimum of 400 participants (200 men and 200 women) were necessary to achieve a statistical power of 80%, with an alpha error fixed at 0.05 and an area under the curve (AUC) of minimum 0.8.
Statistical analysis
A database was created on Microsoft Excel© (Microsoft Corp., Redmond, WA, USA) to record all participants data and IBM SPSS Statistics (26.0, SPSS Inc., Chicago, Ill, USA) was used to carry out data analysis. Continuous variables were reported as means and standard deviations in the presence of normal distribution otherwise data was expressed as median and interquartile range. Categorical data were expressed as frequencies and percentages. Statistical significance was fixed at p < .05.
Objective 1: Diagnostic accuracy. The presence of sarcopenia and frailty syndromes was defined when the participant was categorized as frail or prefrail plus sarcopenic5STS + ASM or sarcopenic5STS + SMI. Subsequently, a set of multiple logistic regression equations stratified by sex with both syndromes as the dependent variable and muscle power, calf circumference, and mid-upper-limb circumference as independent variables were performed to create predictive equations to diagnose both syndromes. Since calf circumference was more related with both syndromes than mid-upper-limb circumference, it was deleted from the final model (Supplementary Material, Table S1). Receiver operating characteristic analyses with their AUC were performed using predictive probability from the results of the multiple logistic regression analyses to identify the best cut-off point to discriminate the presence of both syndromes compared to either condition alone (prefrail, frail, or sarcopenic) and healthy (robust or non-sarcopenic) participants. Then, a sensitivity analysis was performed in order to assess the potential to discriminate between participants categorized with both syndromes and those categorized as either condition alone, as well as between participants categorized with both syndromes and those categorized as healthy participants. The AUC were reported and interpreted as no discrimination (0.5), acceptable (0.7 to < 0.8), excellent (0.8 to 0.9), and outstanding (> 0.9). Values of sensitivity, specificity, positive and negative predictive values (PPV and NPV), likelihood ratios, diagnostic accuracy and diagnostic odds ratios (OR) were calculated. Moreover, the number needed to get a false positive (NNFP) and a false negative (NNFN) test were determined and reported, as well as their 95% confidence interval (95% CI). To avoid infinite values in the diagnostic accuracy tests, Haldane-Anscombe correction was carried out. Missing data were excluded from the analysis and a two-tailed test was performed for all statistical analysis.
Objective 2: Construct validity. Relationships between health-related outcomes (socioeconomic status, education level, smoking habit, polypharmacy, self-perceived health, comorbidities, depression, falls and hospitalization) in those participants categorized with both syndromes according to the index test compared to their healthy counterpart were assessed using unadjusted and adjusted logistic regression analyses for age, sex, and BMI. The OR and their 95% CI were calculated. A unidirectional approach (one-tail) was performed for all statistical analysis.
Results
Participants characteristics
A total of 775 individuals took part in this study. Among them, a total of 59 individuals were excluded due to a potential risk of dementia (Mini-Cog < 3 points) and 17 individuals were excluded due to an implanted electronic device. Furthermore, a total of 10 individuals were excluded from data analysis due to the lack of essential data (i.e. femur length and circumference measurements), and three individuals were lost due to unintentional video deleted. Thus, a total of 406 women and 280 men were finally included.
According to the Fried's frailty phenotype, participants were classified as frail 3.1% (n = 21), prefrail 35.3% (n = 242), and robust 61.6% (n = 423). The EWGSOP2 criteria diagnosed sarcopenia5STS + ASM in a total of 11.1% (n = 76) and sarcopenia5STS + SMI in a total of 6.1% (n = 42) participants. Finally, the prevalence of both syndromes, i.e. people categorized as frail or prefrail plus sarcopenia was in a range from 2.9% to 7.2% depending on the diagnosis criteria used for sarcopenia assessment. Detailed information about sample characteristics is reported in Table 1. No serious adverse events were reported performing neither the index test nor the reference standards, but some participants hit their head against the wall when sitting down during the 5STS test because the chair was placed next to the wall.
Sample characteristics (n = 686).

Continuous variables are shown as means and standard deviations or median and interquartile range due to non-normal distribution, while categorical variables are shown as absolute frequencies and percentages. BMI: Body mass index; MUA: Mid-upper arm; ASM: Appendicular skeletal muscle mass; SMI: Skeletal muscle index; 5STS: 5 times sit-to-stand test.
Objective 1: diagnostic accuracy
After a set of multiple regression equations, muscle power and calf circumference represented the best-explained model to detect both syndromes compared to either condition alone and healthy participants (Supplementary Material, Table S1). Therefore, these predictive equations were integrated into the App to assess their diagnostic accuracy (Figure 1).

User interface of the Sit to Stand App running on an iPhone 13. Top left panel: Settings for selecting the different criteria proposed by the EWSGOP2 guideline. Top middle panel: Participant characteristic required by the App. Top right panel: Results from the App after video analysis. Horizontal panel: Video analysis at 240 frames-per-second selecting the first frame corresponding to the beginning of the rising phase, when the white dot crosses the first horizontal grip line on the screen. Example for a men diagnosed with both syndromes by the App with femur length 0.442 m and calf circumference of 0.343 m.
Our sensitivity analysis showed that the App discriminated the simultaneous presence of both syndromes with AUC values from 0.74 (95% CI: 0.63–0.86) to 0.88 (95% CI: 0.78–0.93) compared to either condition alone, i.e. frail, prefrail or sarcopenic individuals. As expected, the ability to detect the presence of both syndromes compared to healthy individuals (robust or non-sarcopenic) improved with AUC values from 0.84 (95% CI: 0.73–0.94) to 0.96 (95% CI: 0.84–0.99) (Table 2). However, when the App was used to discriminate between both syndromes to those classified with either condition alone and healthy individuals, the AUC values ranged from 0.80 (95% CI: 0.70–0.91) to 0.92 (95% CI: 0.88–0.96). These results showed sensitivity values in a range of 75% to 100% and specificity values in a range of 81.7% to 87.2% depending on the diagnostic criteria used to determine sarcopenia (Table 3). From each 100 individuals tested, a range from 13 to 17 individuals could get a false positive test whereas a range from 0 to 2 individuals could get a false negative test. Additional information about diagnostic performance of the App is shown in Table 3. Cross-tabulations of the index test and the reference standards of sarcopenia can be found in Supplementary Material, Table S2.
Sensitivity analysis of the Sit to Stand App to detect both syndromes compared to either condition alone and compared to healthy individuals.

Either condition alone is referred to frail, prefrail or sarcopenic people, whereas healthy individuals are referred to non-sarcopenic or robust people. Data are reported as area under the curve with their 95% confidence interval. 5STS: 5 times sit-to-stand test; ASM: Appendicular skeletal muscle mass; SMI: Skeletal muscle index.
Sit to Stand App diagnostic accuracy to detect both syndromes compared to either condition alone plus healthy (n = 686).
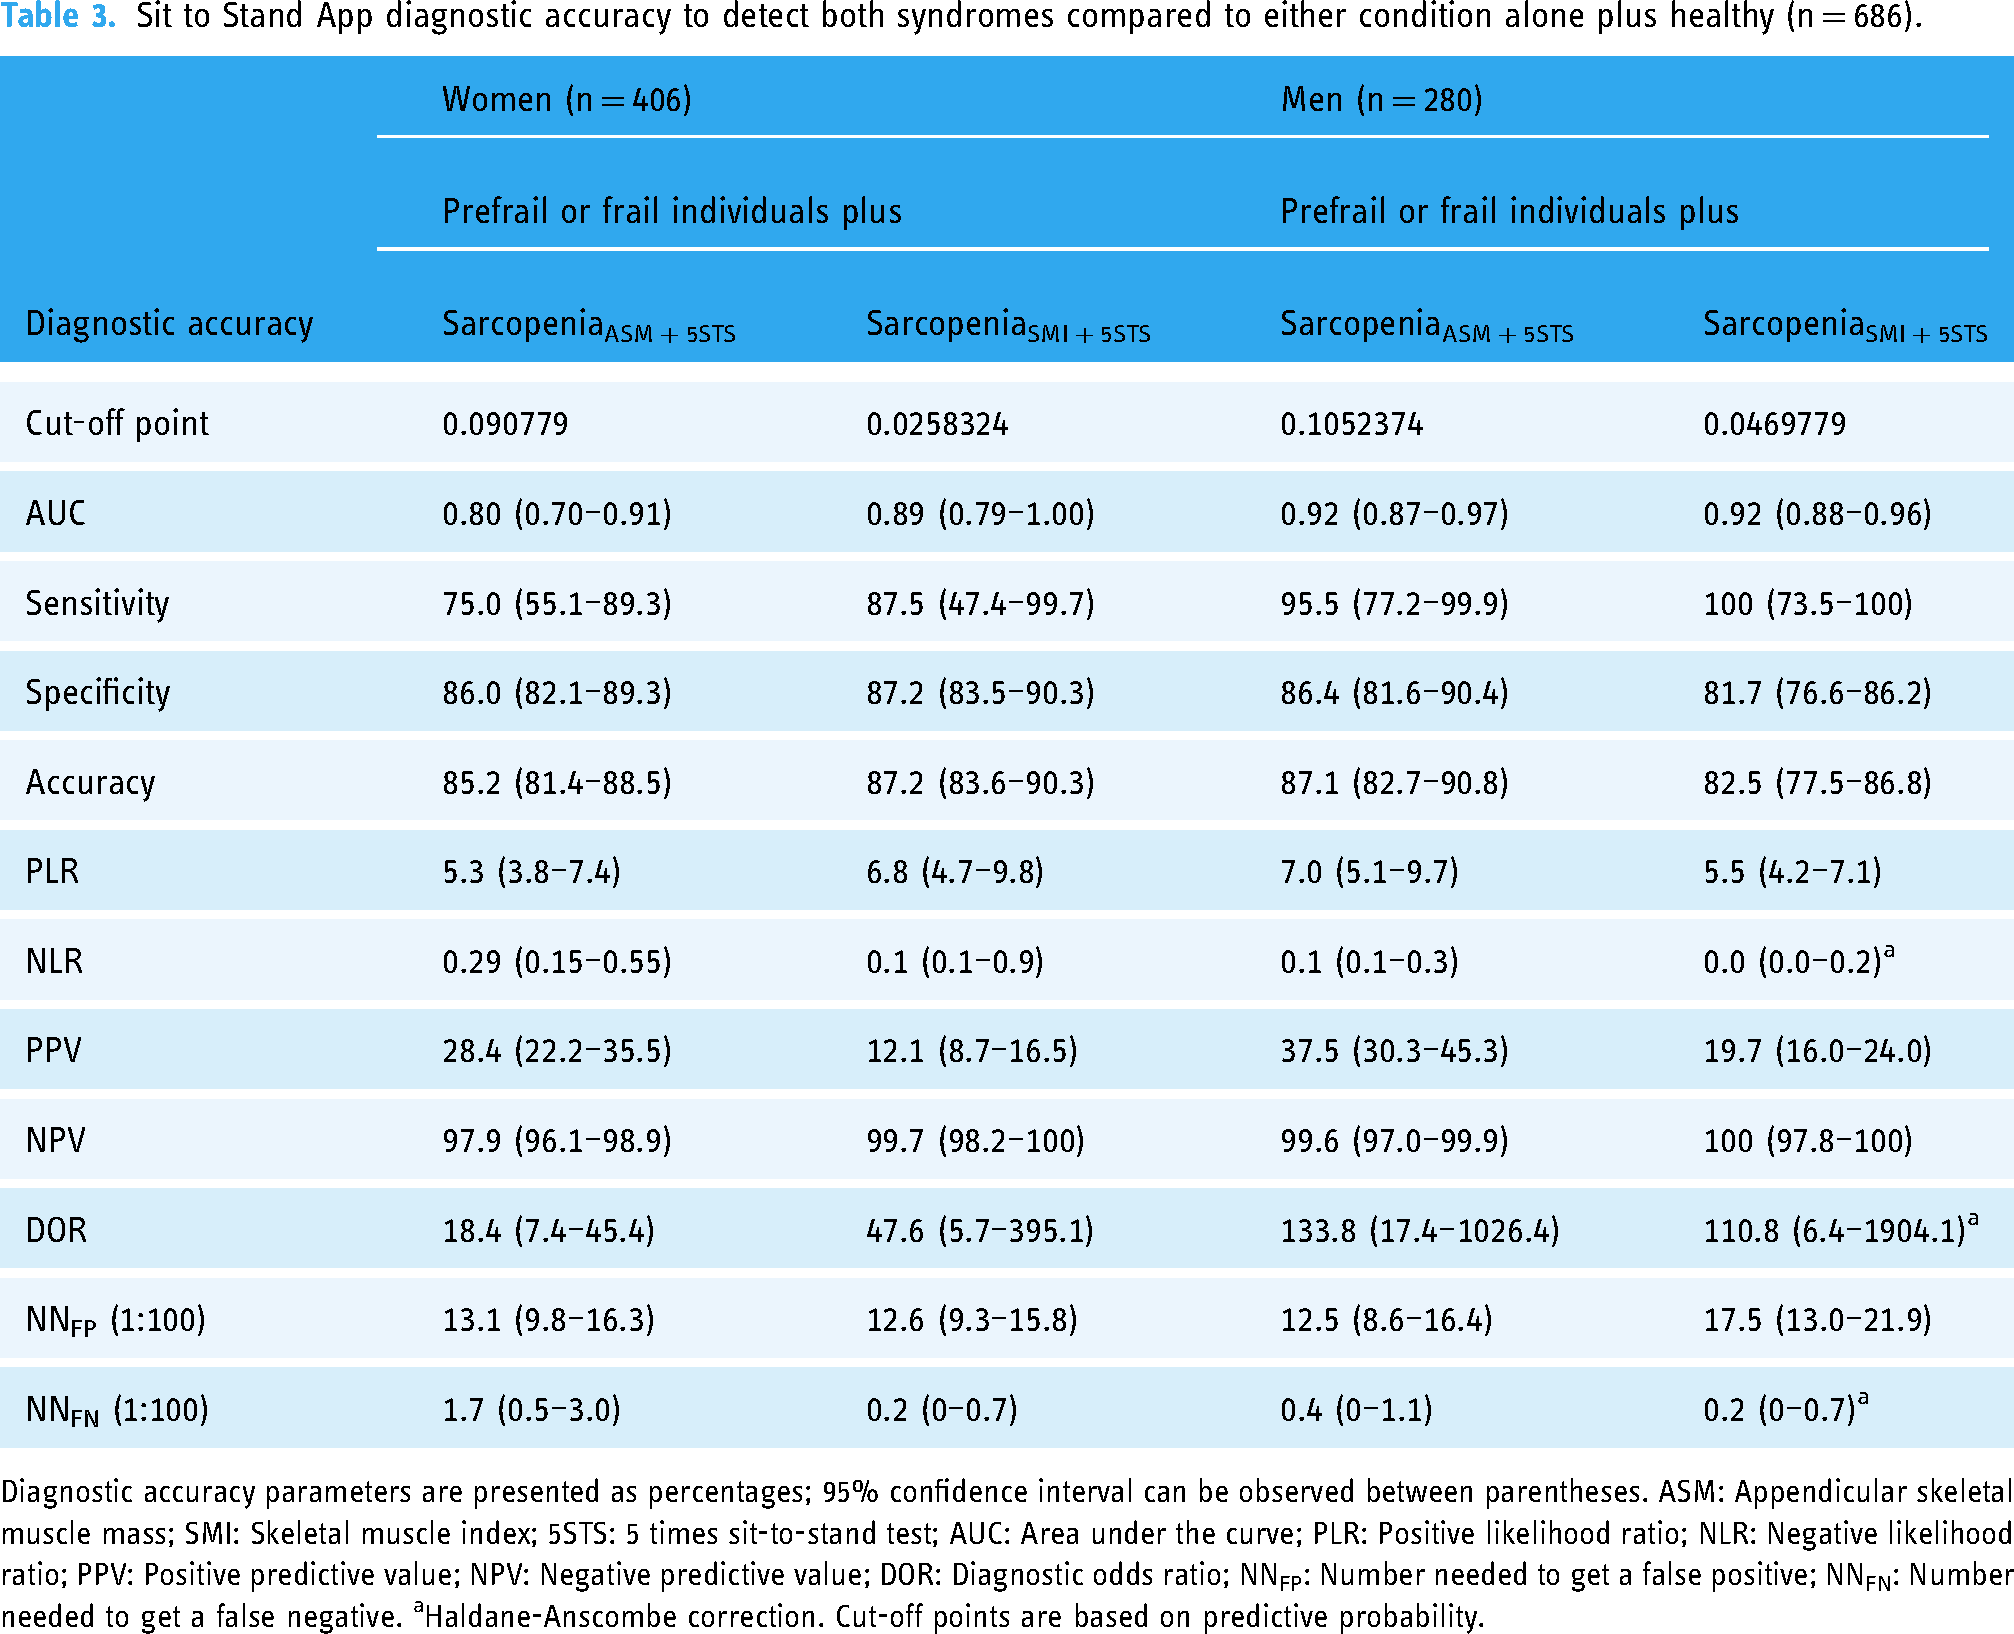
Diagnostic accuracy parameters are presented as percentages; 95% confidence interval can be observed between parentheses. ASM: Appendicular skeletal muscle mass; SMI: Skeletal muscle index; 5STS: 5 times sit-to-stand test; AUC: Area under the curve; PLR: Positive likelihood ratio; NLR: Negative likelihood ratio; PPV: Positive predictive value; NPV: Negative predictive value; DOR: Diagnostic odds ratio; NNFP: Number needed to get a false positive; NNFN: Number needed to get a false negative. aHaldane-Anscombe correction. Cut-off points are based on predictive probability.
Objective 2: construct validity
The presence of both syndromes in combination as detected by the App showed relationships with several health-related outcomes regardless of the diagnostic criteria used to determine sarcopenia. Concretely, in our adjusted analysis participants diagnosed with both frailty or prefrailty plus sarcopenia5STS + ASM syndromes showed an increased odds to present low educational levels (OR: 2.29; 95% CI: 1.27–4.14), low socioeconomic level (OR: 2.35; 95% CI: 1.13–4.89), comorbidity (OR: 4.30 ; 95% CI: 1.69–10.96), smoking habit (OR: 2.73; 95%CI: 1.18–6.33), polypharmacy (OR: 5.00; 95% CI: 2.73–9.15), depression (OR: 4.56; 95% CI: 2.45–8.49), poor self-perceived health (OR: 6.39; 95% CI: 3.50–11.69), falls (OR: 2.35; 95%CI: 1.16–4.76), and hospitalization (OR: 2.84; 95%CI: 1.38–5.84), compared to their healthy counterpart. Similar relationships were observed for those participants categorized by the App with the presence of both frailty or prefrailty plus sarcopenia5STS + SMI syndromes, but with the exception of the socioeconomic level and smoking habit. Detailed results are shown in Table 4.
Construct validity. Risk factors for both syndromes detected by the Sit to Stand App compared to their healthy counterpart.

ASM: Appendicular skeletal muscle mass; SMI: Skeletal muscle index; 5STS: 5 times sit-to-stand test; OR: Odds ratio; CI: Confidence interval. Adjusted OR for age, sex, and body mass index. Statistical significance at an alpha level of 0.05 is represented by asterisks (*P < .05).
Discussion
This study aimed to validate a video analysis App based on sit-to-stand kinetic and anthropometric data to detect community-dwelling older adults diagnosed with both frailty or prefrailty plus sarcopenia syndromes. In general, the App demonstrated excellent to outstanding ability (AUC range: 0.80–0.92) to discriminate both syndromes from their respective counterparts, regardless the diagnostic criteria used for sarcopenia assessment. Additionally, the simultaneous presence of both syndromes detected by our index test was associated with an increased odds of adverse health-related outcomes such as polypharmacy, comorbidities, smoking habit depression, poor self-perceived health, falls, hospitalization, as well as low educational attainment and socioeconomic status.
Nowadays, different options to screening for sarcopenia or frailty are available in ordinary clinical practice. Concretely, the EWGSOP2 recommends the use of SARC-F screening tool for the detection of possible cases of sarcopenia, representing an inexpensive and accessible method. 1 However, despite the good reliability, a recent systematic review and meta-analysis from 29 studies (n = 21,855 participants) recommends to apply the diagnostic criteria without screening because the SARC-F showed low to moderate sensitivity (29%–55%) which could lead to a high rate of false negative results. 31 Similarly, the SARC-F has been suggested as a possible option to detect frailty in older adults. However, in spite of the excellent specificity values observed (92.6%), this screening tool may not be suitable due to its low sensitivity (46.2%). 32 Other more sophisticated instruments have been used in a research context for analyzing kinetic and kinematic variables derived from functional test. Vertical velocity, power and impulse obtained during the sit-to-stand test using inertial measurement units demonstrated excellent discriminatory capacity to distinguish among robust, prefrail, and frail individuals (AUC > 93%). 15 Similarly, vertical ground reaction force during the sit-to-stand test using a force plate was able to discriminate between sarcopenic and non-sarcopenic individuals with AUC values of 87.9% and 84.4% for men and women, respectively. 33 However, these studies employed expensive and/or time-consuming technologies, which requires of technical competence for data analysis, representing a potential barrier for its implementation in clinical practice. Our results were similar to those reported in previous studies (AUC range: 80–92%) but providing an affordable and easy-to-use App for detecting the combined presence of both syndromes with the advantage of overcoming the aforementioned issues. This tool consisted in an updated version of a previous validated App based on muscle power values but adding calf circumference anthropometric measured.17,18 Mid-upper arm circumference has been observed to be a reliable alternative to muscle mass for sarcopenia diagnosis, as well as an important predictor of frailty.22,34 However, previous studies claimed that calf circumference could be a better marker of muscle mass than mid-upper arm circumference, since fat deposits in this body area are less likely than other regions. 20 These findings could explain the reason why calf circumference plus muscle power represented the best-explained model for detecting both syndromes in our study. Muscle power was shown to be a strong predictor of mortality, independently of muscle strength, muscle mass, and physical activity levels. 35 Similarly, calf circumference has been independently associated to an elevated risk of mortality at 9 years of follow-up. 36 These findings highlight the use of these variables integrated into a simple smartphone App for routine evaluation in a clinical setting.
The term sarcopenia has usually been used as a synonym of physical frailty probably because they share diagnostic criteria. Since there is no an established gold standard to detect both conditions simultaneously, the diagnostic ability of our App was tested against the most employed diagnostic tools, the EWGSOP2 recommendations and the Fried's frailty phenotype. Both tools use handgrip strength to determine muscle weakness as diagnostic criterion in their definition. Since the cut-off points established in sarcopenia assessment are lower than the ones established in frailty, a subject diagnosed with probable sarcopenia would automatically be categorized as prefrail, leading to an overlap between these two syndromes. Thus, in order to avoid a misleading overlap between conditions, the 5STS test was used in our study for muscle strength assessment in sarcopenia diagnosis. Additionally, two definitions of sarcopenia were used in our study because it has been recently reported that there is scarce overlap when sarcopenia is confirmed by a reduction in ASM or SMI, i.e. nearly 50% people diagnosed as sarcopenic5STS + ASM were categorized as non-sarcopenic using the sarcopenia5STS + SMI criterion. 37 In spite of this, the App reported good to excellent accuracy values (82.5%–87.2%) to identify the simultaneous presence of both syndromes regardless the definition used for sarcopenia diagnosis. The low PPV observed (12.1%–37.5%) could be influenced by the low prevalence rate (2.9%–7.2%) found in our study. This could be probably due to the fact that subjects were enrolled from elderly social centers in which physical activity is highly promoted. In fact, 85% of men and almost 95% of women were categorized as physically active. A recent systematic review observed that physical activity could take an essential role in the prevention of both frailty and sarcopenia syndromes. 38 Even though these results seem not to differ from the ones of other screening tools employed for the identification of either sarcopenia or frailty alone in community-dwelling older adults.31,39 The NPV observed was excellent (97.5%–100%), indicating that this tool is very suitable to rule out the presence of both syndromes in community-dwelling older adults. This is supported by the low number needed to detect a false negative which ranged from 0% to 1.7%, i.e. in the worst-case scenario, for each 100 individuals analyzed with this App only 2 of them could get a false negative test. Additionally, our sensitivity analysis supported the notion that this App was capable to ascertain the presence of both syndromes compared to those participants categorized with either condition alone (frails, prefrails, or sarcopenic) (AUC range: 0.74–0.88) or compared to those participants categorized as healthy (robust or non-sarcopenic) (AUC range: 0.84–0.96). Therefore, these findings confirm that our analyses are not influenced by the presence of healthy individuals with extreme values of predictive probability.
Furthermore, participants identified with both syndromes by the App showed an increased odds for adverse health-related outcomes like falls, hospitalization, depression, polypharmacy, comorbidities, smoking habit, poor self-perceived health, as well as low educational and socioeconomic level compared to their healthy counterpart. These results are not surprising since previous studies have reported an increased risk of adverse outcomes such as falls, increased disability, or even threefold of mortality risk in those classified with both syndromes compared to their healthy counterparts.9,10,40 These results stress out the important consequences of the combination of sarcopenia and frailty for older adults’ health. This App may provide clinicians the opportunity to early detect frailty or prefrailty plus sarcopenia syndromes, and especially to exclude their simultaneous presence, with the advantage of being an easy, affordable, and efficient tool.
This study is not without limitations. First, this was a retrospective diagnostic study, so its external validity is limited. However, this study represents the basis for future prospective validations. Additionally, participants’ muscle mass was assessed through bioelectrical impedance analysis, which is a reliable tool but not the gold standard for muscle mass measurement. However, as recommended by the EWGSOP2 guideline, Sergi's cross-validated equation was used in order to overcome this issue.1,29 Last, the index test was associated with adverse health-related outcomes, but these outcomes were recorded in the form of self-reported questionnaire, and the cross-sectional nature of the study design do not allow causal relationship among variables.
Conclusions
The updated version of the Sit to Stand App combining muscle power and calf circumference seems to be a reliable tool to detect and rule out the simultaneous presence of frailty or prefrailty plus sarcopenia syndromes in Spanish community-dwelling older adults. Moreover, individuals identified by the App were more likely to present health-related risk factors compared to their healthy counterpart. Further studies are needed to independently evaluate the external validity of this App in community-dwelling older adults.
Supplemental Material
sj-docx-1-dhj-10.1177_20552076241232878 - Supplemental material for Validity of a video-analysis-based app to detect prefrailty or frailty plus sarcopenia syndromes in community-dwelling older adults: Diagnostic accuracy study
Supplemental material, sj-docx-1-dhj-10.1177_20552076241232878 for Validity of a video-analysis-based app to detect prefrailty or frailty plus sarcopenia syndromes in community-dwelling older adults: Diagnostic accuracy study by Alessio Montemurro, Juan J Rodríguez-Juan, María del Mar Martínez-García and Juan D Ruiz-Cárdenas in DIGITAL HEALTH
Supplemental Material
sj-docx-2-dhj-10.1177_20552076241232878 - Supplemental material for Validity of a video-analysis-based app to detect prefrailty or frailty plus sarcopenia syndromes in community-dwelling older adults: Diagnostic accuracy study
Supplemental material, sj-docx-2-dhj-10.1177_20552076241232878 for Validity of a video-analysis-based app to detect prefrailty or frailty plus sarcopenia syndromes in community-dwelling older adults: Diagnostic accuracy study by Alessio Montemurro, Juan J Rodríguez-Juan, María del Mar Martínez-García and Juan D Ruiz-Cárdenas in DIGITAL HEALTH
Footnotes
Acknowledgements
The authors would like to thank the elderly social centers for their kind availability and for facilitating the spaces as well as the materials for the development of this study.
Contributorship
All authors were involved in protocol development, patient recruitment and data analysis. AM wrote the first draft of the manuscript. All authors reviewed and edited the manuscript and approved the final version of the manuscript. JDRC, JJRJ & MdMMM acquired the fundings. JDRC was involved in gaining ethical approval.
Declaration of conflicting interests
The authors declared no potential conflicts of interest with respect to the research, authorship, and/or publication of this article.
Ethical approval
The ethics committee of Catholic University of Murcia approved this study (CE022108).
Funding
The author(s) disclosed receipt of the following financial support for the research, authorship, and/or publication of this article: This work was supported by Universidad Católica de Murcia [grant number PMAFI-07/19] and by the Comunidad Autónoma de la Región de Murcia grants for the development of scientific and technical research by competitive groups included in the Programa Regional de Fomento de la Investigación Científica y Técnica de la Fundación Séneca-Agencia de Ciencia y Tecnología de la Región de Murcia (grant number 21639/PDC/21).
Guarantor
JDRC
Supplemental material
Supplemental material for this article is available online.
References
Supplementary Material
Please find the following supplemental material available below.
For Open Access articles published under a Creative Commons License, all supplemental material carries the same license as the article it is associated with.
For non-Open Access articles published, all supplemental material carries a non-exclusive license, and permission requests for re-use of supplemental material or any part of supplemental material shall be sent directly to the copyright owner as specified in the copyright notice associated with the article.