
Abstract
Background
We have shown classical cardiac auscultation was superior to remote auscultation. We developed a phonocardiogram system to visualize sounds in remote auscultation.
Objective
This study aimed to evaluate the effect of phonocardiograms on the diagnostic accuracy in remote auscultation using a cardiology patient simulator.
Methods
In this open-label randomized controlled pilot trial, we randomly assigned physicians to the real-time remote auscultation group (control group) or the real-time remote auscultation with the phonocardiogram group (intervention group). Participants attended a training session in which they auscultated 15 sounds with the correct classification. After that, participants attended a test session where they had to classify 10 sounds. The control group auscultated the sounds remotely using an electronic stethoscope, an online medical program and a 4-K TV speaker without watching the TV screen. The intervention group performed auscultation like the control group but watched the phonocardiogram on the TV screen. The primary and secondary outcomes were the total test scores and each sound score, respectively.
Results
A total of 24 participants were included. The total test score in the intervention group (80/120, 66.7%) was higher than that in the control group (66/120, 55.0%), although the difference was statistically insignificant (P = .06). The correct answer rates of each sound were not different. Valvular/irregular rhythm sounds were not misclassified as normal sounds in the intervention group.
Conclusions
Using a phonocardiogram improved the total correct answer rate by more than 10% in remote auscultation, although statistically insignificant. The phonocardiogram could help physicians screen valvular/irregular rhythm sounds from normal sounds.
Trial registration
UMIN-CTR UMIN000045271; https://upload.umin.ac.jp/cgi-open-bin/ctr/ctr_view.cgi?recptno=R000051710
Introduction
Since the pandemic of coronavirus 2019 (COVID-19), telemedicine has rapidly spread worldwide. 1 This was partly because telemedicine can help with remote medical assessments and the medical staff's preparation for patient care. 1 However, physicians are generally not able to perform physical exams through telemedicine. 1 Therefore, the lack of enough medical information, including the information obtained in physical examinations, was one of the limitations to adopting telemedicine. 2
To facilitate the spread of telemedicine, the performance of a remote physical examination is one of the solutions. There are several approaches for conducting a remote physical examination including visual clue, 3 percussion, 4 palpation, 5 and auscultation. These evaluations can be enhanced using digital devices such as wearables devices and home monitoring devices.
Cardiopulmonary auscultation is an important physical examination skill to improve the diagnosis.6,7 Our research laboratory team developed a unique real-time remote auscultation system using an electronic stethoscope. The system could keep both the quality of lower-pitch sounds and the internet speeds. In our previous study, the diagnostic accuracy of real-time remote cardiopulmonary auscultation with a Bluetooth-connected electronic stethoscope was comparable to that of direct auscultation with a classical stethoscope. 8 To auscultate from more distant places, we also revealed that real-time remote lung auscultation with an internet-connected electronic stethoscope was comparable to classical auscultation. However, remote cardiac auscultation using an internet-connected electronic stethoscope was inferior to classical cardiac auscultation. 9 Therefore, another system to assist remote cardiac auscultation is needed for high-quality telemedicine.
Phonocardiograms are the visual representations of cardiac sounds that can be used for diagnosis.10–12 Phonocardiograms were developed in an attempt to provide quantitative and qualitative information on cardiac sounds. 13 The presence of an S3 by a phonocardiogram is highly sensitive for ventricular dysfunction.14–16 In another previous study, the phonocardiogram for cardiac auscultation improved the diagnostic accuracy for abnormal cardiac sounds and murmurs. 17 Phonocardiograms have also been used as the gold standard to check the accuracy and interobserver agreement of the auscultation skills of physicians. 18 In recent years, computer-aided detection technology for phonocardiograms has aroused wide interest.19–21 Therefore, we developed a new system adding a phonocardiogram to improve the diagnostic accuracy of real-time remote cardiac auscultation. We conducted this study to assess the hypothesis that using a phonocardiogram in real-time remote auscultation improved the diagnostic accuracy.
Materials and methods
Study design, setting, and participants
This was an open-label randomized controlled pilot study. This research was designed to evaluate the utility of the phonocardiogram in remote cardiac auscultation. Remote auscultation using an internet connection was used as a control. For standardization and reliability, a cardiology patient simulator for cardiac auscultation was used. 6 All sessions in this research were conducted at the skills lab and the research room in the Department of Diagnostic and Generalist Medicine, Dokkyo Medical University. The direct distance between the two places is approximately 200 m. Attending physicians and senior residents in the Department of Diagnostic and Generalist Medicine and junior residents in the university hospital were recruited as the participants. Attending physicians, senior residents, and junior residents were classified according to the years since obtaining a degree in Medicine (attending physicians: ≧6 years, senior residents: 3–5 years, junior residents: ≦2 years). The attending physicians and senior residents were internist. Junior residents did not have any specialization and rotated through several departments at the hospital. Participants who refused to participate in this study or had hearing loss were excluded. The research was conducted in accordance with the Declaration of Helsinki. The study was approved by the institutional review board of Dokkyo Medical University Hospital, Tochigi, Japan (R-49-18J). Written informed consent was obtained from each participant after the explanation of this study's protocols before participation.
Study flow and randomization
Participants were randomly assigned (group randomization) into either a real-time remote auscultation with a phonocardiogram group (intervention group) or a real-time remote auscultation only group (control group). After being assigned to a group, the participants performed a training session, followed by a test session. A blinded main investigator randomly allocated the participants into blocked randomization using a computer-generated table. The computer-generated table was made by another investigator who did not participate in the evaluation or analysis.
Training session
In the training session, the investigator placed an internet-connected electronic stethoscope at four standardized positions on a cardiology patient simulator in the skills lab (Figure 1(a)). The investigator simultaneously auscultated to check the cardiac sounds and the noises. The participants learned 15 cardiac sounds and murmurs, which are shown in Table 1. These cardiac sounds and murmurs were previously determined in order with the correct classification. The four standardized positions were the same as in our previous study. 8 Each sound was played for a maximum of one minute.

The internet-connected real-time remote auscultation processes. (a) The investigator placed an electronic stethoscope on the simulator. (b) The participant in the intervention group remotely auscultated the sound with the 4-K TV screen visualizing the phonocardiogram and spectrogram. (c) The participant in the control group remotely auscultated the sound with an internet-connected medical system.
List of the heart sounds and murmurs in the lesson and test sessions.
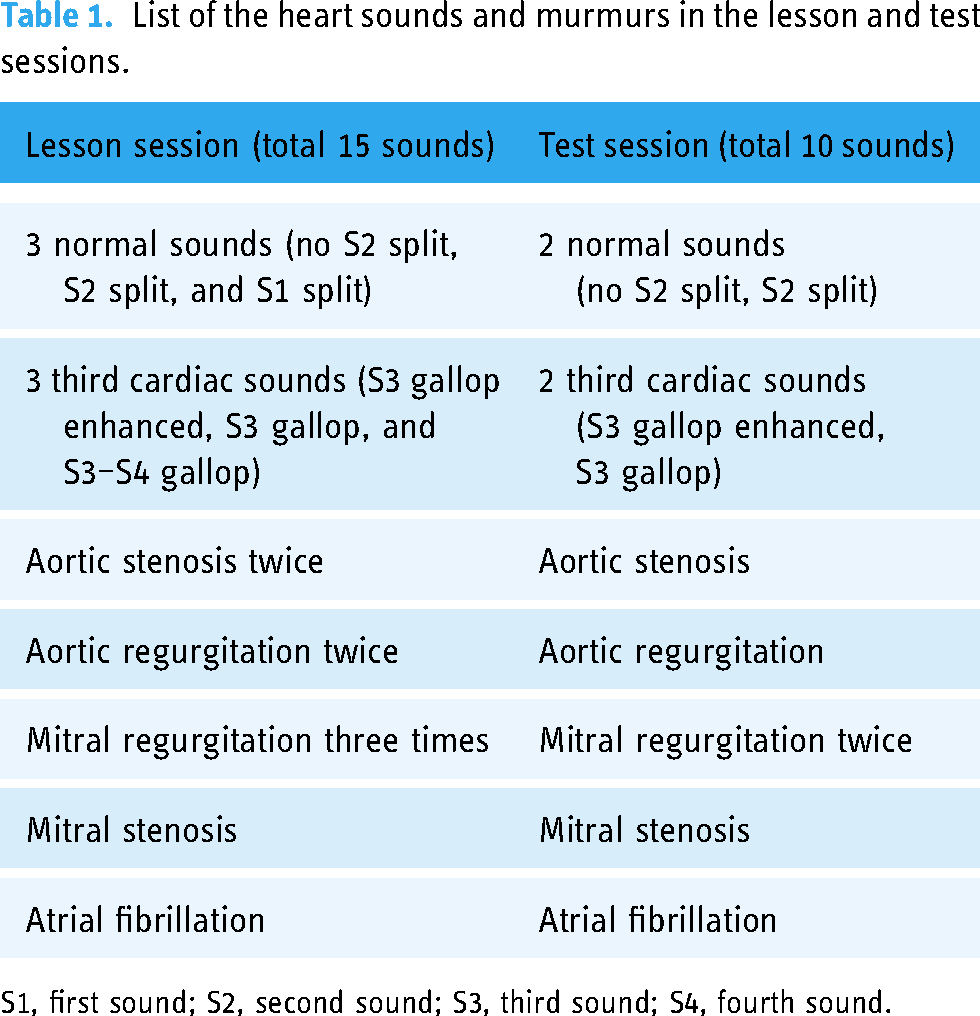
S1, first sound; S2, second sound; S3, third sound; S4, fourth sound.
All participants remotely auscultated all sounds using an electronic stethoscope (JPSE-01, MEMS CORE Co., Ltd), a wireless module (BioCMOS Co., Ltd), an online medical care program (Smart Cure, Smart Gate Inc.), and 4-K TV screen including speaker (4T-C55AJ1, Sharp Inc.) at the research room. The intervention group auscultated the sounds by watching the phonocardiogram on the TV screen (Figure 1(b)). The control group auscultated the sounds like the intervention group did but did not watch the TV screen throughout the session (Figure 1(c)).
Test session
In this session, all participants remotely auscultated the 10 cardiac sounds in a random order. The sounds are shown in Table 1. In the intervention group, the phonocardiogram was shown on the monitor display during real-time remote auscultation, similar to the training session. In the control group, the phonocardiogram was not shown for the participants. The participants determined the types of sounds they recognized on a structured questionnaire.
Cardiology patient simulator
In this research, the same cardiology patient simulator (MW41; Kyoto Kagaku Co., Ltd) was used in all of the sessions. This simulator was designed for medical education lessons. Eighty-eight sophisticated cardiac sounds that were recorded from real patients were determined by using a higher-quality sound system. None of the participants were allowed to check the simulator's screen, which had the following parameters: vital signs, electrocardiogram, carotid artery pulse, jugular vein pulse, and apex cardiogram.
Electronic stethoscope
The electronic stethoscopes were equipped with pressure-sensitive sensors. The sound signals were converted to sound waves through a stethoscope. The stethoscope had three modes. In this research, the investigators used the bell mode (20–100 Hz).
Phonocardiogram
Phonocardiograms are visual representations of heart sounds, and they have been used for diagnostic purposes. WavePlot (BioCMOS Co., Ltd) is a software application for recording and analyzing the sounds from an electronic stethoscope. Phonocardiograms, spectra and spectrograms were utilized to visualize the sounds (Figure 2). The phonocardiogram and spectrogram were shown only to the intervention group on the monitor display in all of the sessions.

Waveplot (BioCMOS Co., Ltd) application visualized the phonocardiogram, spectrum and spectrogram.
Data collection, outcome measures
Participants provided demographic information, including their age, sex, and the number of years since obtaining a degree in medicine. The investigators collected all of the participants’ answers for each cardiac sound in the structured questionnaire. The test score in each group and the rate of correct answers for each cardiac sound were the primary and secondary outcome measures, respectively.
Sample size calculation
In our previous study, the diagnostic accuracy of real-time remote cardiac auscultation was 72%. 9 In a previous study, the diagnostic accuracy with the phonocardiogram was approximately 9% higher than that without the phonocardiogram. 17 To determine the required sample size, we set the α error to 0.05, the β error to 0.2, and an equal sample size was used for the two groups. The expected mean score in the intervention group was set to 81% and that in the control group was set to 72%. A total of 220 answers were required. The sample size was ensured by including 10 questions and recruiting 24 participants, and some participants were expected to dropout or have missing data.
Data analysis
The test score in each group and the percentages of correct answers for each of the cardiac sounds were compared using Fisher's exact test for the primary and secondary outcome measures, respectively. Continuous data (of the participants’ baseline characteristics) are presented as medians with 25th and 75th percentiles (IQRs) and were compared using the Mann–Whitney U test. Categorical and binary data (of the participants’ baseline characteristics) are presented as numbers (percentages) and were compared using Fisher's exact test. As subgroup analyses, we compared the test score between resident and attending in both the control and the intervention groups. A statistical power analysis was performed using the program G*power version 3.1.9.6 (Department of Psychology of Heinrich Heine University Düsseldorf, Düsseldorf, Germany). A P value of <.05 was considered statistically significant. All analyses were conducted by R 3.6.0 for MacOS X (The R Foundation for Statistical Computing, Vienna, Austria).
Results
Participant profiles
A total of 24 participants were included in this study (Figure 3). Sixteen out of 24 were physicians in the Department of Diagnostic and Generalist Medicine at Dokkyo Medical University. Eight out of 24 were junior residents at Dokkyo Medical University. The median age of all participants was 29 years (interquartile range (IQR) 4.5 years); 18 participants (75%) were male; and the median number of years since obtaining a degree in medicine was 3.5 (IQR 5). The intervention group and the control group both included twelve participants each. There were statistically insignificant differences in the participants’ age (P = .14), sex (P > .99), and years since obtaining a degree in medicine (P = .06) between the two groups. Baseline characteristics of the participants in both groups are shown in Table 2.

Flowchart of the participants in the study.
Baseline characteristics of the participants in the remote auscultation + phonocardiogram (intervention) group and the remote auscultation only (control) group.

Mann–Whitney U test.
Fisher exact test.
Diagnostic performance
The total test scores and percentages of correct answers for each cardiac sound are shown in Table 3. The total test score in the intervention group (80/120, 66.7%) was higher than that in the control group (66/120, 55.0%), although the difference was statistically insignificant (P = .06). The percentages of correct answers of the normal cardiac sounds (P = .77), S3 (P = .14), aortic stenosis (P = .16), aortic regurgitation (P = .10), mitral stenosis (P = .09), mitral regurgitation (P = .37), and atrial fibrillation were not different between the two groups. The percentage of correct answers for each sound in the intervention groups was statistically insignificant but was higher than that in the control groups, except for aortic stenosis (66.7% vs. 91.7%).
Cardiac sounds that were correctly identified.

Fisher exact test.
The details of the answers are provided in Table 4. Misinterpretations between normal cardiac sounds and S3 were frequently observed in both groups. Valvular and irregular rhythm cardiac sounds were not misclassified as normal cardiac sounds in the intervention group.
Details regarding the answers during the cardiac auscultation.

Additional analysis of resident vs. attending performance are also shown in Table 5. In the intervention group, the percentages of total correct answers were not different between the attending physician and the resident (66.7% vs. 66.7%, P > .99). In the control group, the percentages of total correct answers were different between the attending physician and the resident (50% vs. 55.5%, P = .037) with the grouping variation (attending physician N = 1 vs. resident N = 11).
Cardiac sounds that were correctly identified between resident vs. attending physician.

Attending physician: years since obtaining a degree in Medicine ≧ 6 years.
Resident: years since obtaining a degree in Medicine ≦ 5 years.
Fisher exact test.
Power analysis revealed that the statistical power for comparison of total test score was 0.91.
Discussion
Principal results
In this research, there were several main findings. First, we indicated the utility of the phonocardiogram to improve the diagnostic accuracy of real-time remote auscultation with an internet-connected electronic stethoscope using a cardiology patient simulator. The phonocardiogram improved the total correct answer rate by more than 10%, although the difference was statistically insignificant. In remote auscultation, medical staff auscultate cardiac sounds with less information than conventional auscultation. Visual assistant tools, such as a phonocardiogram, would be one of the solutions to compensate for the weak points of remote auscultation that is associated with less medical information.
Second, the rate of correct answers for each sound in the intervention groups was statistically insignificant but was higher than that in the control groups, except for aortic stenosis. Additionally, the results of the intervention group were less diverse compared to that of the control group. In aortic stenosis, the maximal location was the second right sternal border in which medical staff auscultated first. 22 In the intervention group, the participants split their attention (and integrated the information) between auscultation and watching the phonocardiogram. The visual format of a phonocardiogram may allow the participant to utilize the working memory differently by restructuring the timing and frequency information between the audio and spatial information. 23 On the other hand, in the control group, the participants could concentrate their attention only on auscultation. This could have partly caused the rate of correct answers for aortic stenosis to be lower than that in the control groups.
Third, valvular and irregular rhythm cardiac sounds were not misclassified as normal cardiac sounds in the intervention group. The phonocardiogram would help medical staff screen the abnormal valvular and irregular rhythm sounds from normal cardiac sounds.
Limitations
First, this study was a pilot using a cardiac patient simulator. The duration since graduating from medicine school was not significantly different but doubled between two groups (5 vs. 2.5 years, P = .06). Although exploratory analysis revealed residents had a higher total correct rate than attending physicians in the control group, the grouping variation may have affected the detection power. Therefore, in the future, a full-sized study of real patients is essential. Second, in the intervention group, the optimal learning for the waveform of cardiac sounds was not known well. The phonocardiogram, spectrum and spectrogram of cardiac sounds are not familiar to physicians in usual clinical practice. Standardized tutorials or enough training sessions for the cardiac waveform would improve the diagnostic accuracy in the test session. Third, in this study, we assessed only cardiac sounds. In future studies, respiratory sounds 24 will also be evaluated with enough training sessions. Fourth, the responses may have had some in-participant dependencies. Fifth, there could have been some difference in the quality of sounds between the participants due to the difference of the position and pressure of the stethoscope. However, since we controlled the quality of the sounds by that the researcher auscultated the sounds simultaneously (Figure 1(a)), the effect of difference in the quality sounds could be minimized.
Comparison with prior work
From a previous work, 17 a phonocardiogram improved the diagnostic accuracy in the classical auscultation same as this study (11% vs. 11.7%). Although there was a difference in the study designs including the participants (medical students vs. physicians) and sound materials (14 cases vs. 10 cases), these results demonstrated that phonocardiograms could improve the diagnostic performance by more than 10% both in the classical auscultation and in the real-time remote auscultation.
From another previous work, 25 a phonocardiogram improved the diagnostic accuracy for detecting S3 in the classical auscultation by the experienced physicians (8–18%, P < .05). In this study the phonocardiogram improved the diagnostic accuracy for detecting S3 in the real-time remote auscultation by more than 20%, albeit statistically insignificant (P = .14). This inconsistency was partly due to a difference in the study designs, including auscultation style (classical vs. real-time remote auscultation), participants (experienced vs. physicians including resident), and sounds materials (patients with S3 and or S4 vs. cardiology patient simulator with the variety cardiac sounds).
Compared to classical auscultation,8,9 the total test score and correct answer percentage for each sound score of remote auscultation with a phonocardiogram were lower than the total test score (66.7% vs. 85–94%), normal cardiac sounds (45.8% vs. 92.9–100%), S3 (70.8% vs. 78.6–100%), aortic stenosis (66.7% vs. 90–100%), aortic regurgitation (83.3% vs. 90–92.9%), mitral regurgitation (70.8% vs. 82.1–90%), and mitral stenosis (41.7% vs. 50.0%), except atrial fibrillation (100% vs. 100%) of classical auscultation. In the future, it will be essential to develop higher quality internet connection or more sophisticated support tools, including phonocardiograms to improve real-time remote cardiac auscultation. Besides, remote auscultation with a phonocardiogram should be directly compared to classical auscultation in the future.
Compared to previous internet-connected remote auscultation, the total correct answer rate of real-time remote auscultation alone was lower in this study (66.7% vs. 72%). 9 The correct answer rates for normal cardiac sounds (41.7% vs. 90%), S3 (50% vs. 80%), aortic regurgitation (50% vs. 70%) and mitral regurgitation (58.3% vs. 70%) in this study were also lower than those in our previous study. However, the correct answer rates for aortic stenosis (91.7% vs. 50%) was higher than the previous rates. This may be by chance or have depended on the change in the auscultation style. The frequency of S3 was the lowest. 26 In the previous study, the participants auscultated through a noise-cancelling stereo headset, which could cover lower frequencies, compared to the 4 K TV screen's speaker in the current study.
Conclusions
The phonocardiogram in real-time remote cardiac auscultation using an internet-connected electronic stethoscope improved the total correct answer rate by more than 10%, although statistically insignificant. The phonocardiogram would also help medical staff screen abnormal valvular and irregular rhythm sounds from normal cardiac sounds. These systems are more sophisticated, can be enhanced by artificial intelligence, and facilitate the spread of high-quality telemedicine.
Footnotes
Acknowledgements
This study was made possible using resources from the Department of Diagnostic and Generalist Medicine, Dokkyo Medical University. Special thanks to Mr Yukio Hanatani, a chief executive officer, and Mr Hikari Nishida, a development chief in the department of club solutions, of the SMART GATE, Tokyo, Japan, who advised us to adjust the devices and an online medical care program.
Contributorship
TH and TI researched literature and conceived the study. TH was involved in protocol development, gaining ethical approval, participant recruitment and data analysis. TH wrote the first draft of the manuscript. All authors reviewed and edited the manuscript and approved the final version of the manuscript.
Declaration of conflicting interests
The author(s) declared no potential conflicts of interest with respect to the research, authorship, and/or publication of this article.
Funding
The author(s) disclosed receipt of the following financial support for the research, authorship, and/or publication of this article: This work was supported by JSPS KAKENHI [Grant Number 22K10421]; and the Dokkyo Medical Education & Research Foundation [Grant Number 202207].
Ethical approval
The ethics committee of Dokkyo Medical University Hospital approved this study (REC number: R-49-18J).
Guarantor
TH.