
Abstract
Introduction
This article was undertaken to explore the potential of AI in enhancing the diagnostic accuracy and efficiency in identifying hip fractures using X-ray radiographs. In the study, we trained three distinct deep learning models, and we utilized majority voting to evaluate their outcomes, aiming to yield the most reliable and precise diagnoses of hip fractures from X-ray radiographs.
Methods
An initial study was conducted of 10,849 AP pelvis X-rays obtained from five hospitals affiliated with Başkent University. Two expert orthopedic surgeons initially labeled 2,291 radiographs as fractures and 8,558 as non-fractures. The algorithm was trained on 6,943 (64%) radiographs, validated on 1,736 (16%) radiographs, and tested on 2,170 (20%) radiographs, ensuring an even distribution of fracture presence, age, and gender. We employed three advanced deep learning architectures, Xception (Model A), EfficientNet (Model B), and NfNet (Model C), with a final decision aggregated through a majority voting technique (Model D).
Results
For each model, we achieved the following metrics:
For Model A: F1 Score 0.895, Accuracy 0.956, Specificity 0.973, Sensitivity 0.893.
For Model B: F1 Score 0.900, Accuracy 0.960, Specificity 0.991, Sensitivity 0.845.
For Model C: F1 Score 0.919, Accuracy 0.966, Specificity 0.984, Sensitivity 0.899.
For Model D: F1 Score 0.929, Accuracy 0.971, Specificity 0.991, Sensitivity 0.897.
We concluded that Model D (majority voting) achieved the best results in terms of the F1 score, accuracy, and specificity values.
Conclusions
Our study demonstrates that the results obtained by aggregating the decisions of multiple models through voting, rather than relying solely on the decision of a single algorithm, are more consistent. The practical application of these algorithms will be difficult due to ethical, legal, and confidentiality issues, despite the theoretical success achieved. Developing successful algorithms and methodologies should not be viewed as the ultimate goal; it is important to understand how these algorithms will be used in real-life situations. In order to achieve more consistent results, feedback from clinical practice will be helpful.
Keywords
Introduction
The prevalence of osteoporosis is increasing rapidly due to an aging world population. 1 In parallel, risk factors for fractures are gradually increasing each year.1,2 According to 2019 data, the number of people treated for osteoporosis-related hip fractures in the USA was 300,000. Moreover, the cost of these treatments to US taxpayers was approximately 5.96 billion USD. 3 Among high-cost and complicated osteoporosis-related fractures, hip fractures account for 14% of all osteoporotic fractures. 4 However, such fractures account for approximately 72% of the total cost. 5 In addition, osteoporotic hip fractures represent 37% of moderate trauma costs, while the first-year mortality rate is approximately 27%. 5 This mortality rate is almost twice as high as in the general population. 6
The recommended radiographs include an anteroposterior pelvis, cross-table lateral, and full-length femur radiographs of the affected side. 7 Missed fractures or delayed diagnosis of fractures are the most common failures that are seen, and the percentage of these has been recorded as 2–10% in the literature. 8 The determination of fractures is proportionally related to personal experience. The difficulties in detection and diagnosis make the average time prior to operation almost 5 days, resulting in higher mortality and morbidity rates.9,10
In recent decades, advancements in artificial intelligence (AI) have significantly enhanced the capability to interpret medical images, providing substantial aid in diagnosing conditions such as osteoporosis-related fractures.11–13 The development of innovative algorithms and techniques has been central to achieving remarkable progress in the domain of medical image analysis. Despite the successful results obtained in theory, ethical and legal issues are a matter of serious debate. 14
The incorporation of such advanced algorithms, or the amalgamation of diverse technical support systems, can markedly augment diagnostic precision and dependability in clinical settings. Among the array of available algorithms, deep convolutional neural networks (DCNN) are particularly noteworthy. They excel in delineating patterns in images and videos, with their methodologies being inspired by the intricate neural configurations observed in the animal cortex. 15
Furthermore, artificial neural networks (ANNs) showcase extensive adaptability and versatility. They are instrumental in executing tasks related to natural language processing (NLP), anomaly detection, drug development research, and video analysis, thereby demonstrating their substantial relevance and utility across various scientific and technological domains.16,17 From radiologic modality in anatomical fields to disease detection, DCNN has been adapted and used successfully in various medical fields. In fracture determination, DCNN has a proven ability to detect fractures with expert-level accuracy. 18
Ensemble learning is a general approach to learning that aims to make better assumptions by evaluating predictions from multiple models. 19 The most commonly used ensemble learning methods are bagging, stacking, voting, and boosting. Voting is the simplest and the easiest of all these methods. In majority voting, the final tagging is chosen by voting from among the results predicted by each model. The majority voting technique has been used in many medical studies. A study by Chandra et al. used this method to combine predictions from five classifiers to detect COVID-19 in chest X-rays. 20 Naji et al. conducted another study of ensemble learning AI-based methods. 21 In their study, three different classifiers for breast cancer detection were used, and the majority voting technique then combined these three different classifiers’ assumptions to achieve the highest accuracy. 21 Another study by Assiri et al. evaluated the performances of hard and soft voting algorithms. 22 It aimed to classify breast tumors by combining three different classifiers. In addition, the study demonstrated the success of majority voting among all the methods applied in terms of predicting the correct results. 22
Our study aims to enhance performance of the model through the use of multi-centered extensive datasets, standing in contrast to the majority of literature which generally relies on limited data from a single center. Furthermore, by training proven DCNN architectures on this data and observing potential improvements in performance improvements as a result of the use of the majority voting technique, we hope to provide a novel contribution to the field.
This study is primarily motivated by the prospect of mitigating the inaccuracies of individual classifiers through the implementation of majority voting, leveraging advancements in deep learning methodologies to enhance the reliability and precision in diagnosing hip fractures. To achieve the research objective, three different CNN/DCNN architectures were selected and adapted for the study: EfficientNet, 23 Xception, 24 and NfNet. 25 These architectures have proved their success and have been discussed in the literature. The performance analysis of these architectures in terms of hip fracture classification was designed using different parameters and data augmentation techniques that trained the DCNN models.
In the current research, the fundamental aim was to demonstrate the efficacy of the majority voting in making the final decision by employing multiple algorithms instead of using them individually. Our study represents a pioneering effort in the field of AI-based hip fracture diagnosis within the existing literature. The key components of our investigation include:
Detailed explanation of the inclusion and exclusion criteria for graphs during the construction of the original dataset. Rationale behind the selection of the algorithms utilized in the study. Elucidation of the statistical methods employed in the research. Comparative analysis between the algorithms and the majority voting in the obtained results. In the discussion, we explain the difference of our study from similar studies. We also state its limitations. In the concluding section, we discuss the integration of AI studies into daily clinical practice.
The subsequent sections of the paper are structured as follows: section 2. covers the materials and methods, section 3. presents the results, section 4. discusses these, and section 5. provides some concluding remarks.
Methods and materials
Our methodology fundamentally consists of two main components: dataset preparation and model training. During the data collection process, anonymized radiographs and demographic information of patients from various hospitals were gathered. The radiographs of the selected patients were meticulously reviewed and chosen to represent a variety of hip fractures. In the model training phase, several convolutional neural network (CNN) models were developed and trained to accurately classify hip fractures. Subsequently, the outputs of these models were evaluated by the majority voting method to produce the final result (Figure 1). In the final subsection of our method section, the statistical methods we used to assess and compare model performances and accuracies are discussed.

General design of the study.
The study started by collecting data from hospitals, and the data to be included in the study were selected. These data were labeled by an expert orthopedist, and the data were divided into training, validation, and test sets. Three different CNN architectures were trained. The final AI algorithm included the majority voting ensemble method, which made decisions by considering these three models and their evaluations. This flow passed images to the algorithm, which produced a predicted result.
Patient selection
Five hospitals located in different cities were screened to obtain related datasets from 2010 to 2020 years. Datasets were created in these hospitals to increase the generalizability of the final model. Using multiple centers and a large number of images increased their scope and diversity. The purpose of training the model with diverse data from different centers was to enable it to more accurately interpret the different types of data it might encounter in real life. This approach enhanced the robustness of the model, encouraging it to produce more consistent results in various environments and conditions. A total of 19,583 AP pelvic X-rays were obtained from the picture archiving and communication system (PACS). Differences in the quality of images taken by different technicians were ignored in the overall study. The original images were saved in the DICOM (Digital Imaging and Communications in Medicine) format and converted into JPEGs before the labeling procedure. All patient information, including name, surname, patient ID, and date of birth, were anonymized.
In order to identify images to exclude, other labels, such as the scanning position of the X-ray (‘anteroposterior’ or ‘lateral’) and the presence of implants (‘presence’ or ‘absence’), were also employed. A total of 1,088 radiographs of patients under 16 years of age, 5,352 X-rays with implants in the X-ray area, and 2,664 X-rays that were taken from the side were excluded from the study using these labels. The remaining 10,849 radiographs from the five different centers were used in the study. Table 1 shows the demographic information of the patients whose X-rays were included.
Demographic distribution of patients from five different hospitals used as data centers.

Considering the information received from the anamneses and the International Classification of Disease Version 11 (ICD-11) codes of these patients (s72.0, s72.1, s72.3, and s72.4), 2291 radiographs with proximal femur fracture were labeled as a fracture (+), while the remaining 8558 radiographs were labeled as a fracture (–). Patients diagnosed with proximal femur fracture from the ICD-11 and from their patient files (s72.0, s72.1, s72.3, and s72.4), and patients who had received surgical intervention are assigned as fracture (+). Two expert orthopedic surgeons with access to the patient files checked and re-labeled all the radiographs. The presence of fracture was tagged as fracture (+), and the absence of fracture was tagged as fracture (–).
The X-ray images were split into three different groups: the training group (randomized 64%), the validation group (16%), and the test group (20%). In splitting our dataset into three parts, we carefully utilized the stratification method to ensure an equal percentage of fracture radiographs in each segment. This stratification ensured a consistent distribution of fracture graphs in the training, validation, and testing sets. This consistency helped ensure that the information the model learned about fractures during training remained valid in the other sets. Preventing leakage and overlap between the training, validation, and test datasets was accomplished by giving a unique ID to each patient and not placing the same patient's radiographs in different datasets. Figure 2 shows the steps taken to create the datasets.
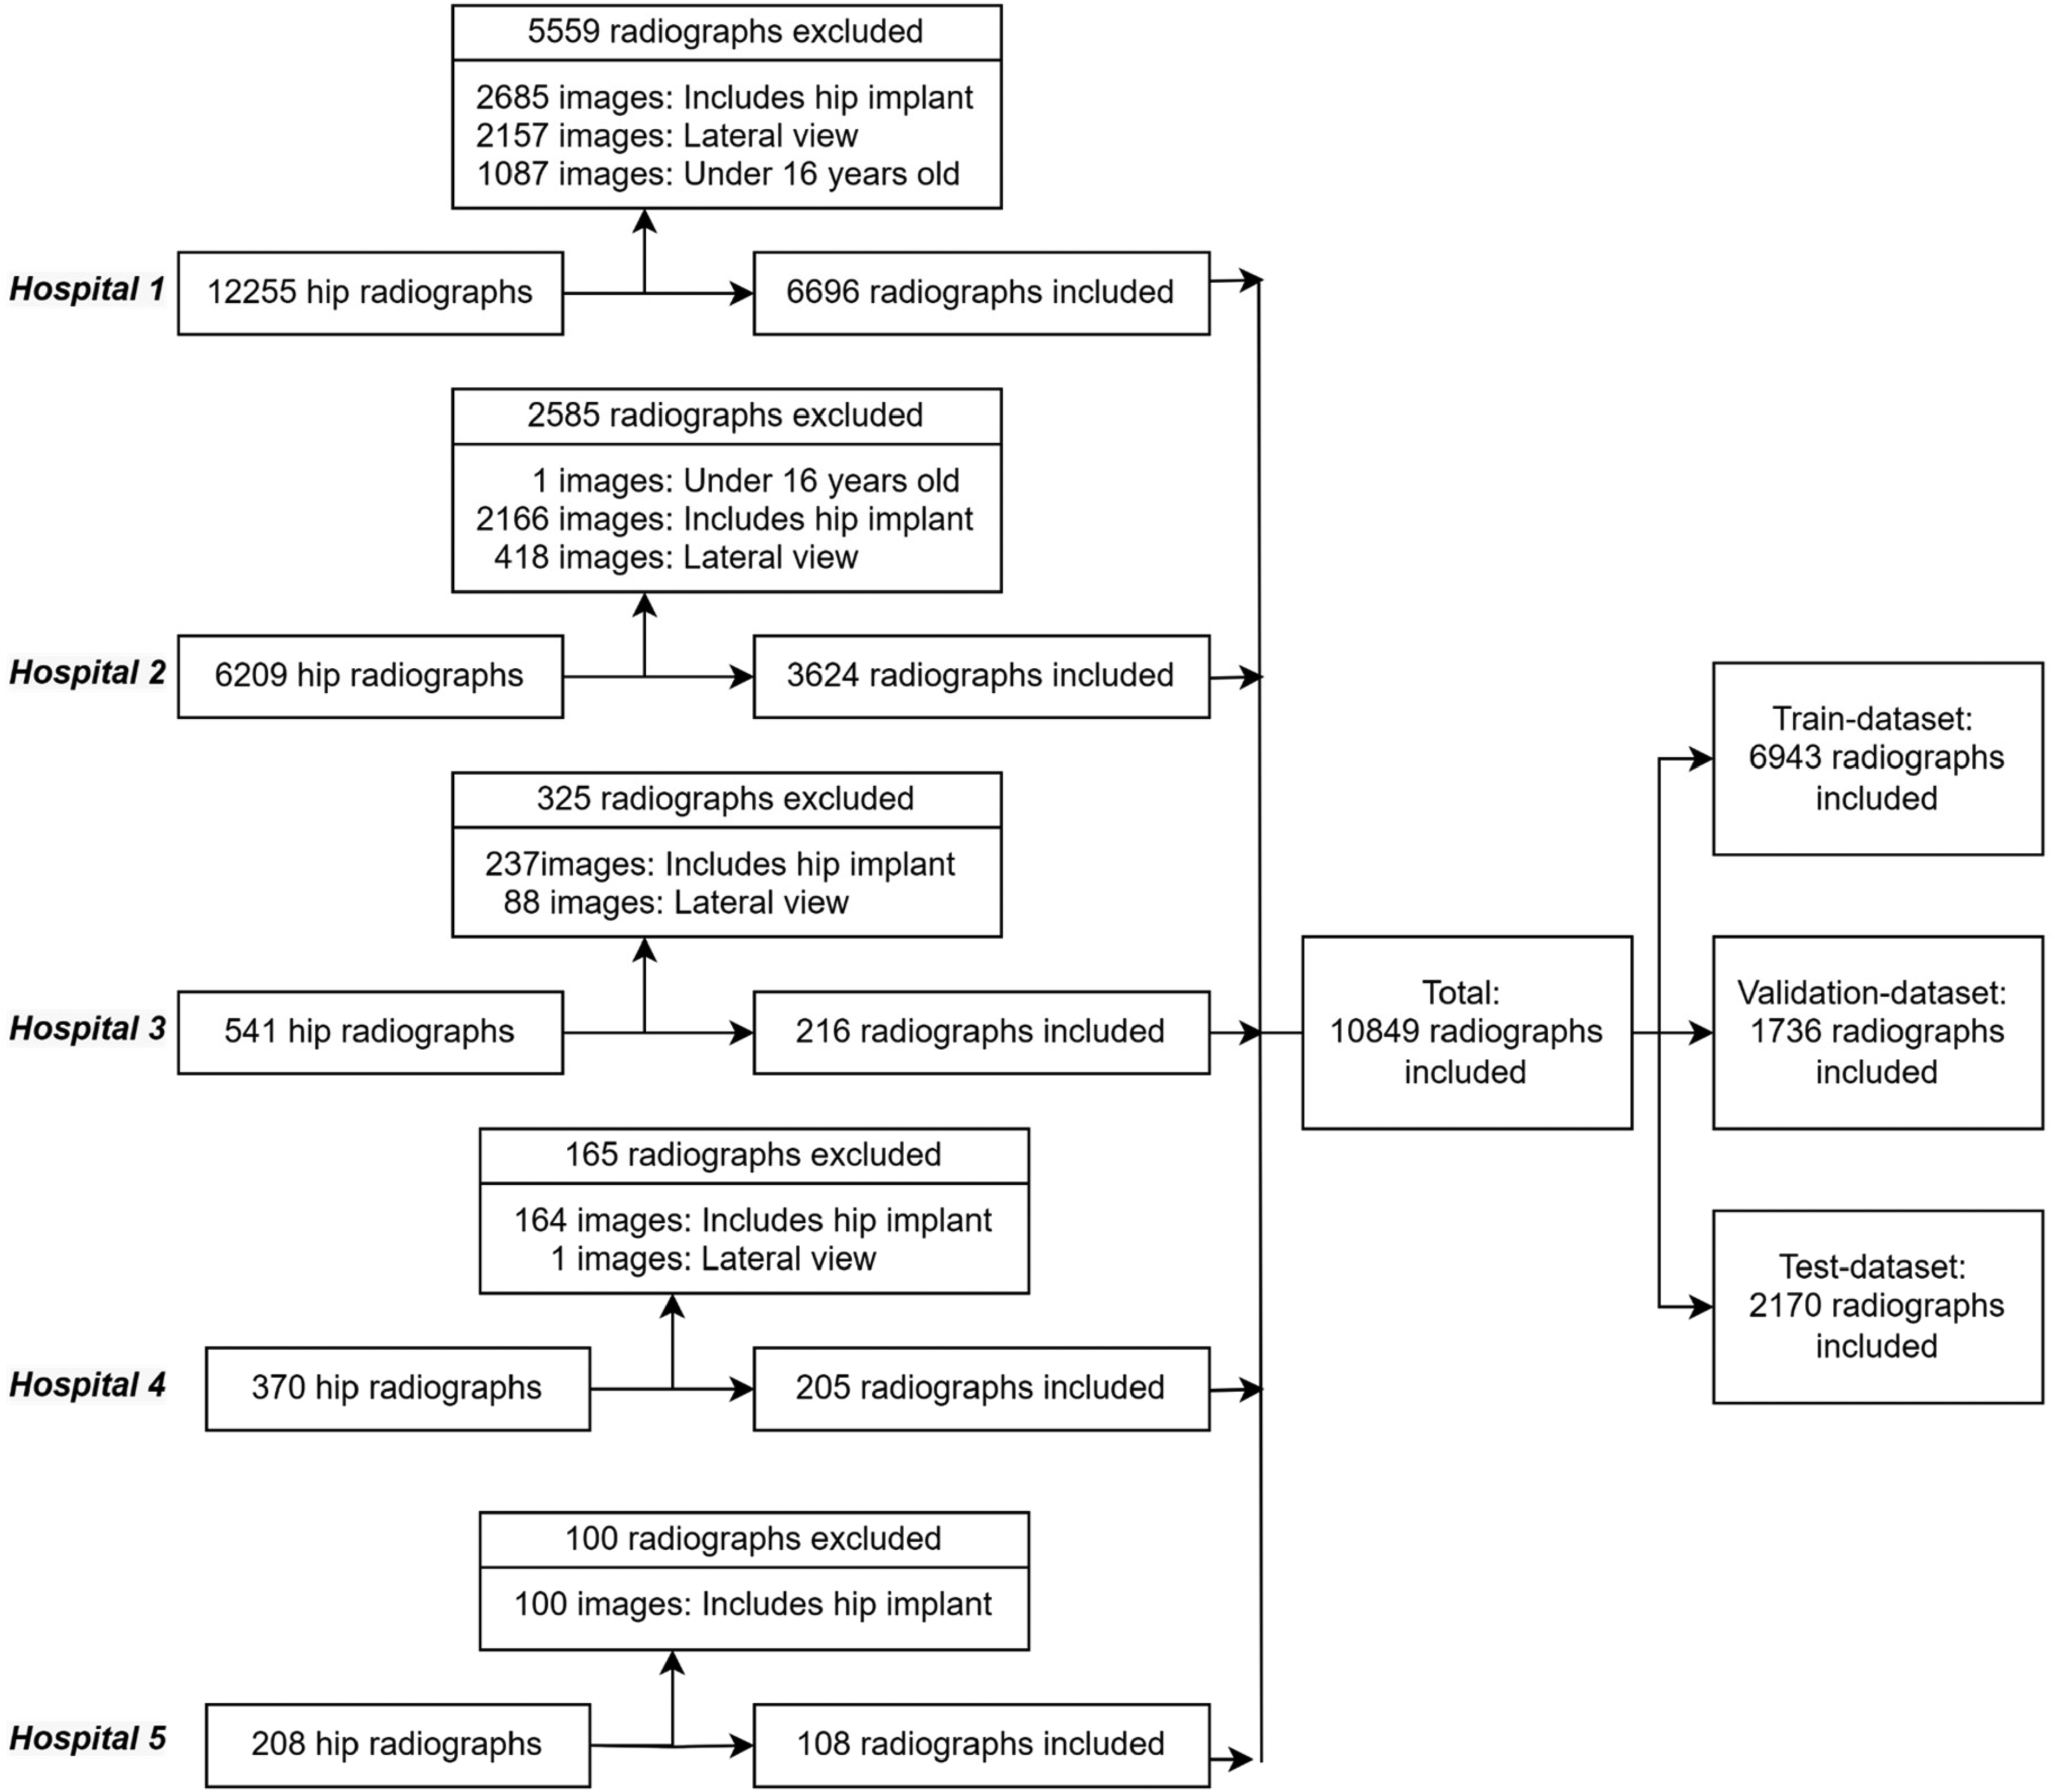
Overall methodology applied in the proximal femur fracture data selection for the model trainings.
Model selection
ImageNet is an image dataset with over 15 million labeled samples and approximately 22,000 categories. The ImageNet Large Scale Visual Recognition Challenge (ILSVRC) uses a subset of ImageNet of approximately 1,000 images in each of 1,000 categories. There are roughly 1.3 million training images, 50,000 validation images, and 100,000 test images. We selected the Xception, EfficientNet, and NfNet models as transfer learning approaches due to their outstanding performance on the ILSVRC and their different architectural features. 25
The Xception Network is a convolutional neuronal network (CNN) involving depth-wise separable convolutions. Xception is an effective architecture that relies on two basic points: depth-wise separable convolution and shortcuts between convolution blocks. EfficientNet enables the scaling method to determine all scales with depth/width/resolution dimensions with a fixed set of scaling coefficients. Instead of the Rectified Linear Unit (ReLU) activation function, EfficientNet uses a new activation function called Swish. EfficientNet-B7 achieves 97.1% top 5 accuracy on ILSVRC while being smaller and faster. NfNet has an architecture without a normalization layer, considering the disadvantages of batch normalization due to its dependency on batch size and interaction between samples. It proposes an adaptive gradient clipping technique for successfully training CNNs that do not contain a normalization layer. Smaller models of NfNet match the test accuracy of EfficientNet-B7 on the ILSRVC.
This study used Xception, EfficientNet, and NfNet architectures due to their success on the ILSRCV in a proposed ensemble learning-based hip fracture classifier method. Other important points in choosing these three architectures were:
Xception includes depth-wise separable convolution layers. EfficientNet's use of a swish activation function is unlike any others. NfNet is a sample of a normalizer-free architecture.
Using ensemble learning, a class of machine learning based on three CNN architectures, this study identified image patterns using neural networks. Xception, EfficientNet, and NfNet were used as the selected models in the majority voting method. Figure 3 demonstrates the final decision or predicted result processing using the concept of majority voting.
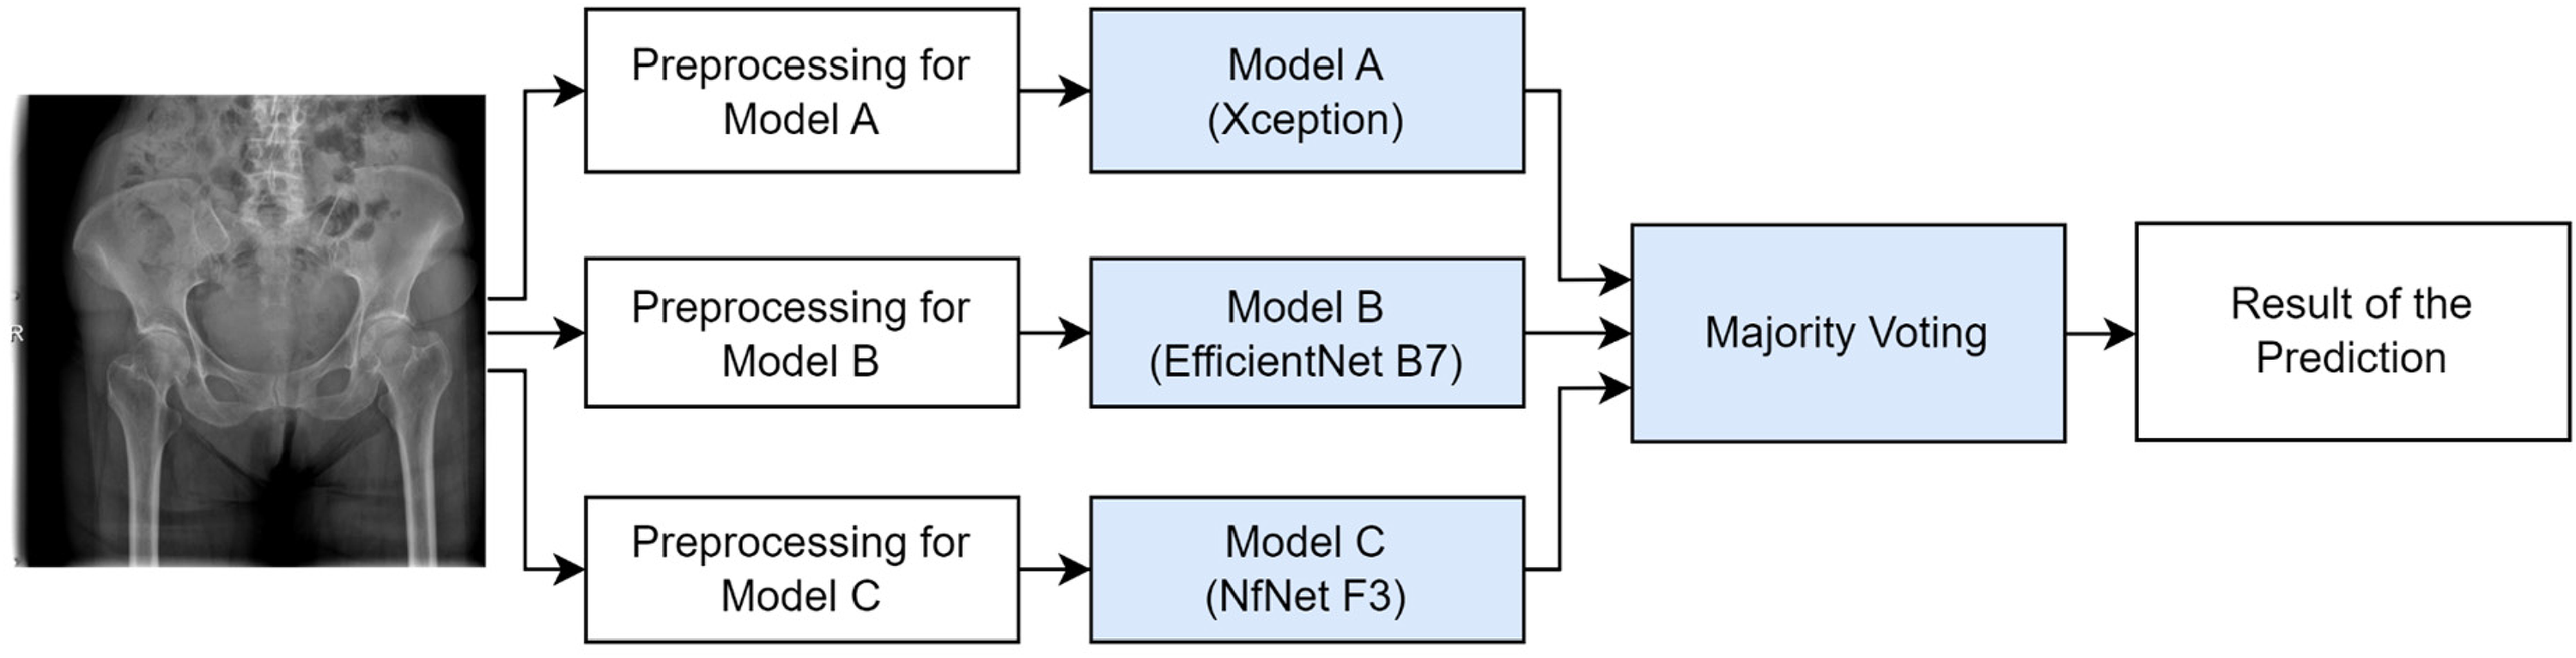
Diagram of majority voting for the final prediction.
Statistical analysis
In evaluating our models’ performance, the primary metrics considered were accuracy, sensitivity, specificity, and F1 score. These metrics provided the initial insights into how each model performed on the test dataset.
Given the importance of understanding the differences in the models’ predictions, we first employed the McNemar test. This statistical test was designed in order to compare the paired predictions of models, and we conducted a total of six distinct pairwise comparisons: Model A–B, Model A–C, Model A–D, Model B–C, Model B–D, and Model C–D. Recognizing the multiplicity challenges arising from these pairwise comparisons, it was deemed essential to use Bonferroni correction. By adjusting the standard significance level of 0.05 based on the number of tests (six in this instance), the revised significance threshold was calculated as 0.0083.
To further clarify the underlying differences in performance among the models, the Friedman test was employed. This test served to determine if there were any statistically significant discrepancies in the models’ performances. Following the Friedman test, the Nemenyi post-hoc test was carried out to pinpoint which models demonstrated significant disparities in their performances relative to each other.
Results
The experimental approach of our study was bifurcated into two main stages. In the first stage, we used three well-established CNN image classification architectures (Xception, EfficientNet-B7, and NfNet-F3 networks) for the purpose of detecting hip fractures. Following this, the second stage incorporated an ensemble learning strategy, the majority voting, that drew upon the probability values derived from the trained CNN models to ascertain the final fracture outcomes. This two-stage methodology formed the basis of our decision-making process in identifying fractures.
Development of the models
In our study, we used the transfer learning technique for training all the image classification models. Xception, EfficientNet-B7, and NfNet-F3 were named Model A, Model B, and Model C, respectively. The initial weights of these models were adopted from their training on the ImageNet dataset. For the training and validation phases, we utilized 6,943 and 1,736 images, respectively, while 2170 images from the test dataset were used for evaluation. Notably, an imbalance was observed in the distribution of images labeled as fracture and non-fracture during the preparation of the dataset. To maintain balance during training, a weighted loss strategy was implemented.
The input image sizes for each model were maintained as per the pre-trained models: 500 × 500, 600 × 600, and 320 × 320 pixels for Models A, B, and C, respectively. For Model A, only the layers beyond the initial 150 were trained, while for Models B and C, all layers were subjected to training without being frozen. Cross-entropy loss was utilized in the training of all the models. Table 2 outlines the augmentations applied for each model trained, complemented by the corresponding data augmentation strategies and respective data augmentation parameters (DAP). The implications of the augmentation techniques in terms of a representative radiograph image are shown in Figure 4.

Radiographs reproduced by augmentation techniques applied during model training.
The techniques used for augmentation and the values of their parameters applied for Model A, Model B, and Model C.
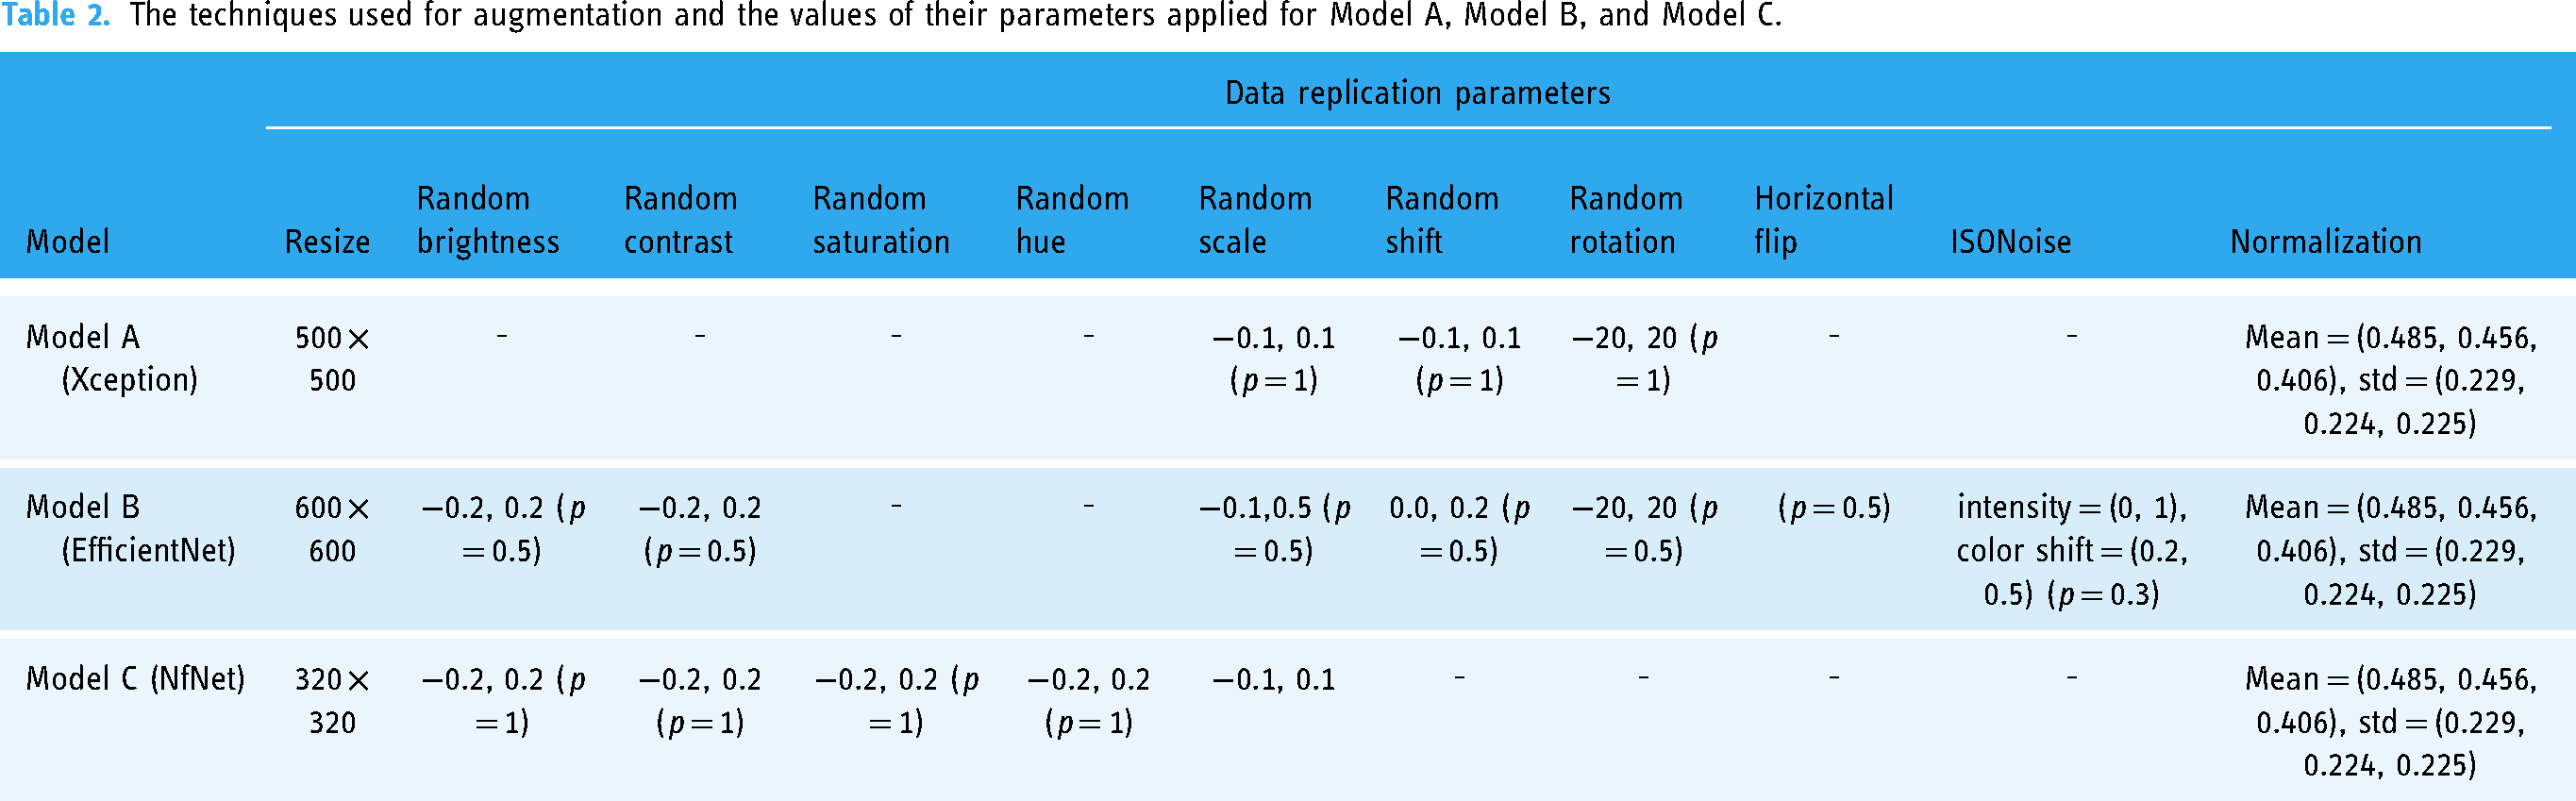
Table 3 presents the detailed training parameters for each model. Model A, employing the Xception architecture, was trained using the TensorFlow framework. Over 150 epochs, it employed the Nadam optimizer with a learning rate of 0.0001, utilizing the cross-entropy (CE) loss function. Conversely, Model B, based on the EfficientNet architecture, was trained within the PyTorch framework and underwent an identical 150 epochs. Notably, this model employed the Adam optimizer with a learning rate of 0.001 yet maintained cross-entropy (CE) as its loss metric. Model C, built upon the NfNet architecture, was similarly trained using the PyTorch framework for 150 epochs. It was distinctive in utilizing the Stochastic Gradient Descent (SGD) optimizer with a learning rate of 0.0001 and continued the trend of employing cross-entropy (CE) as the loss function.
Training parameters for model A, model B, and model C. (SGD: Stochastic Gradient Descent, CE: Cross-Entropy Loss).

To compensate for potential misjudgments or errors from individual models, Model D was designed by integrating the outputs of Models A, B, and C using the majority voting. This approach ensured that any decision made by Model D was backed by a consensus of at least two of the three contributing models. In essence, if a proximal femur fracture was detected by Model D, it required the confirmation from at least two of the three models, A, B, and C.
Performance analysis of the models
In evaluating the average image prediction times for Models A, B, and C, it was observed that the respective times on the CPU were approximately 1.65, 6.14, and 2.01 s. On the GPU device utilized during the model training phase, they predicted in 0.26, 0.11, and 0.16 s, respectively.
The models, once trained, were evaluated on a test dataset, with performance metrics including sensitivity, specificity, accuracy, and F1 score computed for each. Models A, B, C, and D attained F1 scores of 0.895, 0.900, 0.919, and 0.929, respectively. When benchmarked against the other models, Model D outperformed them, securing the highest position for the F1 score, specificity, and accuracy metrics. Detailed metrics for each model can be found in Table 4, and a visual representation of these is given in Figure 5. Additionally, Figure 5 displays the confusion matrices for each model, providing insight into their performance. These matrices in Figure 5 clearly differentiate between ‘non-fractured’ and ‘fractured’ predictions, crucial for understanding the nuances of each model's accuracy and reliability.

Confusion matrices for Model A, Model B, Model C, and Model D. Each subplot represents correct and incorrect model predictions, distinguishing between ‘non-fractured’ and ‘fractured’. The numbers of samples falling into each category are shown in the squares. These matrices are crucial for evaluating the accuracy and performance of the model.
Trained models (Models A, B, and C) and the latest ensemble model (Model D) test dataset results.

In our enhanced analysis, Figure 6(a) provides a detailed visualization of the ROC curves for all three models, illustrating the trade-off between their true-positive and false-positive rates. Similarly, Figure 6(b) presents a thorough depiction of the precision-recall curves, emphasizing the interplay between the models’ precision and recall strengths.

(a) ROC curves of each model. (b) Precision-recall curves of each model.
We sought to understand the decision-making processes of the models in more detail through the Grad-CAM technique. Grad-CAM results of Model A vividly demonstrated how the network locates fractures in proximal femur radiographs (Figure 7).

X-rays with proximal femur fractures detected and determined by Grad-CAM technique, showing targeted areas in the fracture regions in a reddish color through specified imaging.
Advanced statistical comparison of models
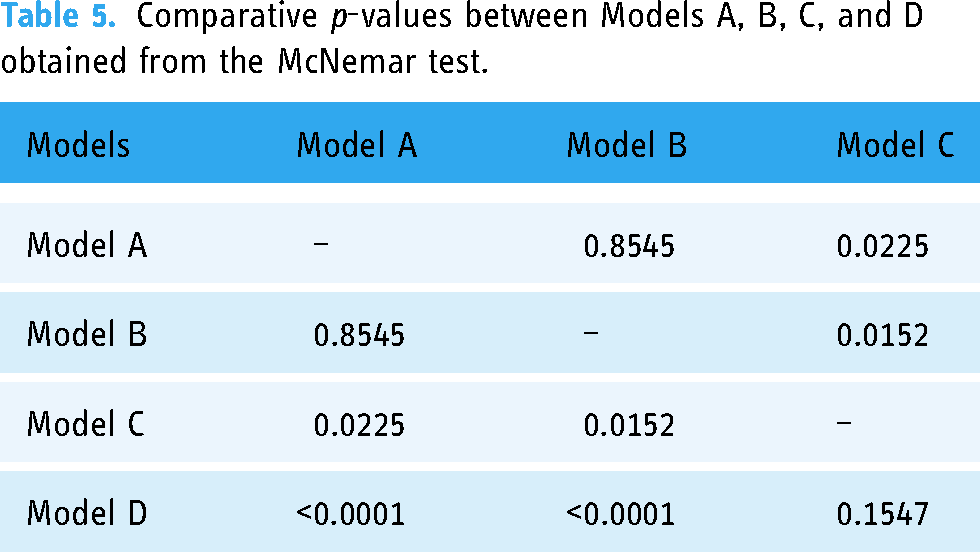
Having assessed the performance metrics based on the F1 score, sensitivity, specificity, and accuracy rankings, it was essential to utilize statistical tests to further validate these observed differences. To evaluate our models, we used the McNemar test, ideal for paired nominal data, allowing us to more clearly discern variations in performance. Table 5 encapsulates these findings by presenting the comparative p-values and unveiling the distinctions between the models. According to the test results:
There was no statistically significant difference in performance between Model A and Model B (p = 0.8545). Statistically significant differences in performance were identified between Model A and Model C (p = 0.0225) and between Model B and Model C (p = 0.0152). Pronounced differences were found between Model D and both Model A (p < 0.0001) and Model B (p < 0.0001). However, there was no statistically significant difference between Model C and Model D (p = 0.1547).
Comparative p-values between Models A, B, C, and D obtained from the McNemar test.
After conducting the McNemar test to initially gauge differences between pairs of models, we sought to determine if there were overall performance disparities when considering all models collectively. Hence, we employed the Friedman test. The result of the Friedman test (p = 0.0000355736) confirmed that there were generally statistically significant performance differences among the models. To further elucidate which models significantly differed from each other in their performances and to perform pairwise comparisons, the Nemenyi post-hoc test was conducted. According to the results of the Nemenyi post-hoc test:
Model A's performance was 90% similar to Model B's, 90% similar to Model C's, and 84.96% similar to Model D's. Model B's performance was 90% similar to Model C's and 80.9965% similar to Model D's. Model C's performance was 90% similar to Model D's. Their sensitivity values were very close to each other, indicating that both models were almost equally adept at identifying true cases of the condition they were trained to detect. The specificity value was higher in Model D. The accuracy rate was higher in Model D. The F1 score was higher in Model D, suggesting that Model D provided a more balanced performance across sensitivity, specificity, accuracy, and F1 score, excelling consistently in all metrics evaluated.
After identifying statistically significant differences among the models using the Friedman test and further clarifying these differences with the Nemenyi post-hoc test, we observed that Model D was significantly different from Models A and B. However, its difference from Model C was less pronounced. Given these outcomes, it was then paramount to further explore the comparative performances of Models C and D. This would help in understanding their relative merits and how they might function in practical scenarios. With regard to the performance metrics of Models C and D:
In the comparative analysis of the models, Model D, employing the majority voting, displayed evident superiority in performance metrics over Model A and Model B, with statistically significant differences. This superiority illustrates that leveraging the collective intelligence of multiple models can overcome the errors or biases inherent in individual models, contributing to enhanced accuracy in decision-making processes. When compared to Model C, Model D exhibited a slight, yet noteworthy, improvement in performance. Although the differences were not statistically significant, Model D demonstrated a more balanced and comprehensive performance, indicating the effectiveness of the ensemble approach in transcending the limitations encountered by the individual models.
Discussion
In the present study, we used a unique dataset that we obtained and labeled from five different hospitals. We trained three different models using this dataset, using the three most well-known architectures in the field of medical image processing. We used the majority voting for the outcome decision. We compared our final model with each model in terms of F1 score, sensitivity, specificity, and accuracy. We found that the majority voting achieved the highest F1 score value of 0.929. This study is the first in the literature in which the majority voting was used in the diagnosis of hip fracture. This study suggests that majority voting is a useful and reliable method for diagnosing hip fracture. Further research is needed to confirm these findings.
Goa et al., 18 using 40,203 radiographs obtained from a single center achieved a 94.2% susceptibility content and a specification of 96.3% with block fracture identification algorithms trained using the DenseNet-121 architecture. It was observed that racial differences did not affect the algorithm's success. However, radiographs were used that had been obtained from two different radiography machines made by a single efficient radiological device manufacturer. When the dataset used in AI-based medical image processing studies has a different scope and is obtained from a number of different hospitals, this means that the results are more applicable in daily life scenarios. This was the justification for using records obtained from different hospitals and different devices in the present study.
Liu et al. 26 developed a model using the faster RCNN algorithm with 700 (459 fractures (+) and 241 fractures (–) pelvic X-rays obtained from five different centers. With this model, they only aimed to describe intertrochanteric hip fractures. They found that the algorithm had an accuracy of 0.88, a specificity of 0.87, and a sensitivity of 0.89. They compared the algorithm developed with the judgments of orthopedists and found that it consistently provided results that were at least as good as an orthopedic specialist, in a statistically significant (p < 0.001) shorter time. In daily practice, the most common diagnosis of neck fractures is that they are femoral neck fractures rather than intertrochanteric femur fractures, which are caused by larger problems. For this reason, we included all proximal femur fractures in our study.
Twinpari et al. 27 categorized 450 out of 900 AP pelvis radiographs, obtained from a single center, as positive for fractures, and further subdivided them into three groups: femoral neck, intertrochanteric hip, and subtrochanteric hip fractures, aiming to refine both diagnosis and treatment procedures. They employed the You-Only-Look-Once (YOLO-v4) architecture, a form of DCNN, and achieved a sensitivity of 96.2%, specificity of 94.6%, and accuracy of 95% during their assessment of 100 test radiographs, 50 of which were fracture-positive. Their findings led them to conclude that the model they had developed significantly enhanced the average diagnostic sensitivity for hip fractures among physicians of various specializations, raising it from 69.2% to 96.2%.
The success of the majority voting in our study echoes broader trends in machine learning, where ensemble methods often outperform individual models, especially in tasks with high stakes and narrow error margins, such as medical diagnoses. As medical imaging becomes more reliant on AI, methods like these will be invaluable in ensuring the highest level of accuracy and patient safety.
Compared to studies conducted for similar purposes, the biggest differences of the present study are that the dataset was created with a high number of images from multiple centers and that the final decision was made by voting on the decisions made by three different models. In the current literature, most studies on the diagnosis of hip fractures and prediction of postoperative outcomes have generally focused on a specific algorithm or a limited dataset. Similar studies and their results are given in Table 6. Nevertheless, our approach aimed to fill the existing gaps in the literature in this area. In line with this goal, our study makes two main contributions:
Multi-center large dataset: Different from studies conducted with limited radiographs or patient information, which are frequently encountered in the literature, we performed our analyses on a much larger dataset collected from multiple centers. Multiple AI model: Instead of focusing on just one algorithm, we aimed to achieve a more comprehensive and effective classification performance by combining the outputs of more than one model through Model D, which applied majority voting.
Methods and results of algorithms similar to our study developed for fracture identification.

In our study, we did not compare our algorithm with the work of doctors. Our rationale for not doing so was that we have divided our study into two parts: the technical and the clinical. In this article, our aim was to provide all the technical details of the development of the algorithm and discuss them thoroughly. The clinical study focuses on the practical applicability of the algorithm in daily practice rather than technical details. Assessing the success of a model through real-world tests is a pivotal aspect of AI research. It is imperative that additional radiographic and clinical evaluations be carried out to bolster the validity and reliability of our models. These evaluations are necessary to gain a deeper insight into our models’ adaptability and effectiveness across various clinical scenarios. In line with this, a clinical validation study is planned, comparing the performance of our algorithm with those of 15 doctors from different specialties. This study will employ a dataset comprised of 724 X-rays.
Limitations
The present study, despite its significant results, has several limitations:
We did not include hip lateral radiographs in our study. The reason for this was that a significant portion of hip fractures can only be identified in the anteroposterior (AP) view. The focus of the study was on data obtained from a single imaging plane. We did not proceed with subgrouping (femur neck, intertrochanteric, subtrochanteric) for the radiographs with hip fractures because our primary objective was the detection of hip fractures. Subgrouping is significant for treatment planning, but our primary focus was on the identification of hip fractures. We excluded radiographs with implants in the proximal femur. This decision was based on the consideration that radiographs containing implants due to prior surgery in the proximal femur could adversely affect the accuracy of our results. However, we acknowledge that this exclusion may have had a negative impact on the comprehensiveness of the study. Given the ‘black box’ nature of CNNs, our model only classified an image without providing specific feature definitions or fracture localization. Segmentation-oriented AI models could offer this localization. We trained our model with the entire radiographic image, rather than using images cropped around the proximal femur, which prevented us from differentiating between the left and right sides in our interpretations. Due to the limited number of non-displaced radiographs, they were not incorporated into our dataset. Since the fracture lines in these images are not as pronounced as those in displaced fractures, a model trained with a dataset enriched with such radiographs would be able interpret these radiographs.
Conclusion
This research illustrates the profound impact of the majority vote ensemble method in improving diagnostic accuracy in hip fracture detection, by synergizing the capabilities of state-of-the-art CNN-based models, Xception, EfficientNet, and NfNet, all trained on an expert-labeled, multi-center dataset. This multifaceted approach not only aligns pioneering AI models with medical diagnostics, achieving a notable F1 score of 0.93, but also introduces innovative methodologies to refine precision and minimize inaccuracies in medical imaging.
Despite promising advancements, the wider adoption of AI-based decision support systems in clinical settings remains a subject of extensive discussion due to prevailing concerns related to data imbalance, security vulnerabilities, ethical constraints, and legal frameworks. Recognizing these challenges, our subsequent research endeavors will contrast the performance of our algorithm with evaluations from medical professionals to gain broader and more comprehensive insights into the practical, ethical, and societal implications. This approach will ensure a holistic examination of both the technical and ethical dimensions of integrating AI into healthcare.
The realization of AI's potential to support clinicians necessitates the development of user-friendly interfaces and strong data transmission protocols. Addressing these prerequisites is crucial for the seamless, secure, and efficient integration of AI innovations into existing clinical workflows. The transformation of such advanced systems from academic advancements to tangible clinical applications is pivotal for the progression of medical diagnostics, necessitating a thorough exploration of both technological and ethical considerations.
The results of our study suggest that the implementation of majority voting can significantly enhance model performance, offering notable improvements over relying solely on the outputs of individual models. It is our hope that integrating these insights will enrich the existing body of knowledge in the field and catalyze further advancements in patient care and medical interventions.
Footnotes
Declaration of conflicting interests
Within the scope of the study, all data were anonymized and no personal information of the patients was processed. Therefore, written consent was not sought from the patients. These details are also included in the ethics committee application document. Ethics committee approval was received under these conditions. Associate Professor Dr. Salih Beyaz works as an academic consultant and project manager for Turkcell Technology Artificial Intelligence and Analytics Department..
Funding
The authors disclosed receipt of the following financial support for the research, authorship, and/or publication of this article: This study was approved by the Institutional Review Board of Başkent University (Project Number KA20/126) and supported by the Başkent University Research Fund and Turkcell Technology Research Fund (Grant number 495212).