
Abstract
Objective
The coronavirus disease 2019 (COVID-19) pandemic is among the most critical public health problems worldwide in the last three years. We tried to investigate changes in factors between pre- and early stages of the COVID-19 pandemic.
Methods
The data of 457,309 participants from the 2019 and 2020 Community Health Survey were examined. Four mental health-related variables were selected for examination as a dependent variable (patient health questionnaire-9, depression, stress, and sleep time). Other variables without the aforementioned four variables were split into three groups based on the coefficient values of lasso and ridge regression models. The importance of each variable was calculated and compared using feature importance values obtained from three machine learning algorithms.
Results
Psychiatric and sociodemographic variables were identified, both during the pre- and early pandemic periods. In contrast, during the early pandemic period, average sleep time variables ranked the highest with the dependent variables regarding the experience of depression. The difference in sleep time before and after the pandemic was validated by the results of paired t-tests, which were statistically significant (p-value < 0.05).
Conclusions
Changes in the importance of mental health factors in the early pandemic period in South Korea were identified. For each mental health-dependent variable, average sleep time, experience of depression, and experience of accidents or addictions were found to be the most important factors. House type and type of residence were also found in regions with larger populations and a higher number of confirmed cases.
Introduction
In the last three years, the coronavirus disease 2019 (COVID-19) pandemic has impacted global public health with rapid changes in both medical practices and society's daily life.1–3 To investigate the impacts of the pandemic, many researchers have attempted to analyze variations in related phenomena in diverse domains. Olszewska-Guizzo et al. 4 compared hemodynamic responses in urban spaces with lockdowns during the pandemic to verify the effects of changes in the environment. Almeida et al. 5 examined the effect of the pandemic on women's mental health. Furthermore, Xiong et al. 6 systematically reviewed relevant literature on the effects of COVID-19 on psychological outcomes and associated risk factors.
In various studies, including those mentioned above, researchers focused on mental health-related issues resulting from COVID-19 to identify the relationship between the pandemic and mental health among diverse research topics. Bojdani et al. 7 proposed novel guidelines for psychiatric care in the United States. They suggested a role for policymakers in the healthcare system that goes beyond care guidelines. Wang et al. 8 found the potential for negative psychological and social effects resulting from quarantines and isolation in China. Furthermore, researchers have investigated the multifactorial impacts of COVID-19 in terms of biological, environmental, and social aspects. 9 Particularly, researchers have found that as a stressor, the COVID-19 pandemic can trigger neuropsychiatric outcomes (e.g. neuroinflammation and behavioral impairment) in adults. In addition, O’Connor et al. 10 traced adult groups living in the United Kingdom to determine the trajectory of mental health and well-being in the first six weeks of lockdown; it was confirmed that the rate of suicidal thoughts increased over time.
Various factors associated with mental health in a pandemic have already been proven in previous studies. De Figueiredo et al. 11 examined a multifactorial influence of COVID-19 on children and adolescent populations. Possibilities of stressors in a pandemic to neuroinflammation and behavioral impairments were proven in their analysis results. Wu et al. 12 verified that good marital relationships and social support should be checked to investigate the mental health status in the students’ parents population during the COVID-19 pandemic. Magson et al. 13 found that policies concerning government restrictions and concerns about the spread of the virus were associated with increased anxiety, symptoms of depression, and decreased life satisfaction. Furthermore, Blix et al. 14 confirmed the relationship between higher levels of COVID-related worry and higher psychological stress in the general Norwegian population.
To validate the effectiveness of factors, the periods of the pandemic were considered as important criteria in the study design of previous studies. Kwong et al. 15 separated the duration of follow-up for comparison between the pre- and post-pandemic periods. Based on their experimental results, the authors provided initial indications of anxiety and depression in the younger population. Ravens-Sieberer et al. 16 conducted a nationwide survey involving two successive waves during the pandemic to investigate longitudinal changes in mental health and identify risk and resource factors.
Multiple variables from large-scale datasets have been analyzed to identify complex associations between mental health and factors from the pandemic. Diverse methodologies, including the use of statistical models and tests, have also been applied to analyze large-scale and longitudinal datasets. Wang et al. 17 used Bayesian generalized compartmental models to determine the effects of public health interventions on hospitals during the pandemic. Recently, machine learning (ML) and deep learning models have been widely used to examine the latent patterns in datasets. According to these trends, some researchers have applied ML algorithms to datasets to validate their research hypotheses. Khattar et al. 18 selected an ML approach to analyze the effects of the pandemic on the mental health of young Indian students. During a period of lockdown, feelings of frustration, crushing boredom, and anxiousness were highlighted, which were identified through topic modeling. In addition, Rezapour and Hansen 19 examined important factors for predicting mental health decline in frontline worker groups using ML algorithms. They found that the amount of sleep individuals had and the amount of COVID-19-related news they were exposed to were related to individuals’ mental health status.
Based on the aforementioned studies, in this study, we attempted to investigate variations of associated factors between the pre- and early pandemic periods using ML algorithms. To confirm the effects of the pandemic on the importance of these factors, 2019 and 2020 datasets were used from a longitudinal survey dataset collected from 2008 to 2020 in South Korea. Moreover, we included as many variables as possible, including psychiatric and socioeconomic variables, to analyze from various perspectives. The datasets were divided by the 16 regions of South Korea to reflect additional information such as population density or the number of confirmed cases. Furthermore, we split variables into three groups based on the magnitude of the coefficient from the lasso and ridge regression model to interpret the relative importance of each variable in the group in detail. Finally, the feature importance of variables from the trained ML algorithms was checked to compare relative importance. The overall scheme of the study design is shown in Figure 1.

Study design.
Methods
Data source
We used the open-source Community Health Survey (CHS) dataset in this study. This dataset was released by the Korea Disease Control and Prevention Agency (KDCA)20,21 to compare mental health factors during the pre- and early pandemic periods in South Korea. The CHS investigates the health status of people living in various regions of Korea through longitudinal surveys. It has been conducted annually by the KDCA since 2008. In total, 228,303 respondents participated in the survey from 2008 to 2020. The CHS dataset was composed by using 49 categories of survey variables. Detailed categories of variables are listed in Table 1.
Variable categories of the CHS dataset.

CHS: Community Health Survey; AIDS: acquired immune deficiency syndrome.
Moreover, we used additional public datasets on population density and the number of confirmed cases of COVID-19 released by the Korean Statistical Information Service to investigate the influence of population and COVID-19 severity in the region.
Preprocessing
Selection of associated variables from datasets
We used two datasets (2019 and 2020) to check for changes in important factors after the pandemic. The 2019 dataset was utilized to identify variations in the pre-pandemic period. Similarly, the 2020 dataset was used for a comparison between the early and pre-pandemic periods. To consider as many variables as possible in our analysis, we selected common variables across the two datasets (without excluding variables in specific categories). A total of 49 common variables distributed across 17 categories were selected. After the selection of the common variables, the dimension of the 2019 dataset was (228,040, 49) and that of the 2020 dataset was (229,269, 49). Detailed descriptions of the selected 49 variables are presented in Table 2.
Detailed descriptions of the selected 49 variables.

Exclusion of missing and extreme data
The distribution of each variable was checked to remove extreme and missing values from the dataset. Missing or non-response values were coded as 9 or 7 in the CHS dataset. To reflect the exact responses of the participants in our analysis, the distributions of the variables were investigated using histograms. After removing data with outliers or missing values, the dimension of the 2019 dataset was (202,767, 49) and that of the 2020 dataset was (197,750, 49). The distributions of the variables in this study are shown in Figure 2.
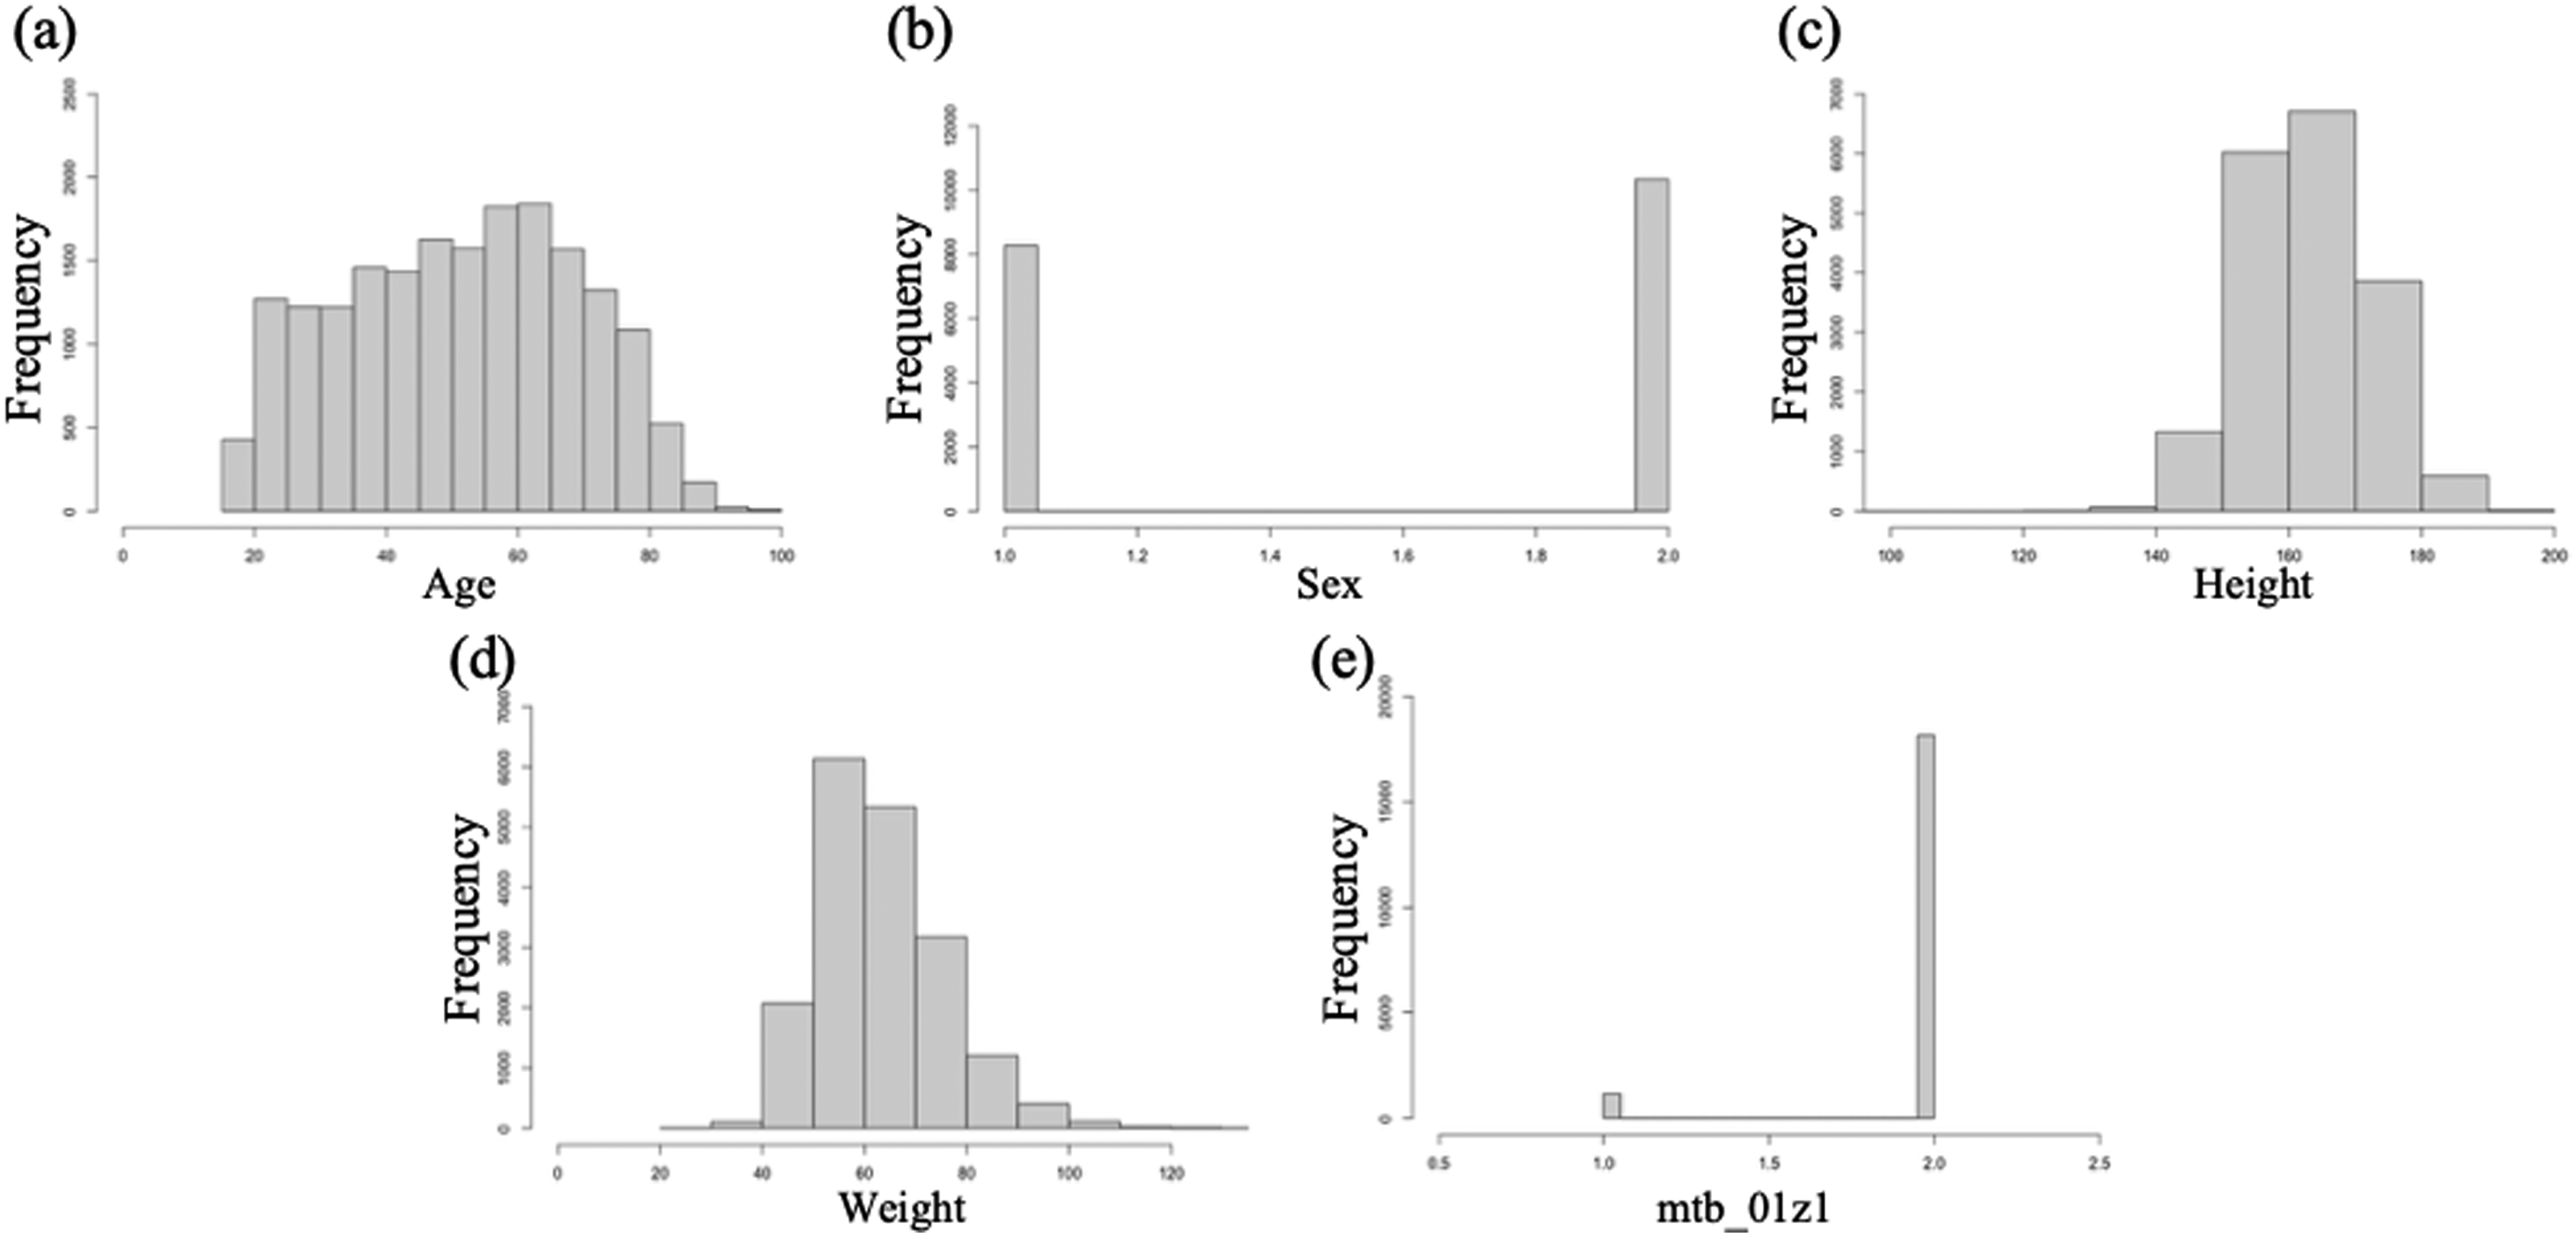
Examples of variable distributions in the dataset (Seoul, 2019):
Setting dependent variables and splitting datasets into 16 regions
To compare the important factors associated with mental health between the pre- and early pandemic periods, we set four dependent variables. First, the “mtb_01z1” variable indicates the experience of depression in the last year. The survey question for “mtb_01z1” was “During the past year, have you felt so sad or hopeless that it interfered with your daily life for more than two weeks in a row?” with binary answers. Second, “mta_01z1” denotes the subjective stress level. For this variable, answers in four category levels for the question “How much stress do you feel in your daily life?” were provided. Third, “mtc_01z1” indicates the average sleep time based on continuous answers. Answers for “mtc_01z1” were collected using the question, “How many hours per day do you usually sleep?” Finally, nine patient health questionnaire-9 (PHQ-9) variables (“mtb_07a1,” “mtb_07b1,” “mtb_07c1,” “mtb_07d1,” “mtb_07e1,” “mtb_07f1,” “mtb_07g1,” “mtb_07h1,” and “mtb_07i1”) denote depression levels with four-category answers. These nine variables were converted to single variables by summing the values of the nine variables. After converting the PHQ-9 variable, 41 columns remained.
To compare factors between regional conditions, we split the single dataset including converted dependent variables to 16 datasets based on the 16 regions of South Korea (Seoul, Pusan, Daegu, Incheon, Gwangju, Daejeon, Ulsan, Gyeonggi, Kangwon, Chungbuk, Chungnam, Jeonbuk, Jeonnam, Gyeongbuk, Gyeongnam, and Jeju). The detailed dimensions of the 16 regions in 2019 and 2020 are listed in Appendix 1.
Feature selection and separation of variables into three groups
Before applying the dataset to ML classifiers, we utilized lasso and ridge regression models to select variables associated with four dependent variables (“mtb_01z1,” “mta_01z1,” “mtc_01z1,” and “PHQ-9”). The coefficients of the variables from the lasso and ridge regression models were arranged in ascending order. Only the top 30 common variables were selected based on the magnitude of the coefficients.
Furthermore, to compare changes in the relative importance of each variable before and after the pandemic in detail, we divided the selected top 30 variables into three groups according to their rank of coefficients. Common variables between the arranged variable lists were selected for the lasso and ridge regression models. Variables included in each group were applied to ML algorithms to compare the influences of variables on dependent variables. The detailed coefficient values of the lasso and ridge regression models are listed in Appendix 2.
Evaluation of ML classification algorithms
To validate the importance changes in variables from trained ML algorithms in the simplest task condition, class labels of each dependent variable (“mtb_01z1,” “mta_01z1,” “mtc_01z1,” and “PHQ-9”) were converted to binary classes for matching class label conditions in dependent variables. In the case of “mta_01z1,” with four categories, the first- and second-level answers were changed to the label “1.” Similarly, third- and fourth-level answers were changed to the label “2.” Furthermore, the values of the “mtc_01z1” variable were converted to labels “1” and “2” based on the median value of the variable. Moreover, “PHQ-9” variables were also converted to labels “1” and “2” through their value size.
According to these class label conditions (i.e. binary class), we applied three ML classification algorithms (support vector machine classifier (SVC), logistic regression (LR) model, and XGBoost classifier) in our study. Furthermore, to evaluate the performance of each classifier in a rigorous setting, 10-fold cross-validation (10-fold CV) was used in the training and evaluation steps. Moreover, to improve the imbalance in the number of class labels, we used weights for insufficient class labels during a 10-fold CV.
Calculation of variable importance scores from feature importance results
We obtained 10 sets of feature importance score results (e.g. F-score for the XGBoost classifier, coefficient value for LR, and SVC) from the evaluated ML algorithms for each experimental condition. To compare the importance levels of the variables, 10 sets of scores were required to convert a single set of scores. We proposed a calculation formula for converting multiple sets of feature importance into a single set based on a previous study.
11
Based on this formula, we calculated single-importance scores for each variable. The detailed formula was as follows:
ML classification algorithms
To identify important factors related to mental health from the datasets, three ML classification algorithms were utilized. The first algorithm was the XGBoost classifiers. This algorithm is an ensemble version of multiple decision-tree classification algorithms. This algorithm minimizes the errors between the predicted and target values through objective functions in the training process. The objective functions consist of differentiable convex loss functions and penalized terms for regularization.
The second classification algorithm was an SVC with linear kernels. This algorithm classifies the feature space in the datasets by hyperplanes to classify class labels. To verify the importance of the coefficient values from the algorithms, we used linear kernels in our cases. The third algorithm was LR. The coefficients of the regression model were estimated using maximum likelihood estimation methods. This models calculated the likelihood value
Hyperparameters of the three ML classification algorithms.

ML: machine learning; SVC: support vector machine classifier; LR: logistic regression.
Evaluation criteria
The classification performance of each algorithm was evaluated using five evaluation criteria. We calculated the true positive (TP), false positive (FP), true negative, and false negative (FN) scores using a confusion matrix from the experimental results to evaluate the performances of the classifiers. The ratio of incorrectly classified instances was calculated using FN and FP. In contrast, correctly classified samples were represented by TP and FP. Consequently, we obtained four indices: accuracy, recall, precision, and f1-score. Moreover, to organize the receiver operating characteristic (ROC) curve, the TP rate and FP rate values were determined. The area under the ROC curve was calculated using the ROC curve. The formula for calculating these indices was as follows:


Tools
Python (version 3.7.1; scikit-learn, version 2.4.1) and R (version 4.0.3) programming languages were used to write all codes for ML classifiers, data preprocessing, and visualization.
Results
Baseline characteristics
After preprocessing and removing outliers or missing values in the datasets, the characteristics of the 2019 and 2020 datasets in the CHS dataset were examined to investigate their demographic information. The preprocessed dataset included survey results collected from 400,517 participants. The mean age of the participants at baseline was 55.25 years (SD = 17.86). In addition, the mean sleep time in the last week was 6.62 h (SD = 1.39), and the mean walking Dtime in the last week was 20.33 h (SD = 36.44). The detailed characteristics are listed in Table 4.
Baseline characteristics of the CHS dataset (2019 and 2020).
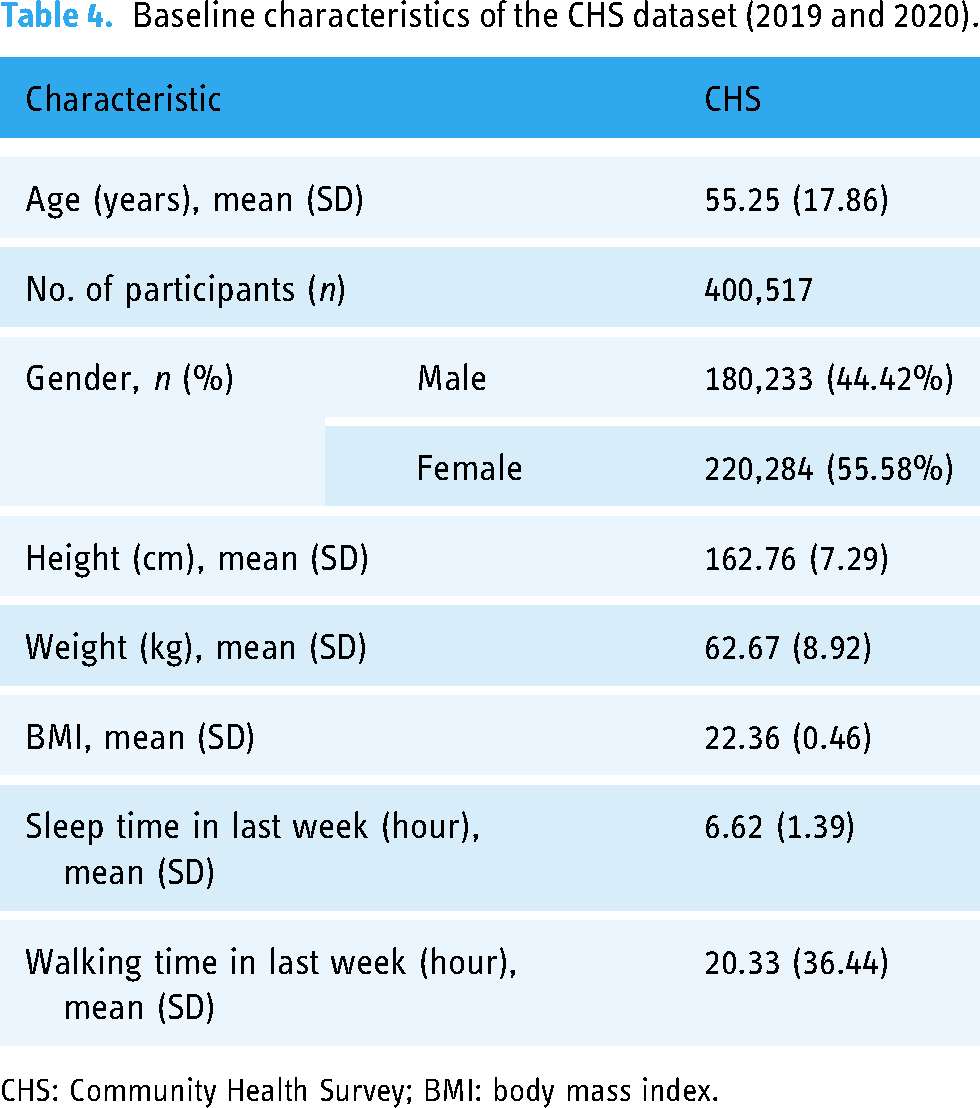
CHS: Community Health Survey; BMI: body mass index.
Classification performance of ML classifiers
To identify the optimal ML algorithms for our research topic (i.e. comparing the importance of variables with regard to mental health variables), we compared the classification performances of three ML algorithms (XGBoost classifier, SVC, and LR). Among these, the XGBoost classifier showed the best performance (average of over 92% in five indices) under all experimental conditions. The detailed averaged experimental results are presented in Table 5.
Averaged classification performance results for ML classifiers with four dependent variables (“mtb_01z1,” “mta_01z1,” “mtc_01z1,” and “PHQ-9”).

ML: machine learning; PHQ-9: patient health questionnaire-9; SVC: support vector machine classifier; LR: logistic regression; AUC: area under the receiver operating characteristic curve.
Feature importance of ML algorithms with regard to mental health variables
Among the three ML algorithms for classification, the feature importance results of the XGBoost classifier were validated based on the classification performance results. In addition, the important variables in the three groups between 2019 and 2020 were compared to examine the influences of the COVID-19 pandemic on mental health-related dependent variables. Moreover, population densities and the number of COVID-19 confirmed cases in each of the 16 regions were considered to reflect external conditions for comparison. This information is presented in Table 6 and Figure 3. 22
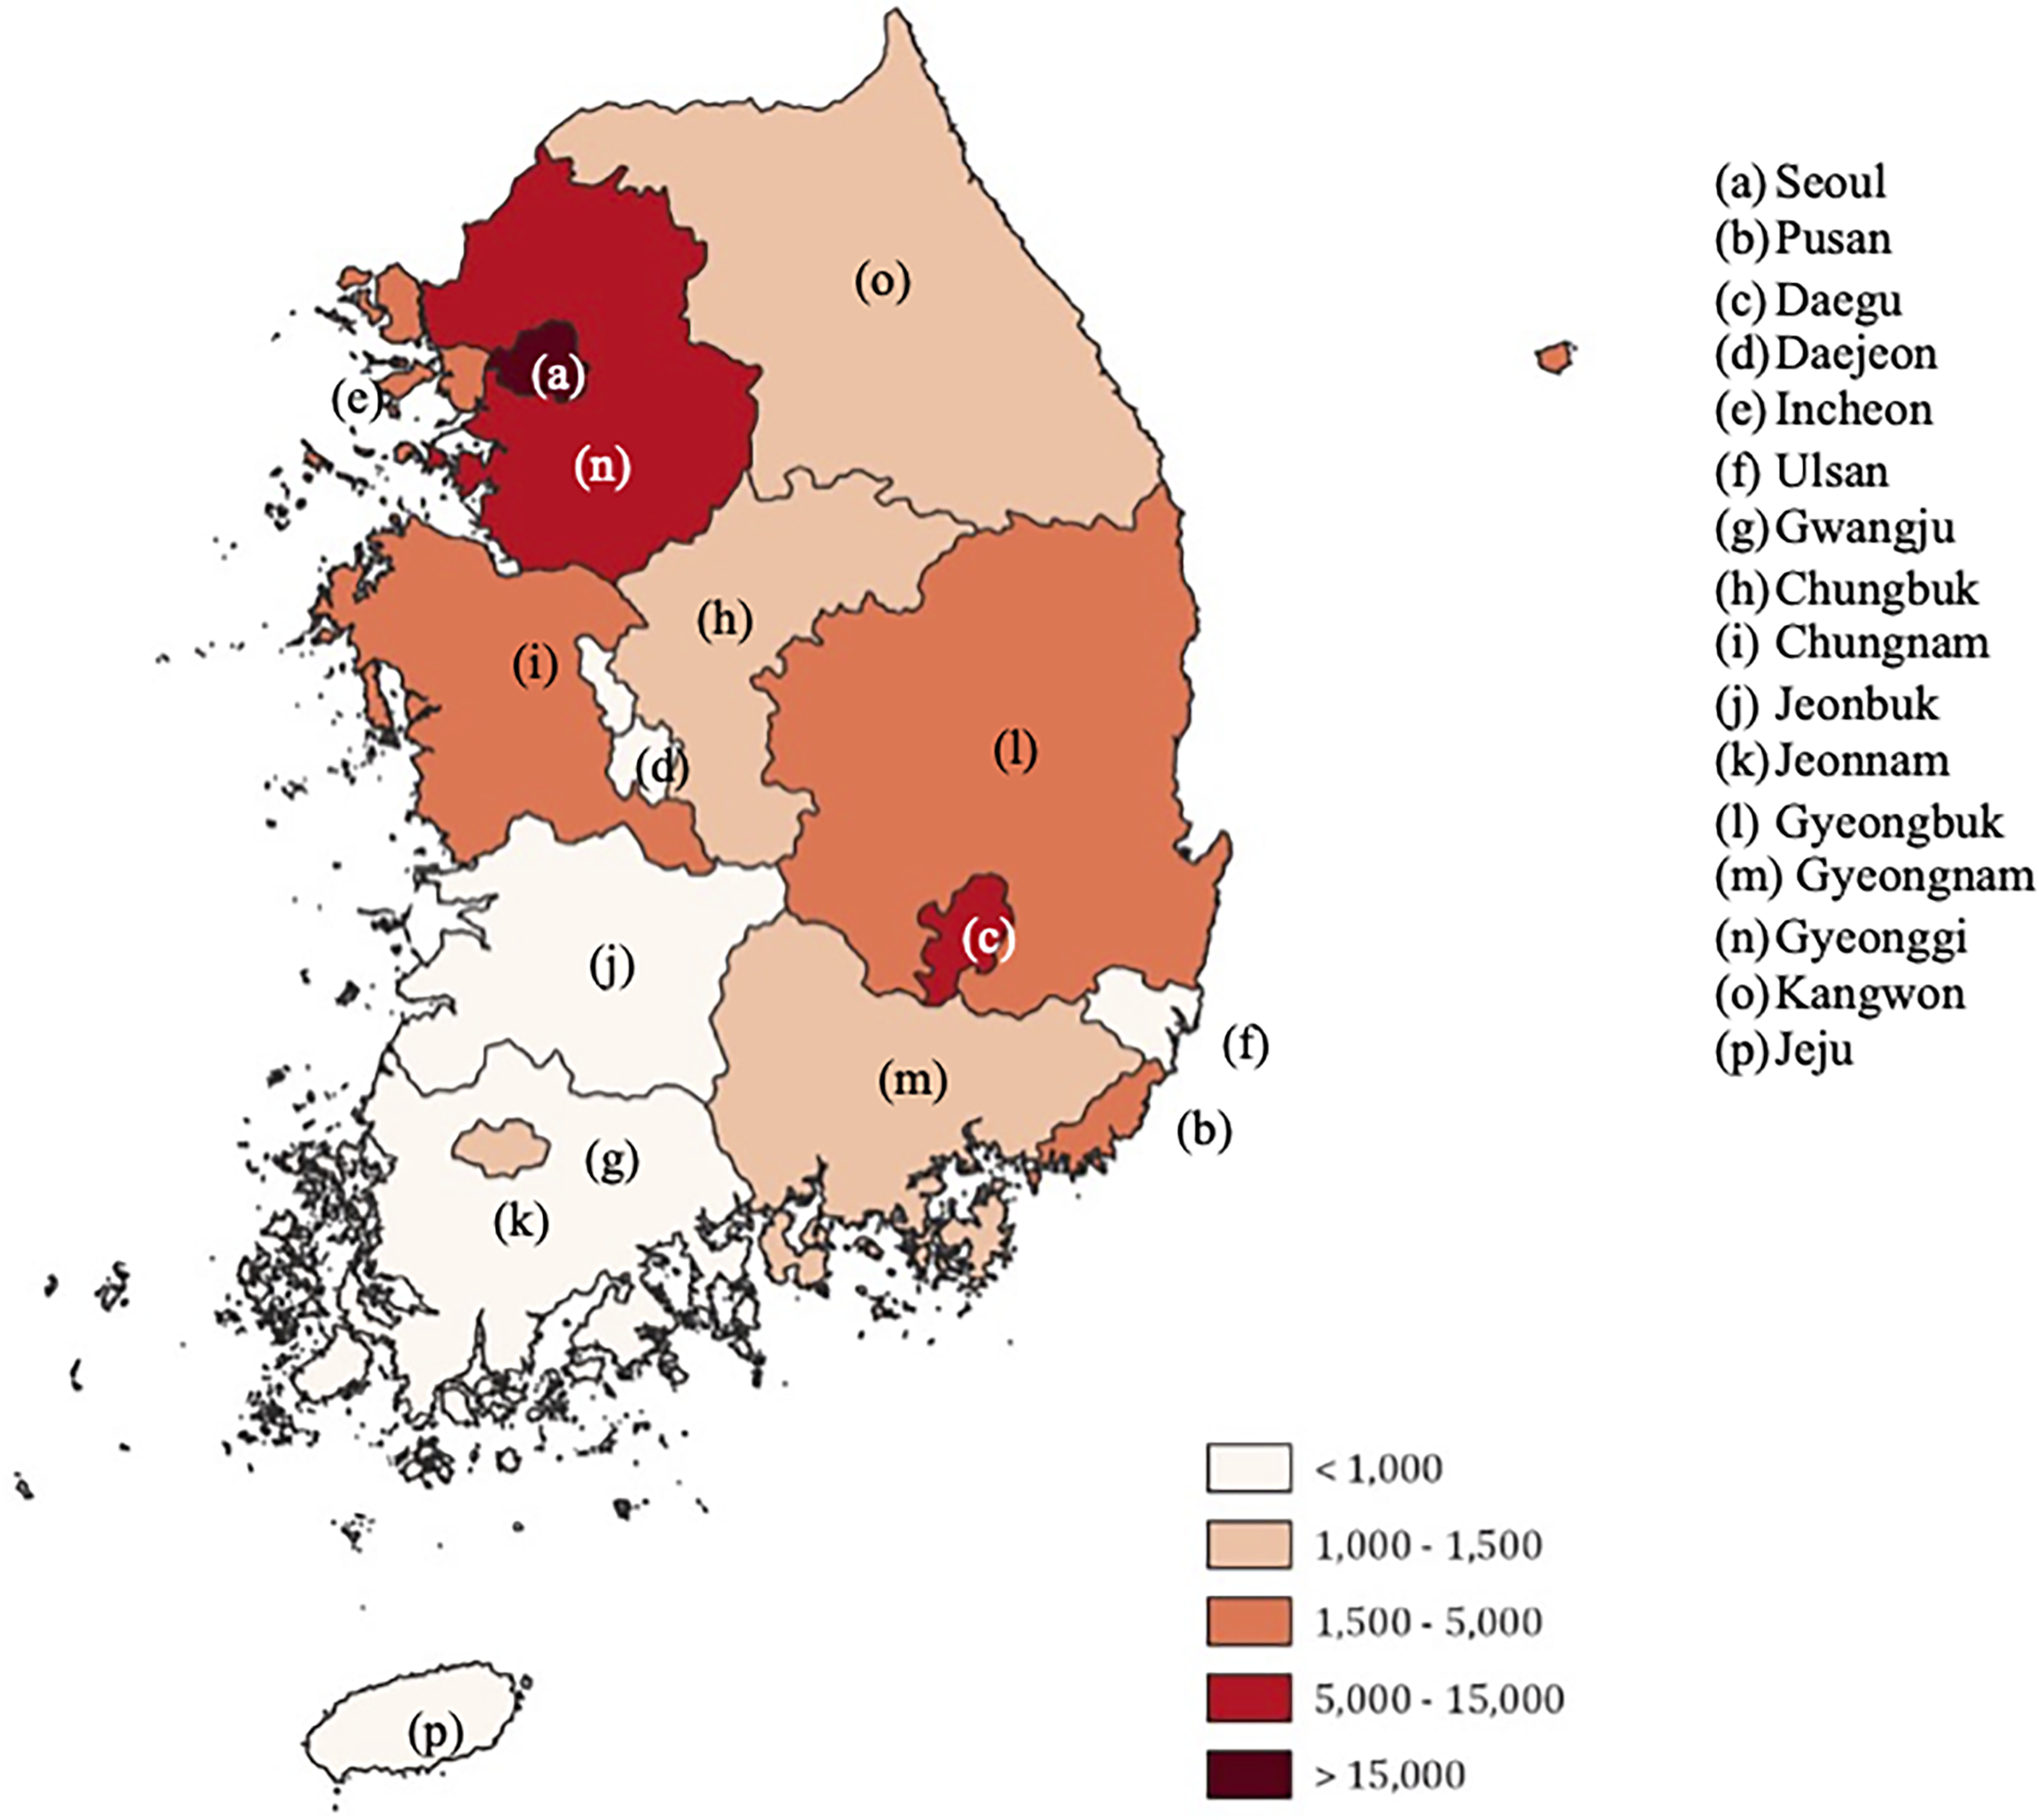
Coronavirus disease 2019 (COVID-19) confirmed cases in South Korea in 2020 by region.
Population of the 16 regions in South Korea (2020).

Some similarities and differences existed in the overall results. Regarding similarities, psychiatric (e.g. stress level) and sociodemographic variables (e.g. income) were found together simultaneously. Second, in Group 1, the variables with the most importance, that is, “fma_01z1” (number of household members), “fma_02z1” (number of household members over the age of 19 years), “ora_01z1” (subjective oral health level), “orb_01z1” (chewing discomfort), and “sra_01z3” (failure to receive essential medical services), were commonly checked. Third, demographic variables such as “age” or “weight” were found mainly in Group 2.
In contrast, there were some differences in the ranking of variables according to the dependent variable. First, in the case of “mtb_01z1” (experience of depression in the last year), the “mtc_01z1” (average sleep time) variable ranked the highest in 2020 (i.e., early pandemic) for the overall region. Second, in the results for “mta_01z1” (subjective stress levels), depression-related variables (“mtb_01z1”) were included in Group 1. This trend was especially evident in the data collected from four regions (Seoul, Gyeonggi, Incheon, and Daegu) with many confirmed cases. Furthermore, “ira_01z1” and “ira_02z1” (accident or addiction experience) variables were included regardless of year. Third, in the case of “PHQ-9,” oral health-related variables disappeared in Group 1 during the early pandemic period (i.e. 2020). Furthermore, accident or addiction experience-related variables (“ira_01z1” and “ira_02z1”) were newly added in 2020. Considering only the regions based on the number of confirmed cases, “apt_t” (house type) and “town_t” (type of residence) variables were included in four regions (i.e. Seoul, Gyeonggi, Incheon, and Daegu) with many confirmed cases and high population densities. However, we could not identify any significant differences in the results for “mtc_01z1” (average sleep time). The detailed importance of the variables for each dependent variable in the four regions is listed in Table 7 and Appendix 3. Other results for the remaining regions are included in Appendix 4.
Important variables and importance scores for XGBoost classifiers with “mtb_01z1” (experience of depression in the last year) in four regions (Seoul, Gyeonggi, Incheon, and Daegu) with many confirmed cases of COVID-19.

Based on the above results, we additionally validated the changes in variable values between 2019 and 2020 using statistical tests. Among the several variables to be verified, only continuous variables (“mtc_01z1”) were used for validation with paired t-tests. The null hypothesis was set as “No difference exists in average sleep time before and after the pandemic.” The results of paired t-tests confirmed that the difference in sleep time before and after the pandemic was statistically significant (p-value < 0.05). The detailed results of the paired t-tests are presented in Table 8.
The results of paired t-tests regarding sleep time differences before and after the pandemic.

Discussion
Principal results
In this study, we attempted to identify changes in the factors associated with mental health, including depression and stress levels, during the early pandemic period in South Korea. To compare the variables between the pre- and early pandemic periods, we utilized the 2019 and 2020 datasets from the CHS dataset based on the time the World Health Organization declared COVID-19 to be a pandemic (12 March 2020). To consider diverse variable categories for analysis, sociodemographic and psychiatric variables were included in the datasets during our preprocessing steps. In addition, the population and number of confirmed cases of COVID-19 in the 16 regions of South Korea were considered simultaneously to reflect external conditions.
Among 49 selected common variables across the 2019 and 2020 datasets, we selected 12 mental health-related variables (“mtb_01z1,” “mta_01z1,” “mtc_01z1,” and nine “PHQ-9” variables) as dependent variables. Finally, we set four variables, including a single variable for “PHQ-9,” by summing the values of nine variables (“mtb_01z1,” “mta_01z1,” “mtc_01z1,” and “PHQ-9”). Analyses were then conducted according to the four dependent variables. To compare the detailed importance of each variable, we split the variables into three groups (Groups 1, 2, and 3) based on the magnitude of coefficients from the lasso ridge regression models (i.e. variables contained in Group 1 indicated that variables showed the highest rank of coefficient of two regression models).
ML classification algorithms were applied to identify latent patterns between independent variables in various categories and dependent variables. The class labels of the dataset in all experimental conditions for applying the algorithms were matched to binary class conditions to compare the experimental results in rigorous settings. Feature importance results of the best classification performances (i.e. XGBoost classifier) were used to identify differences in variables during the early pandemic period. As a result, we validated alterations in variable importance between 2019 (pre-pandemic) and 2020 (early pandemic) in three groups and 16 regions in South Korea.
To interpret our experimental results, we divided the results into four dependent variables and verified the results with those of related previous studies. Furthermore, before analyzing the results by dependent variables, three common points in the variables were found in the overall results. First, both socioeconomic (e.g. the number of household members and town type) and psychiatric variables (e.g. depression and stress level) were checked in Group 1. In this regard, De Figueiredo et al. 11 found that social life and stress-associated factors were highly correlated with mental health. Moreover, relationships between mental health-related variables and suicide attempts were also observed in their research.
Second, health variables not related to mental health (e.g. subjective oral health level, chewing discomfort, and failure to receive essential medical services) were commonly assessed in Group 1. Ciardo et al. 23 investigated the associations between oral health-related quality of life and depression and anxiety levels. Seo et al. 24 found that daily visits to mental health services reduced during the COVID-19 pandemic. They also suggested that patients with anxiety or depressive disorders may have concerns regarding the spread of COVID-19 and may be more reluctant to visit psychiatric outpatient clinics. Third, in Groups 2 and 3 (i.e. variables with relatively lower importance than variables in Group 1), variables related to demographic characteristics such as age, height, and weight were found. Xiong et al. 25 investigated the importance of socioeconomic variables on mental health through systematic reviews of previous studies compared to demographic factors, including age and body mass index.
In the case of our results with four dependent variables, first, regarding the “mtb_01z1” (experience of depression) variable, unlike during the pre-pandemic period (2019 dataset), average sleep time variables (“mtc_01z1”) were newly included in Group 1, and they showed the highest ranking during the early pandemic period (2020 dataset). We found the same trends for all 16 regions. Franceschini et al. 26 showed that sleep-related factors were associated with mental health during the COVID-19 lockdown in the general population living in Italy. They found that changing the sleep–wake rhythm (i.e. habitual bedtime and awakening) could affect psychological distress during a pandemic. Kocevska et al. 27 found that changes in sleep quality throughout the pandemic were associated with negative affect and worry in the Netherlands. Moreover, they found that pre-pandemic good sleepers frequently experienced sleep complaints during the pandemic.
Second, in our results for the dependent variables concerning subjective stress level (“mta_01z1”), the experience of depression variables (“mtb_01z1”) was added to Group 1 of the early pandemic period (2020). Khademian et al. 28 identified a relationship between mental health factors (e.g. anxiety and depression) and stress-related factors (e.g. living with high-risk family members and social capital) during the pandemic in Iran. In addition, they verified that age did not have significant associations with depression, anxiety, and stress in their research. Furthermore, Othman 29 investigated the relationships between high levels of mental health disorders during the pandemic and increasing depression in Iraq. Among the 16 regions in South Korea in particular, four regions (Seoul, Gyeonggi, Incheon, and Daegu) with higher confirmed cases and populations showed clear trends compared with other regions. Henning-Smith et al. 30 compared rural and urban locations in the United States to identify differences in the prevalence of mental health and social well-being outcomes. The authors found that the number of COVID-19 concerns of urban residents is higher than that of rural residents. These results suggest that these trends could be affected by the spreading situation in urban areas that occurred during the early pandemic.
Third, with respect to the results in which the “PHQ-9”(depression level) variable was the dependent variable, variables related to experiences of accident or addiction (“ira_01z1” and “ira_02z1”) were included in Group 1 during the early pandemic period. Davis et al. 31 investigated pre-COVID-19 posttraumatic stress disorder with greater alcohol use and binge drinking and found that these were associated with a higher risk of mental health, including loneliness, in American veteran groups. They also examined the associations between economic hardship and negative reactions to COVID-19 and alcohol use and drinking. Moreover, the results for the four regions with higher populations and confirmed cases showed that house type and type of residence variables (“apt_t” and “town_t”) were included in Group 1 with higher ranks. We considered the possibility of the influence of location type (i.e. urban or rural cities) to interpret these results, similar to previous interpretations. 30
In summary, based on the aforementioned studies, we verified whether similar trends in mental health were shown in the early pandemic period in South Korea with other countries. Moreover, the aforementioned trends were checked more clearly in the regions with higher populations or the number of confirmed cases.32–34 Based on these results, we validated our analytical methodologies through comparisons with previous studies. The impact of the COVID-19 pandemic on the mental health of the general population living in South Korea was also confirmed by our experimental results. In addition, we identified other factors that were related to the population and number of confirmed cases in each region.
Strength and limitations
This study has several strengths. First, longitudinal datasets collected from 16 regions in South Korea were used to compare mental health-related factors during the pre- and early pandemic periods. Second, variables in diverse categories without any exclusion of categories were applied to identify associations with mental health during the COVID-19 pandemic. Third, ML algorithms were used to identify the relationships between candidate factors and mental health-related factors. Fourth, an additional analysis with regional characteristics (population and number of confirmed cases) was conducted to verify the influence of external conditions on mental health factors. However, our study had some limitations. First, we did not reflect on all characteristics that could affect the mental health of groups living in South Korea, such as specific diseases. Nevertheless, all common variables, including oral health and diabetes, were used for the analysis. Second, diverse deep-learning algorithms could be used to identify related factors in our research. Although deep learning algorithms have been applied in many previous studies that have explored similar research topics, ML algorithms have an advantage in terms of convenience for feature importance compared with deep learning algorithms. Third, we conducted this research based on the populations collected in South Korea. To generalize our experimental results, we need to compare analysis results from other countries. Finally, other mental health-related factors could be checked in a more detailed analysis including causal analysis. Moreover, the influences of each related factor can change during the pandemic (i.e. from the pandemic stage to the endemic stage). We plan to conduct further analyses with detailed topics and additional multivariable analysis methods (e.g. deep learning algorithms) in future studies.
Conclusions
Our findings show that the importance of mental health factors changed during the early pandemic period in South Korea. The most important factors for each mental health dependent variable were average sleep time, experience of depression, and experience of accidents or addictions. In regions with a higher population and confirmed cases, house type and type of residence were identified, together with the aforementioned factors.
Footnotes
Contributorship
JGC and SHH contributed to the conception and design of the study. JGC and SHH contributed to the analysis and interpretation of the data. JGC contributed to the drafting of the manuscript.
Declaration of conflicts of interest
The authors declared no potential conflicts of interest with respect to the research, authorship, and/or publication of this article.
Funding
The authors disclosed receipt of the following financial support for the research, authorship, and/or publication of this article: This study was funded in part by the Yonsei Signature Research Cluster Program of 2023 (2023-22-0013) and in part by the National Research Foundation of Korea (NRF) grant through the Korean Government (Ministry of Science and ICT [MSIT]) under Grant 2019R1A2C1007399.
Ethical approval
Not applicable.
Consent statement
Not applicable. (The CHS dataset used in this study was collected by the KDCA and released for research purposes and were approved for data analysis by the institute.)
Copyright information
Not applicable. (![]() was used in a previously published paper and we received confirmation from the journal that the research paper
22
is an open-access journal and there are no restrictions on the reuse of the figure.)
was used in a previously published paper and we received confirmation from the journal that the research paper
22
is an open-access journal and there are no restrictions on the reuse of the figure.)
Guarantor
SHH
Appendix 1
The dimensions of the datasets of 16 regions in 2019 and 2020.
Appendix 2
The coefficient values of the lasso and ridge regression models.
Appendix 3
Remaining experimental results for the 12 regions.
Appendix 4
The importance of variable results for remaining 8 regions.